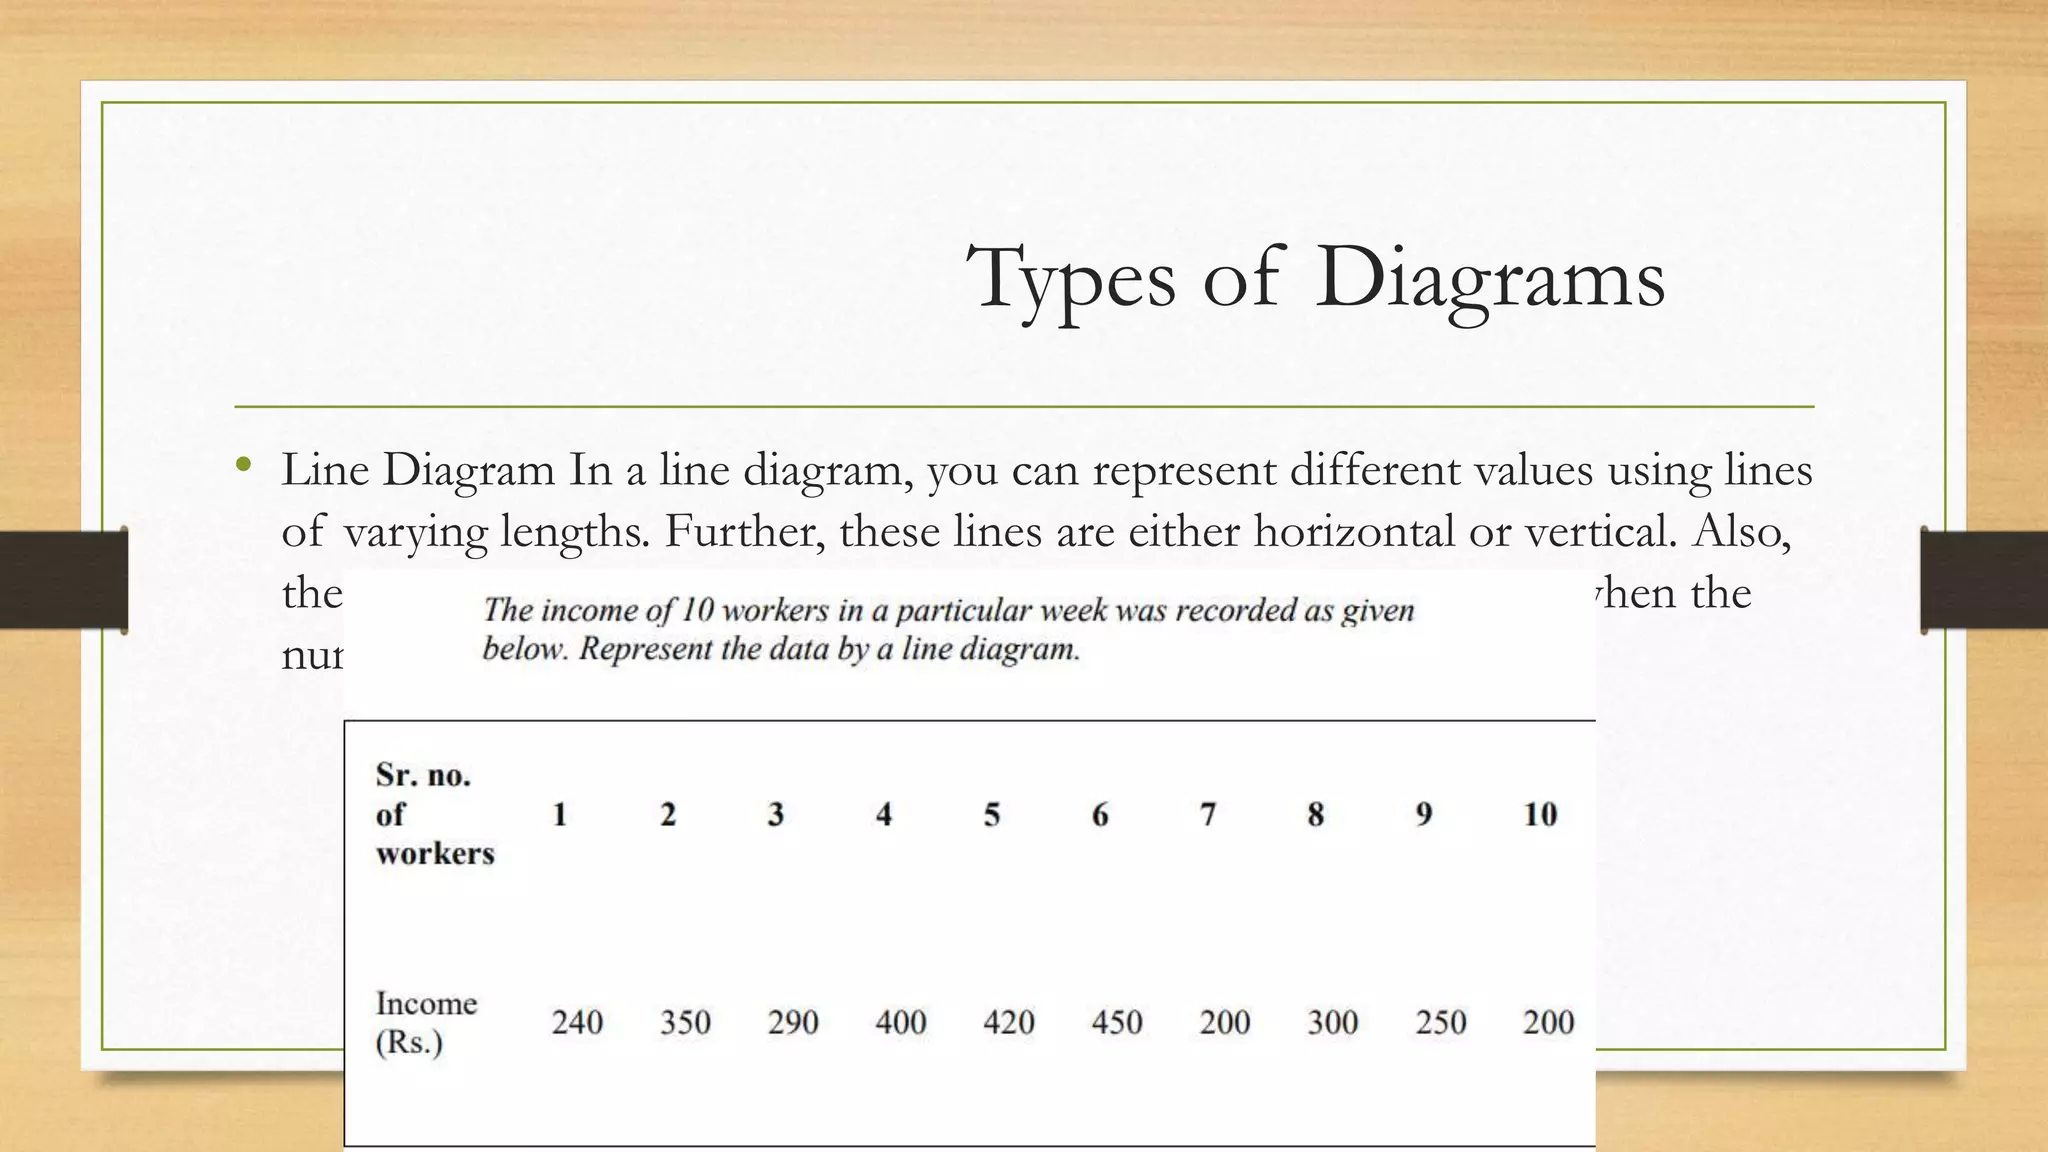
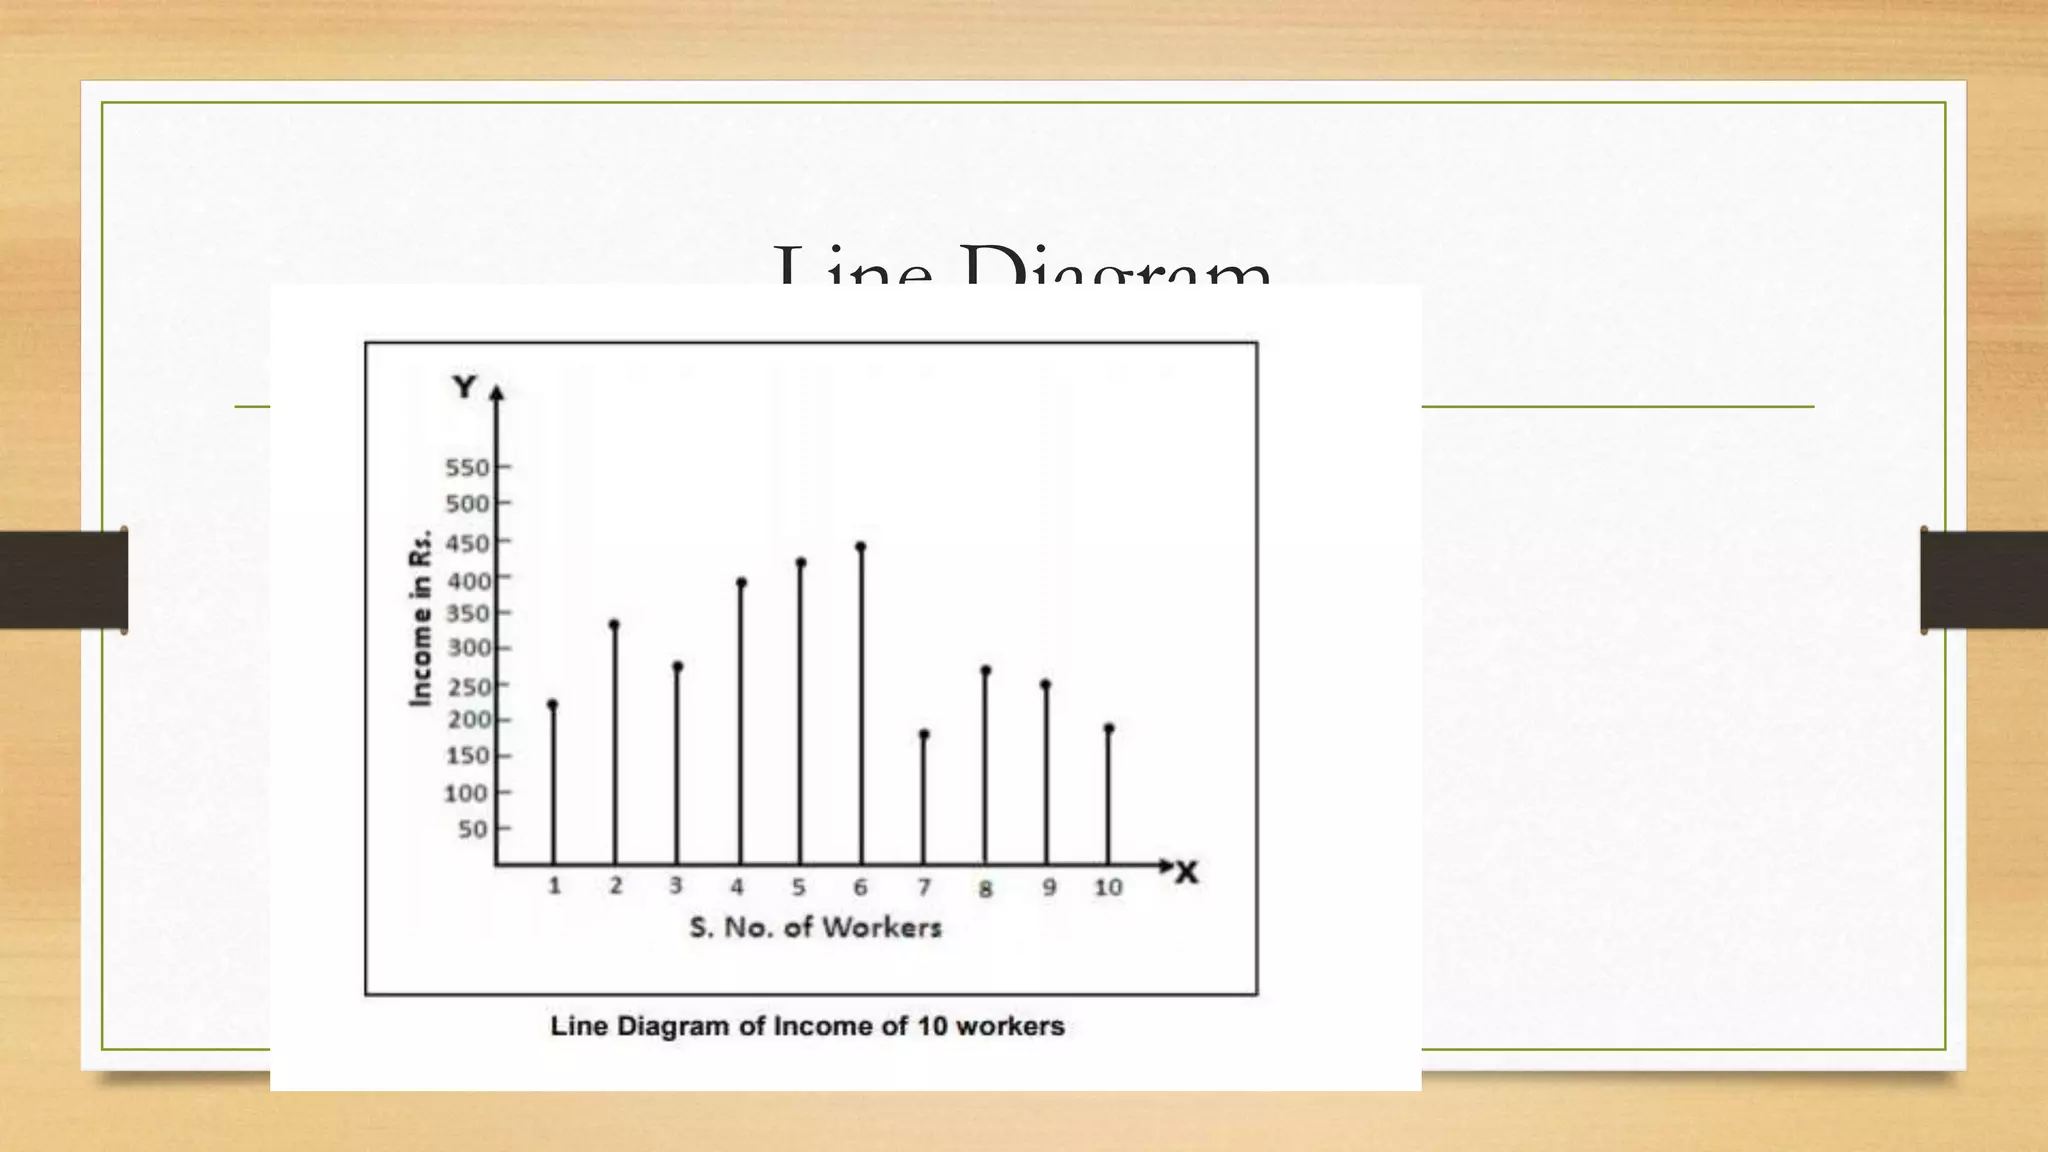
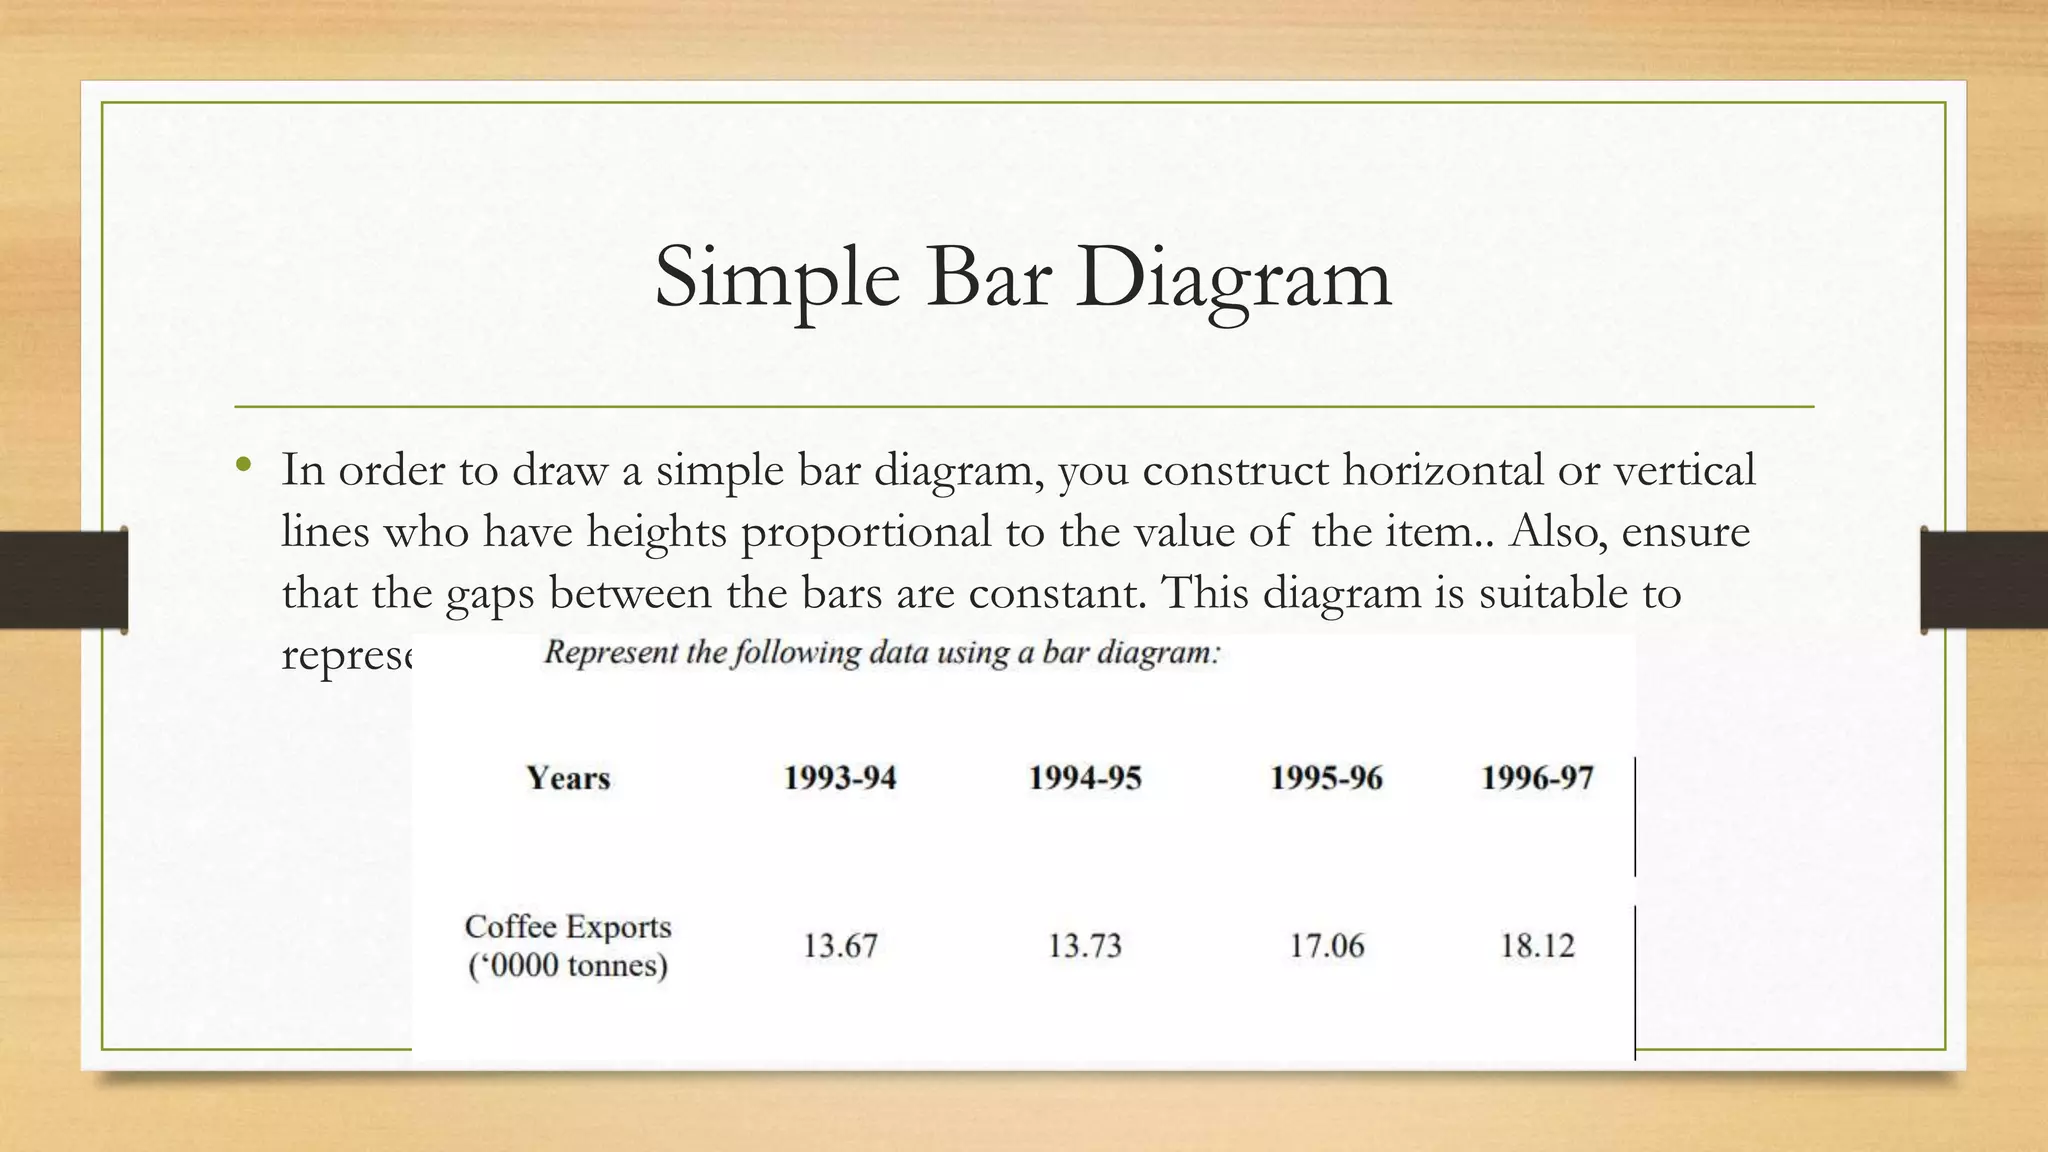
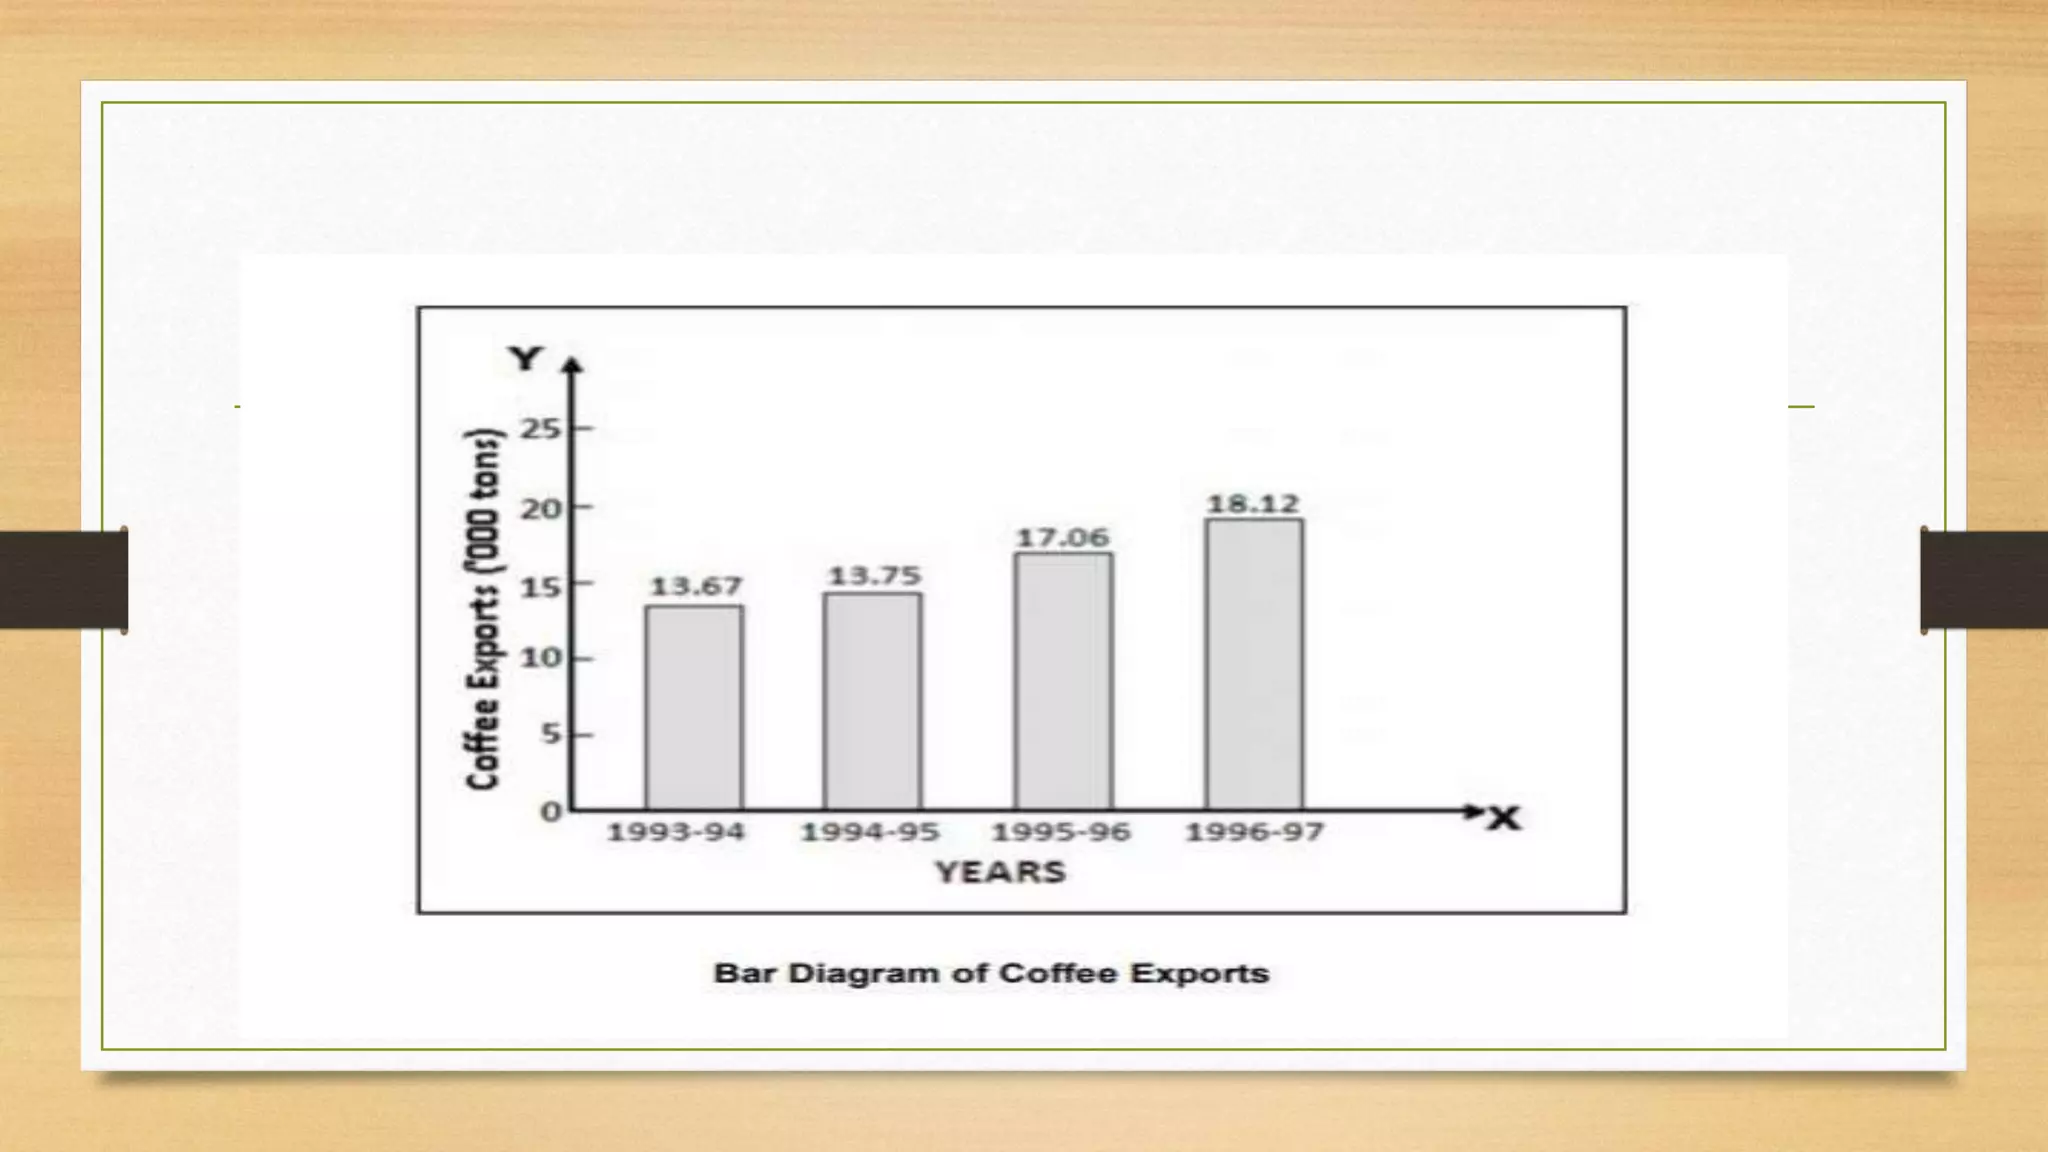
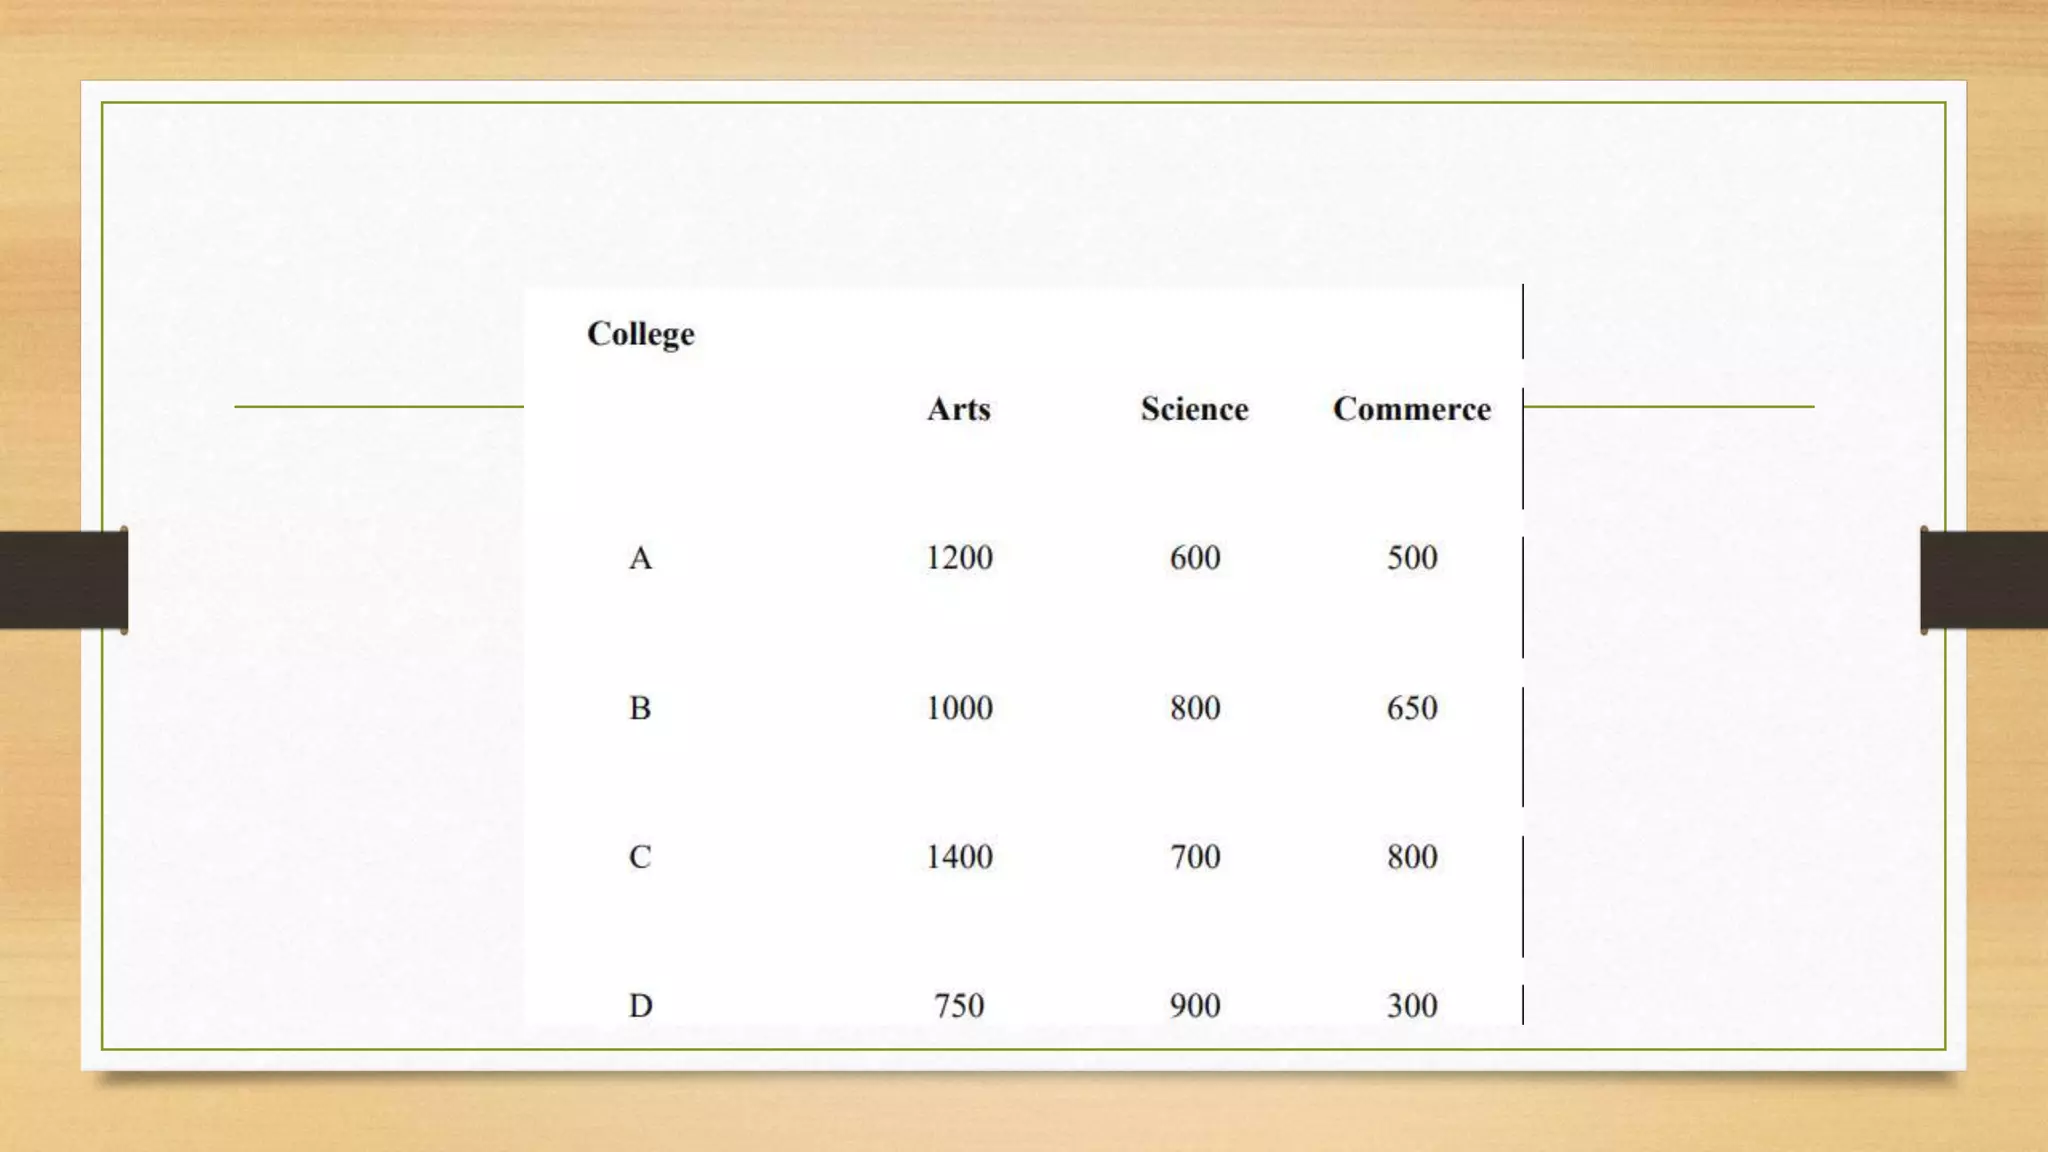
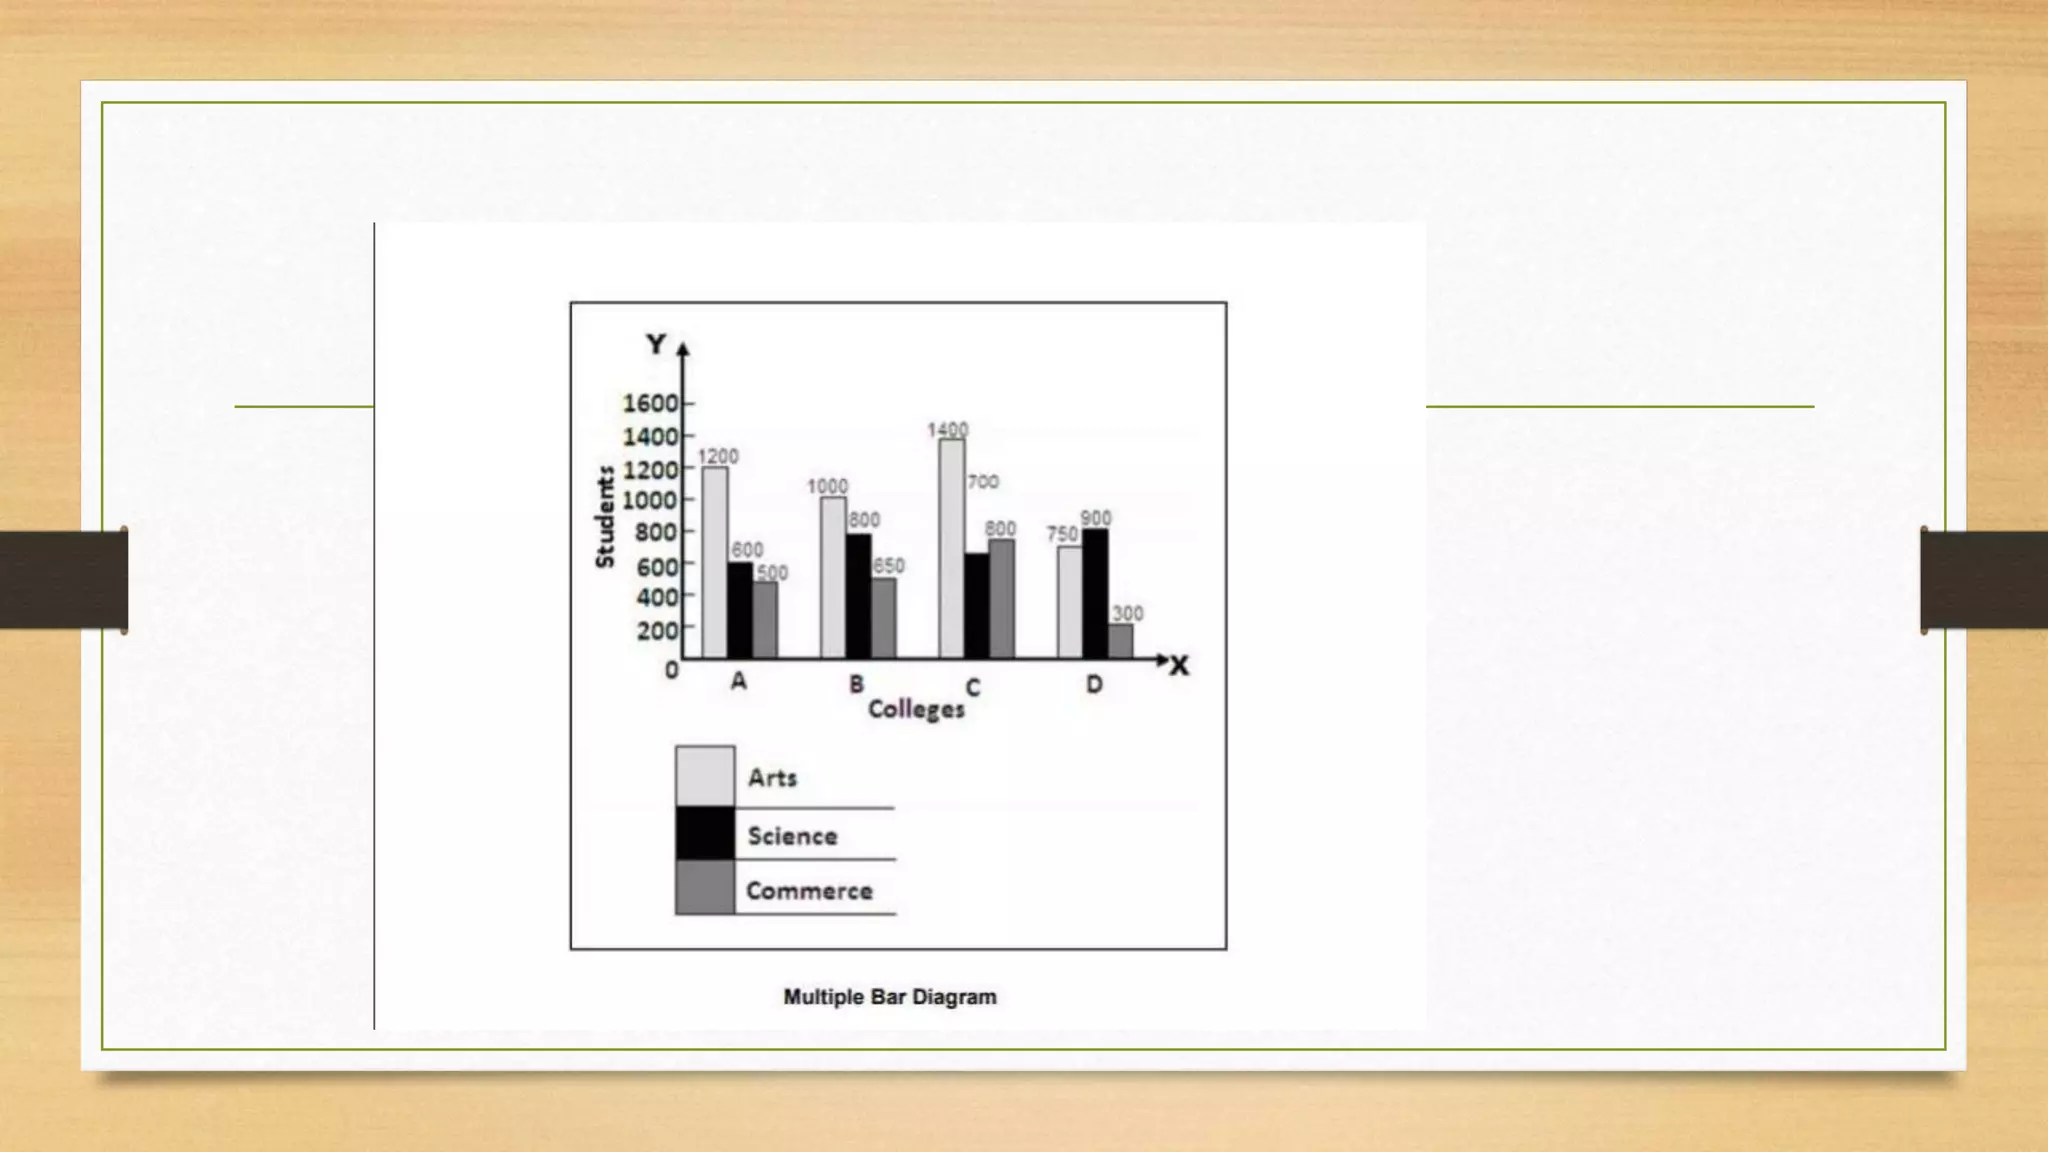
There are three main types of diagrams: line diagrams which represent values using lines of varying lengths that are either horizontal or vertical with uniform gaps; bar diagrams which use horizontal or vertical lines of proportional heights to represent values with constant gaps between bars and can be simple or multiple; and multiple bar diagrams which show comparisons between data sets by drawing bars side-by-side without gaps between sets and coloring the different bars.