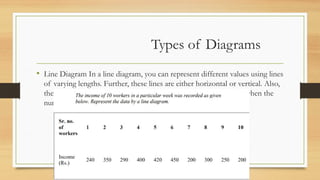
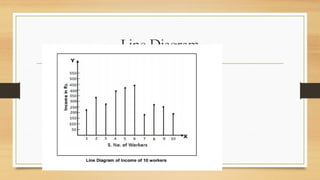
The document describes various types of diagrams including line diagrams, simple bar diagrams, and multiple bar diagrams. Line diagrams use lines of different lengths to represent values, while simple bar diagrams use bars with heights proportional to their values. Multiple bar diagrams are used to compare two or more data sets side-by-side with distinct colors or shading.