1. The document discusses pie charts and ogives, which are graphical representations used to illustrate numerical proportions and cumulative frequencies in data sets.
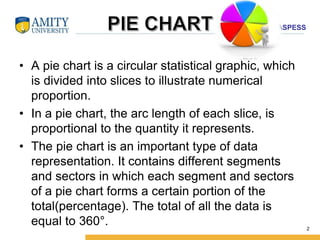
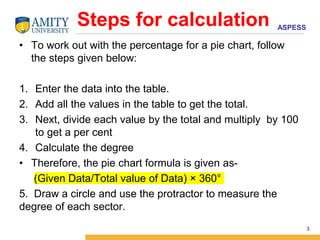
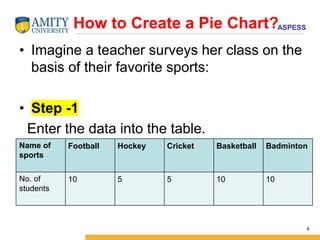
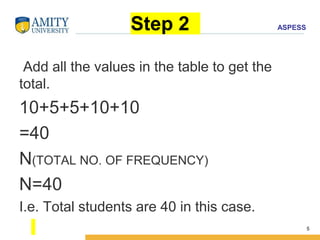
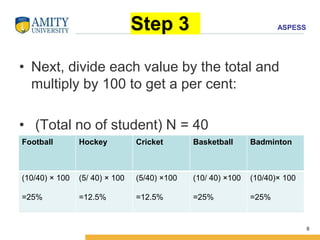
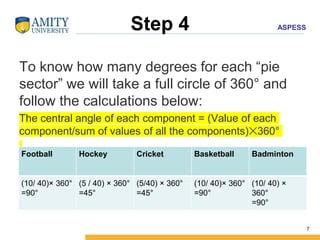
2. A pie chart is divided into circular slices proportional to the quantities being represented. To create a pie chart, data is entered into a table, totals are calculated, and percentages are used to determine the central angle of each slice relative to 360 degrees.
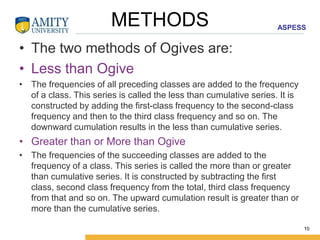
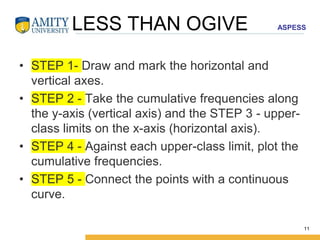
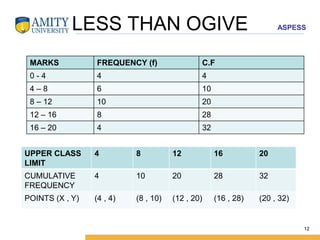
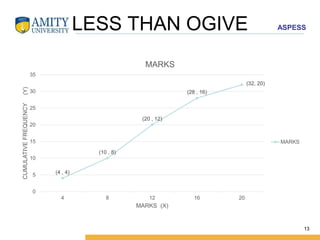
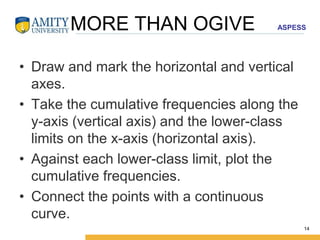
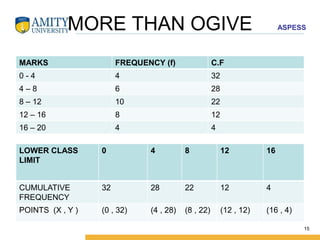
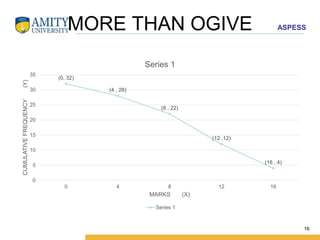
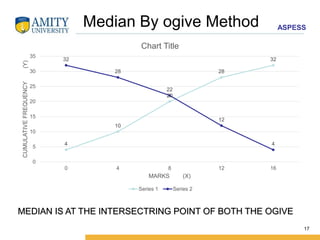
3. An ogive graph shows cumulative frequencies on the y-axis plotted against variable class limits on the x-axis. Less than and greater than ogives can be created by cumulating frequencies downward and upward, respectively. The median can be identified as the point where the less than and greater than ogives intersect.