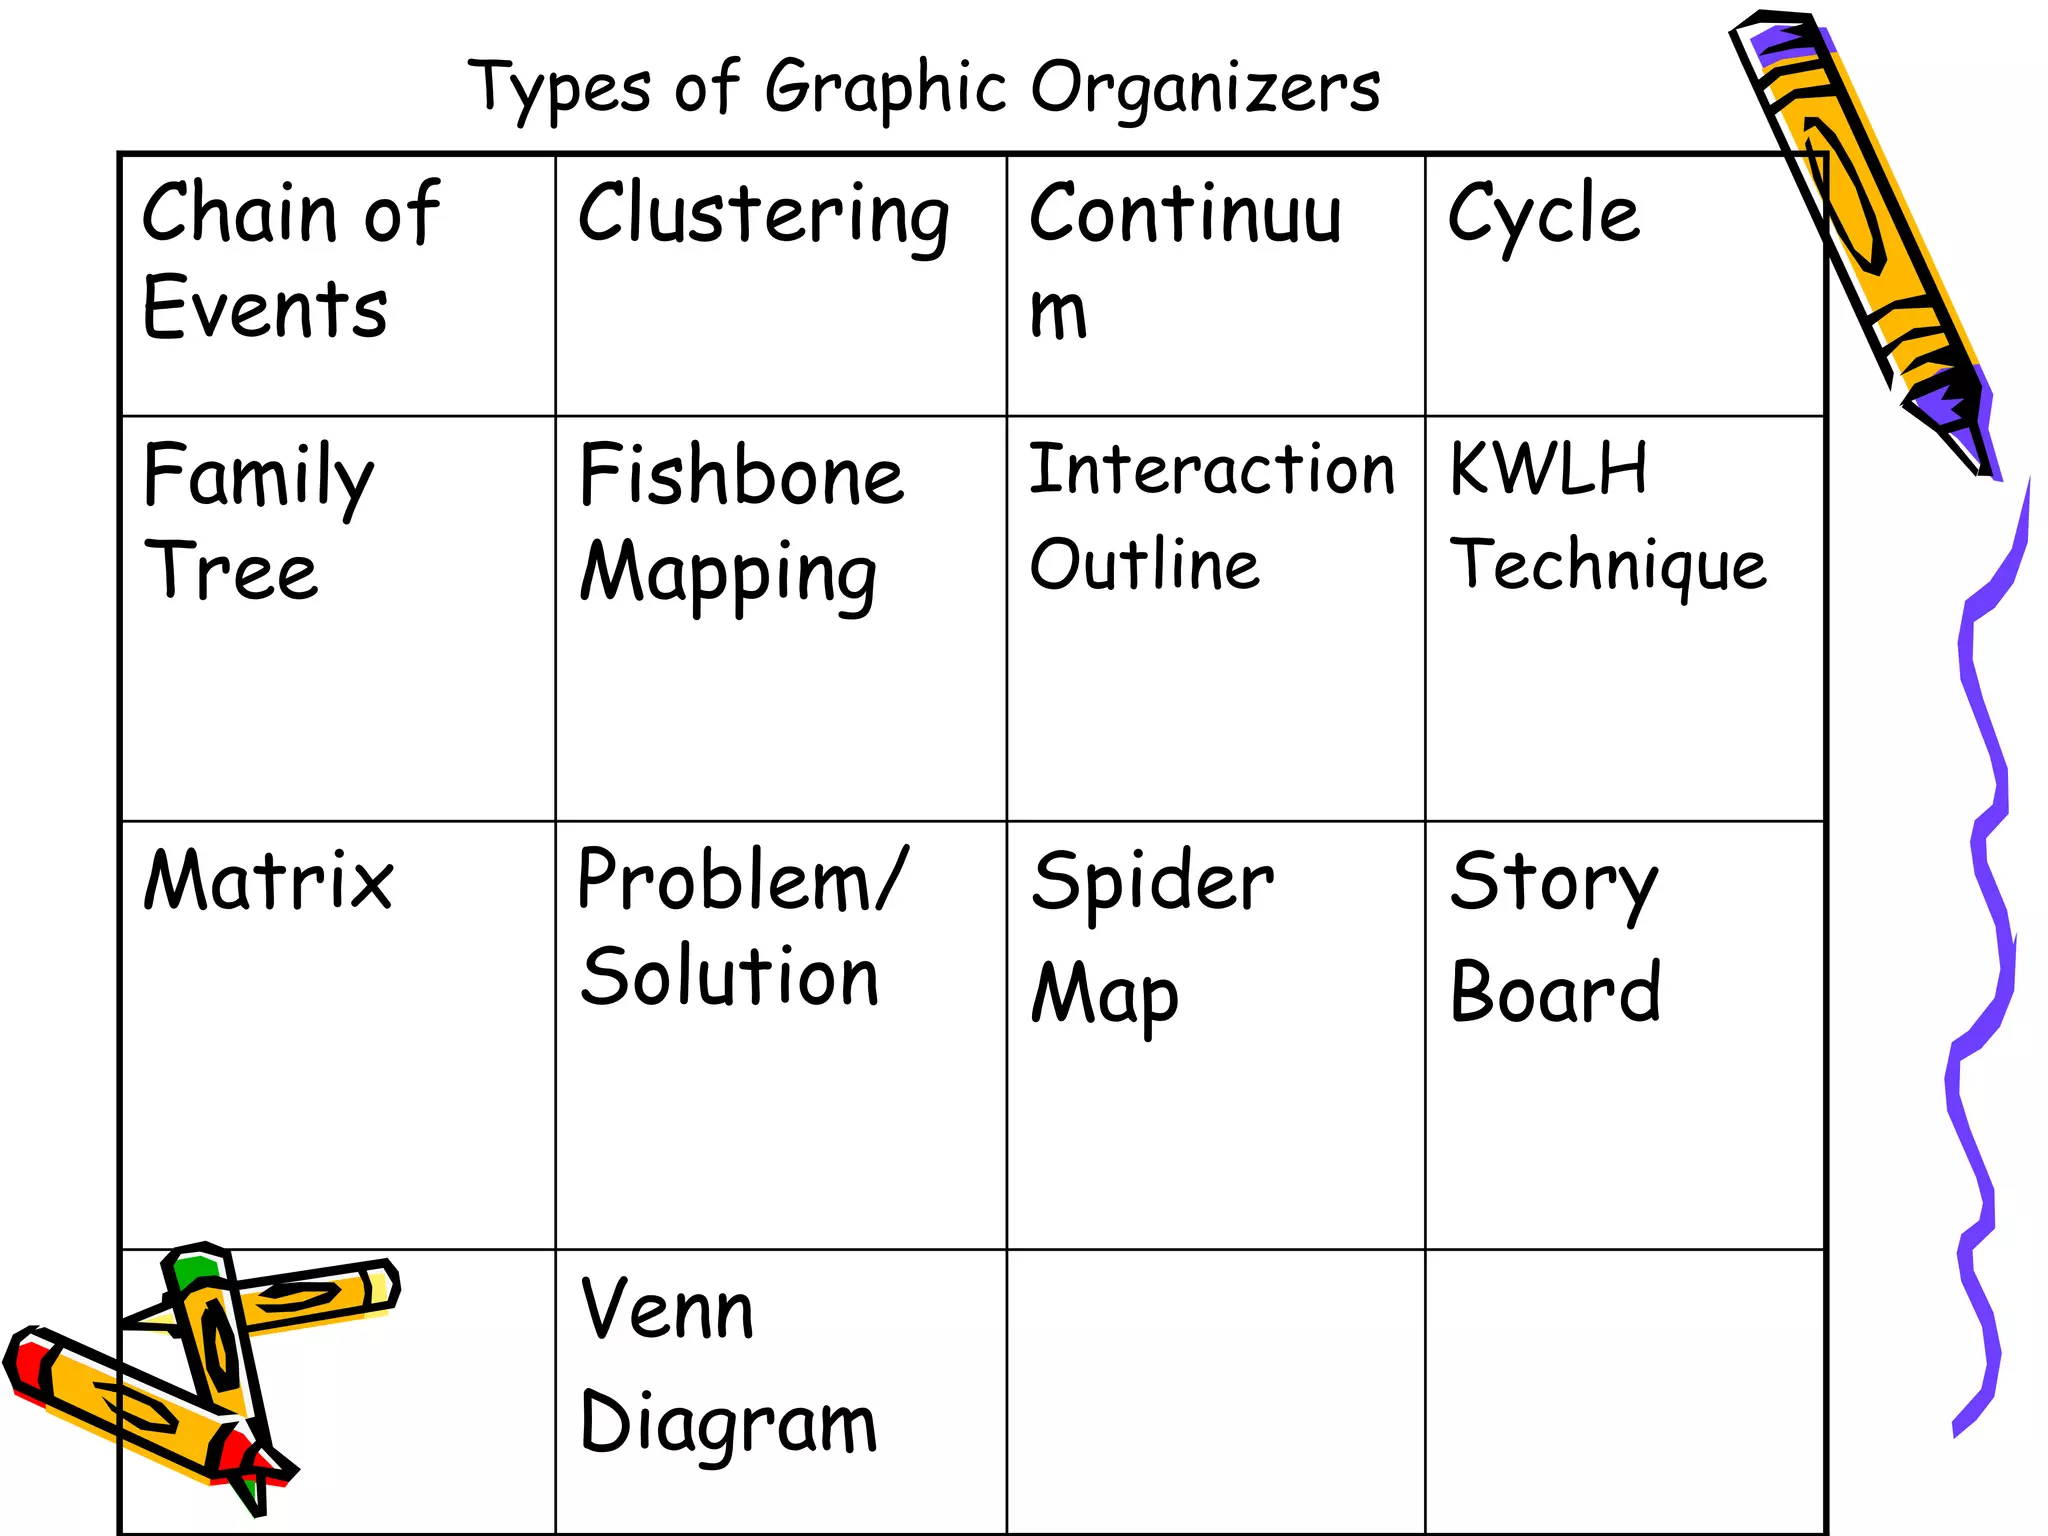
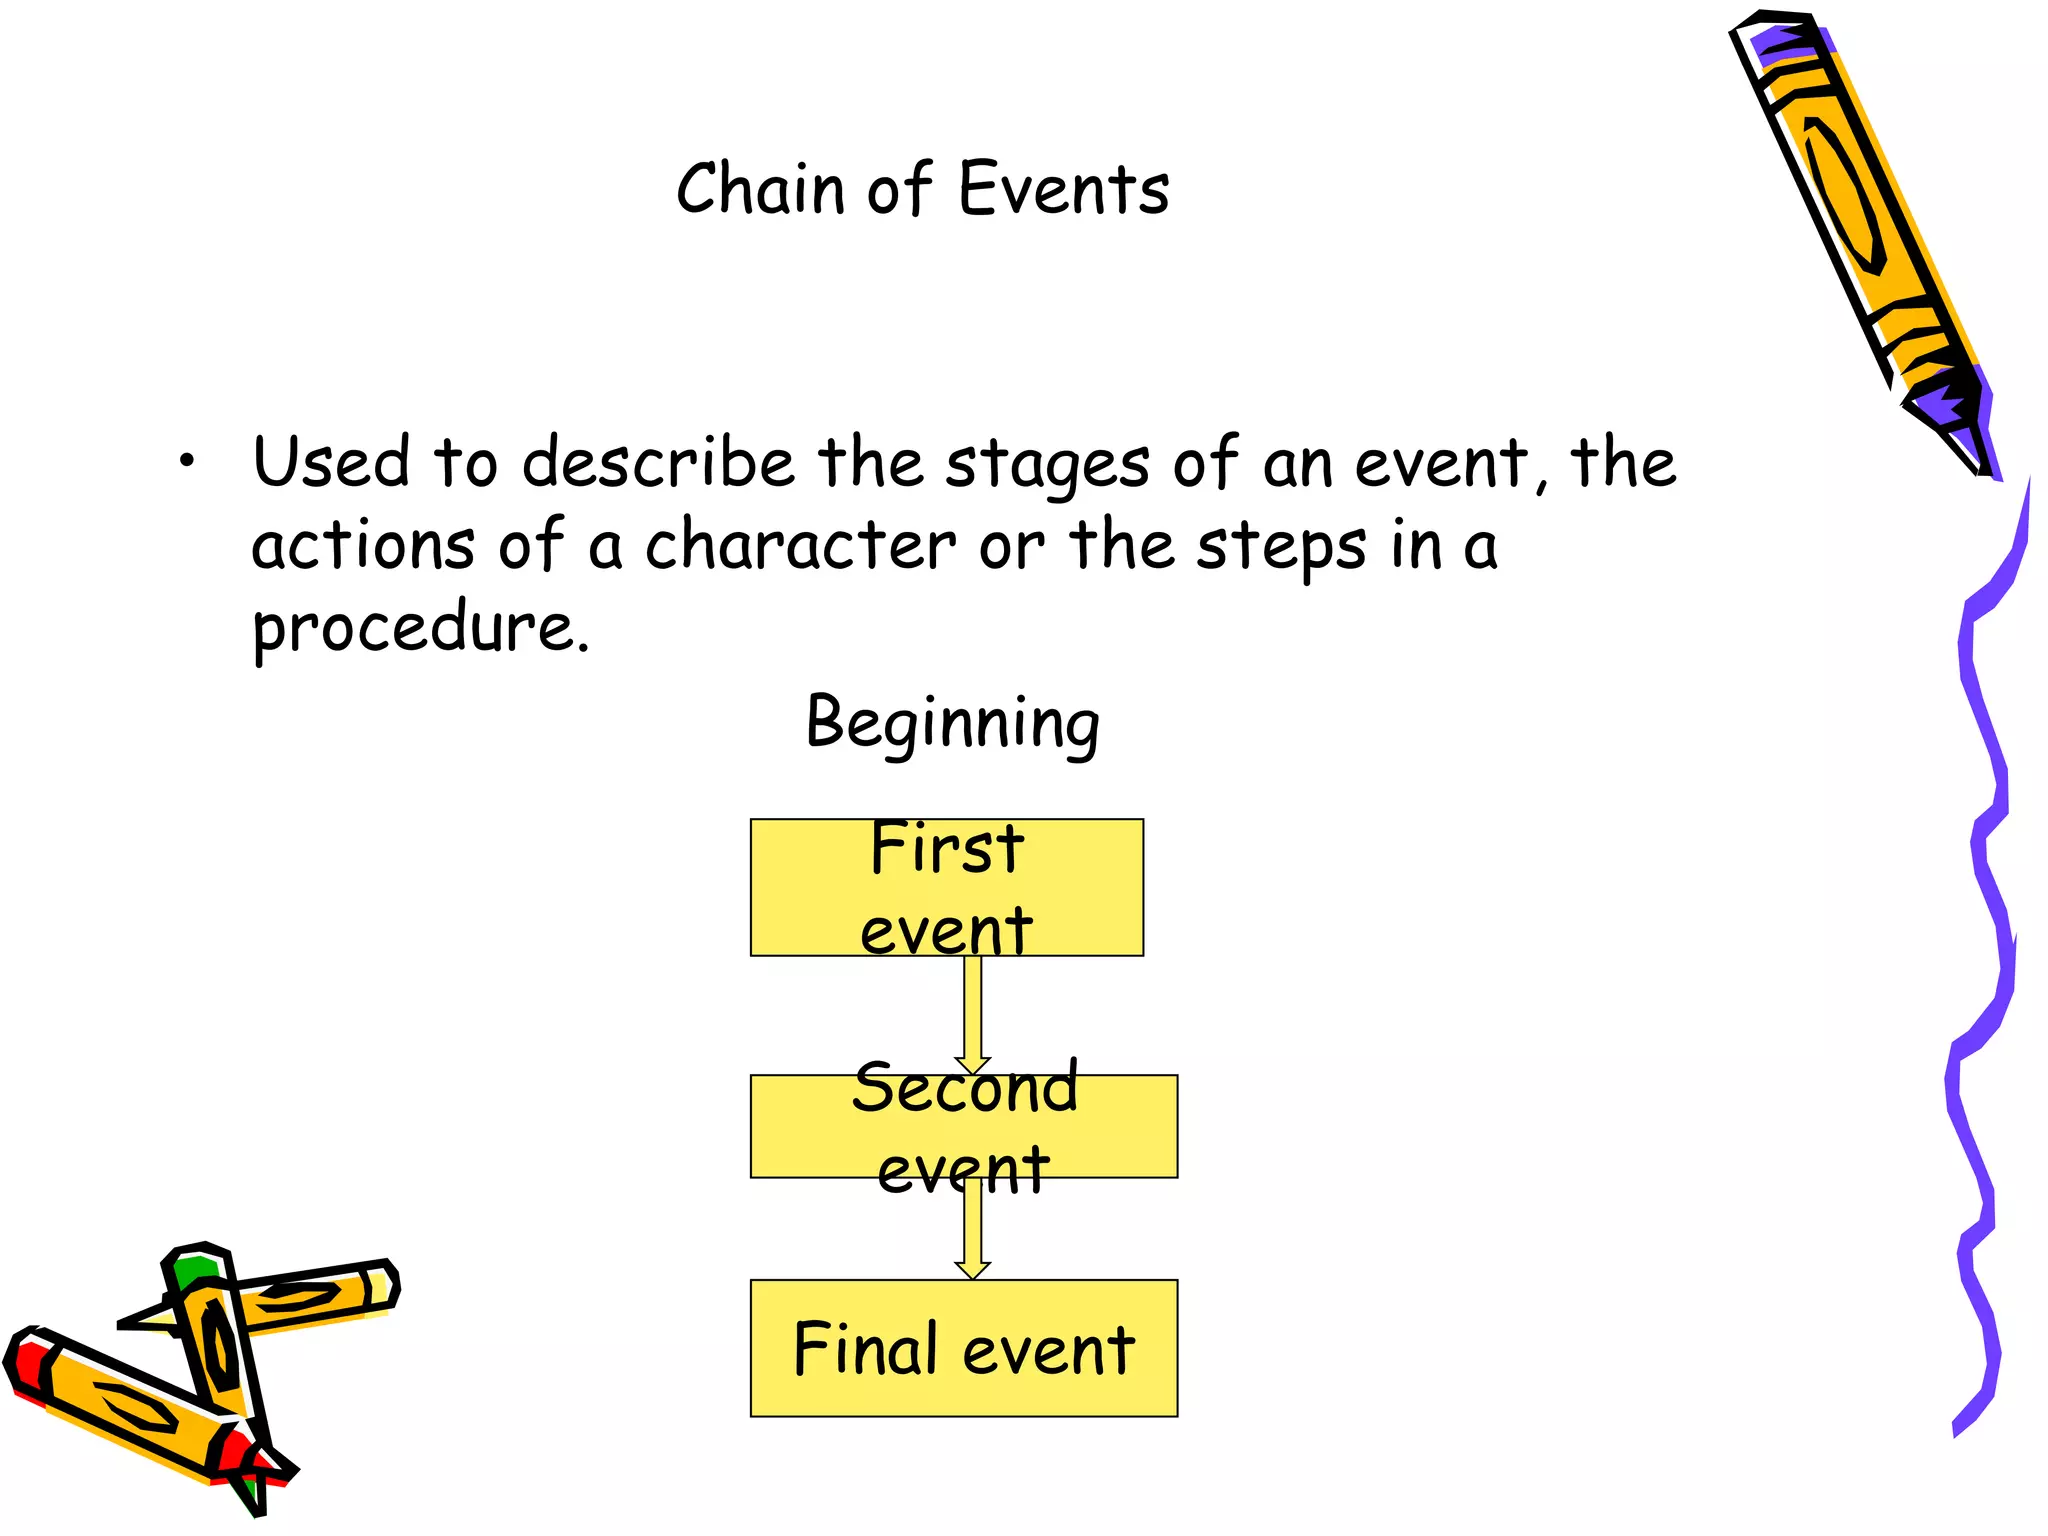
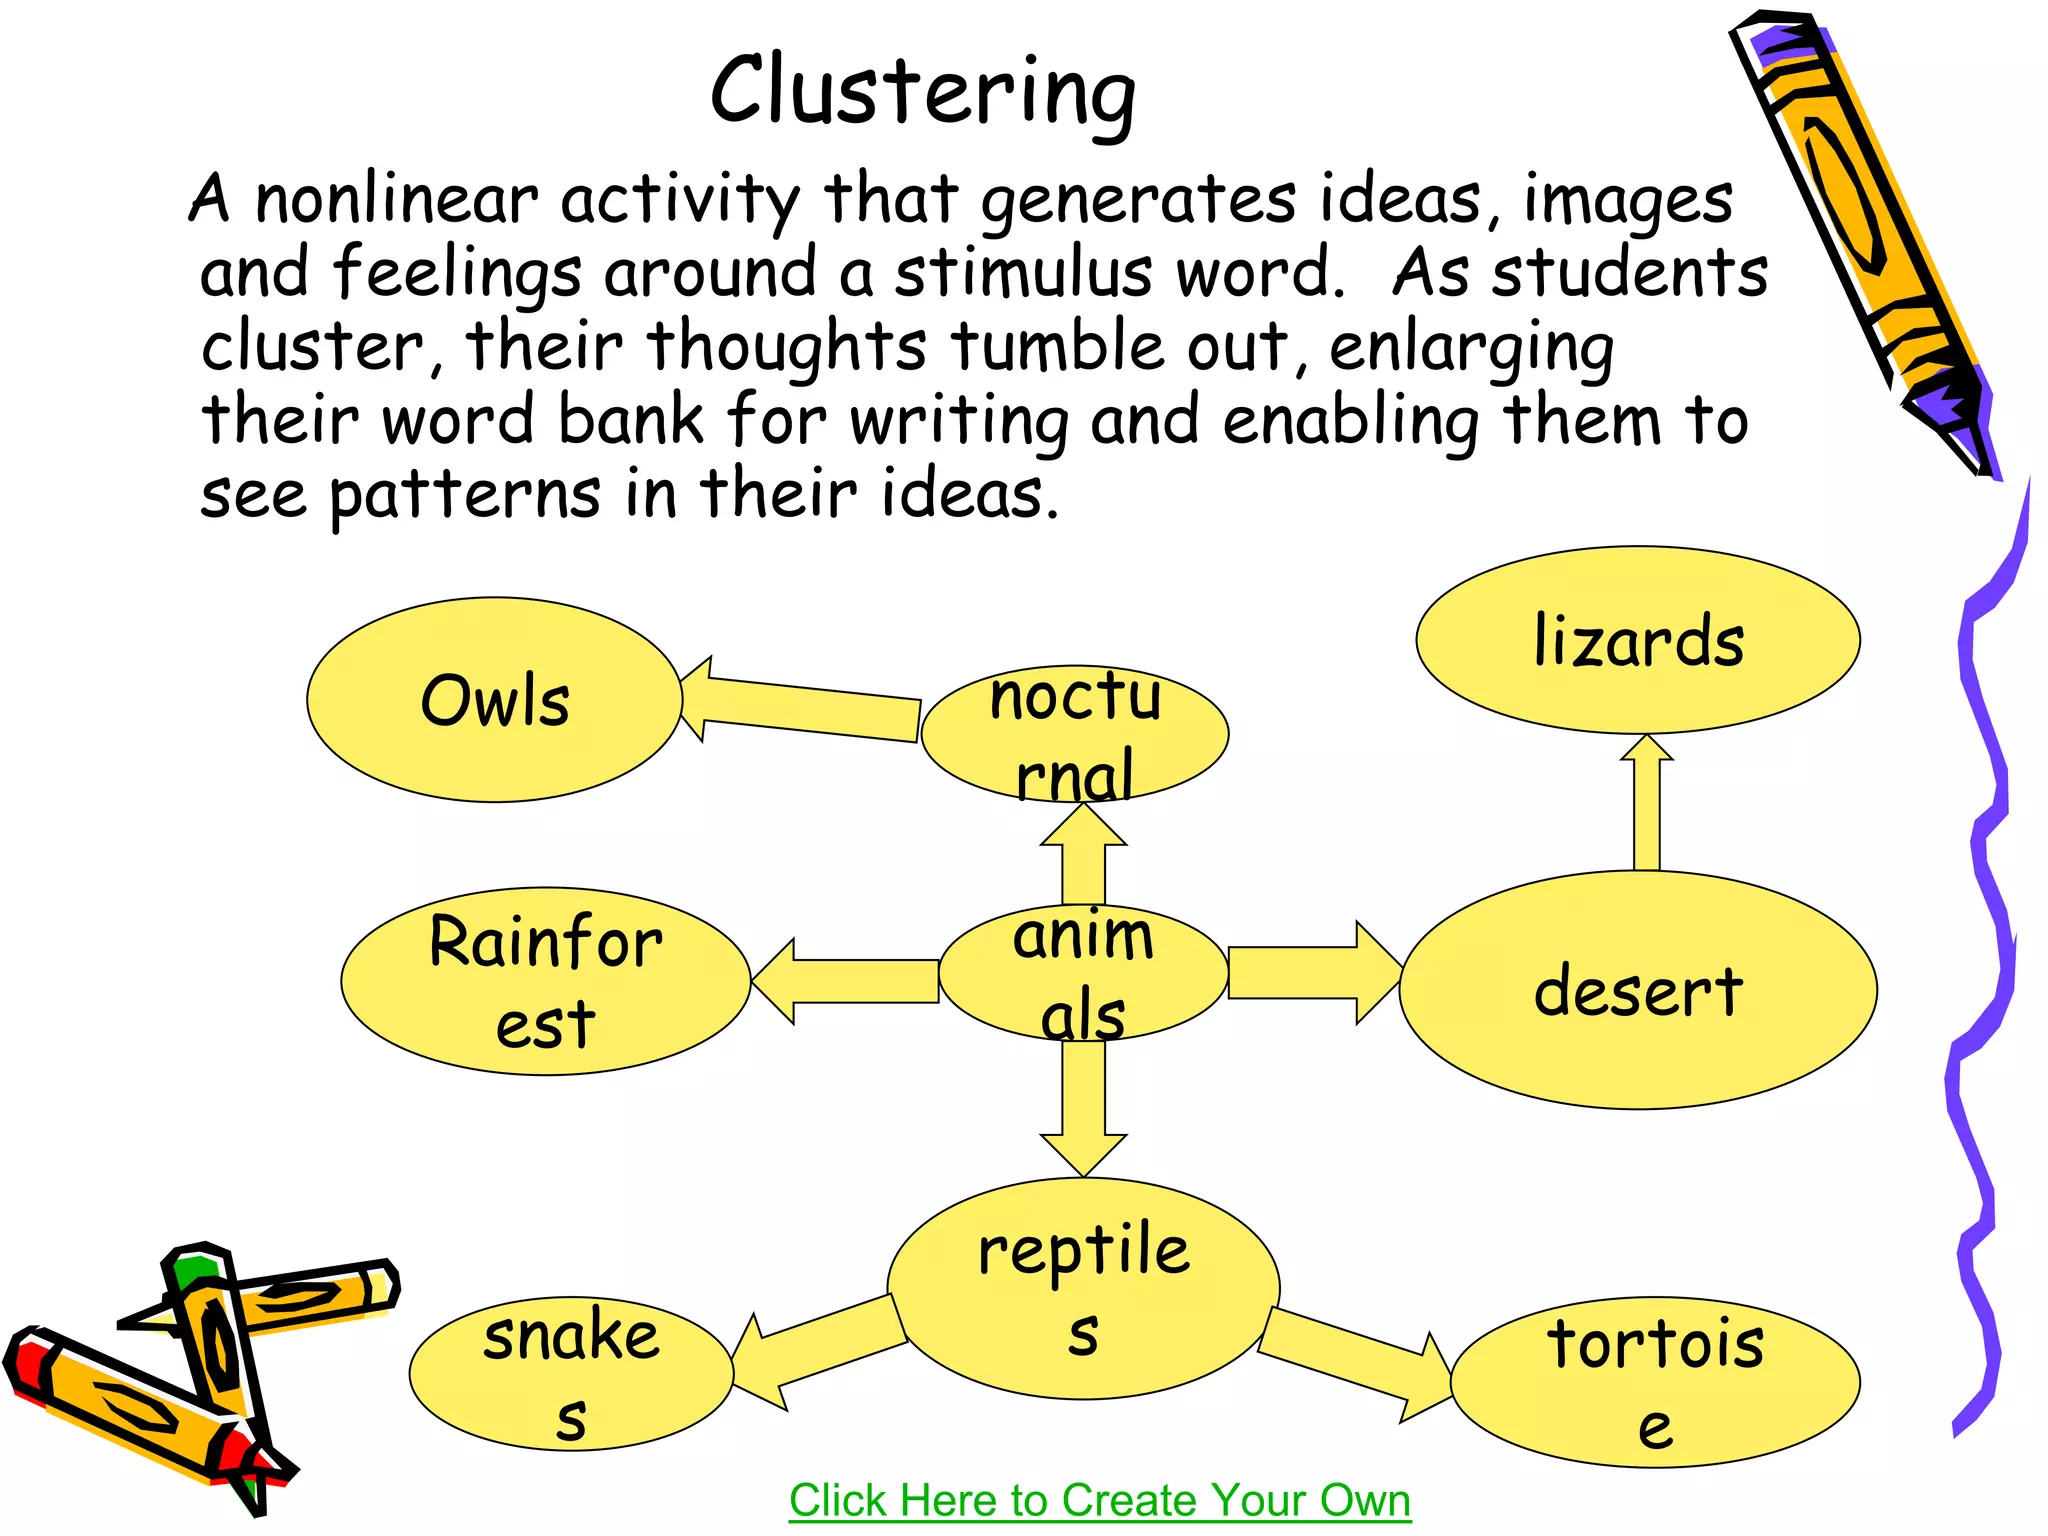
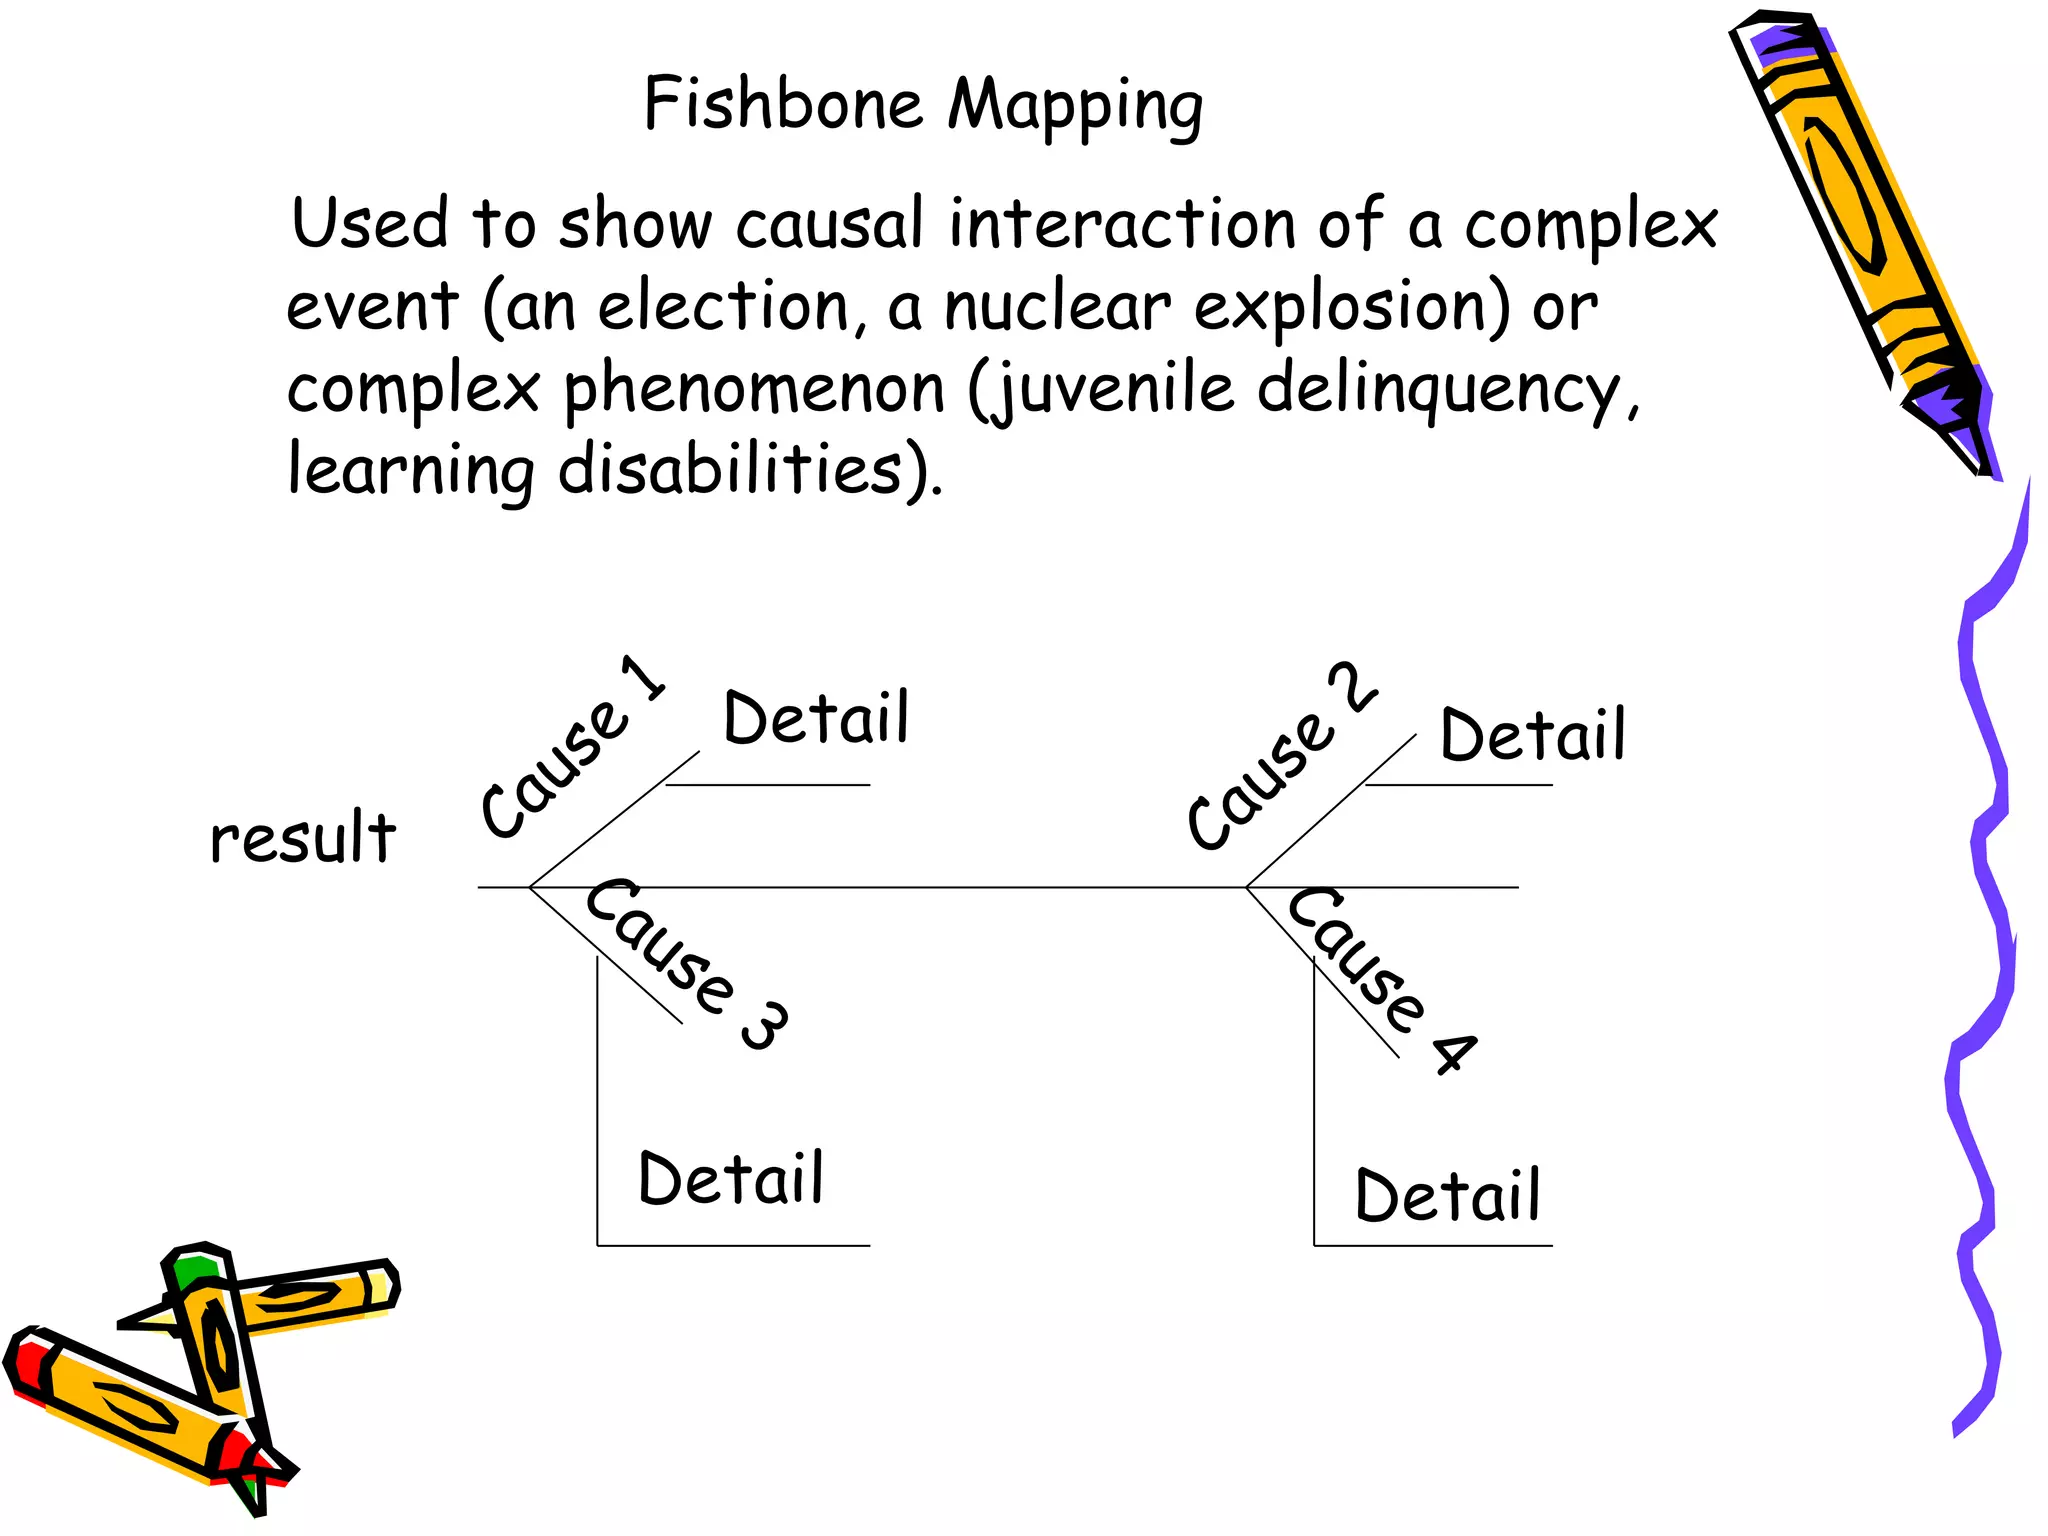
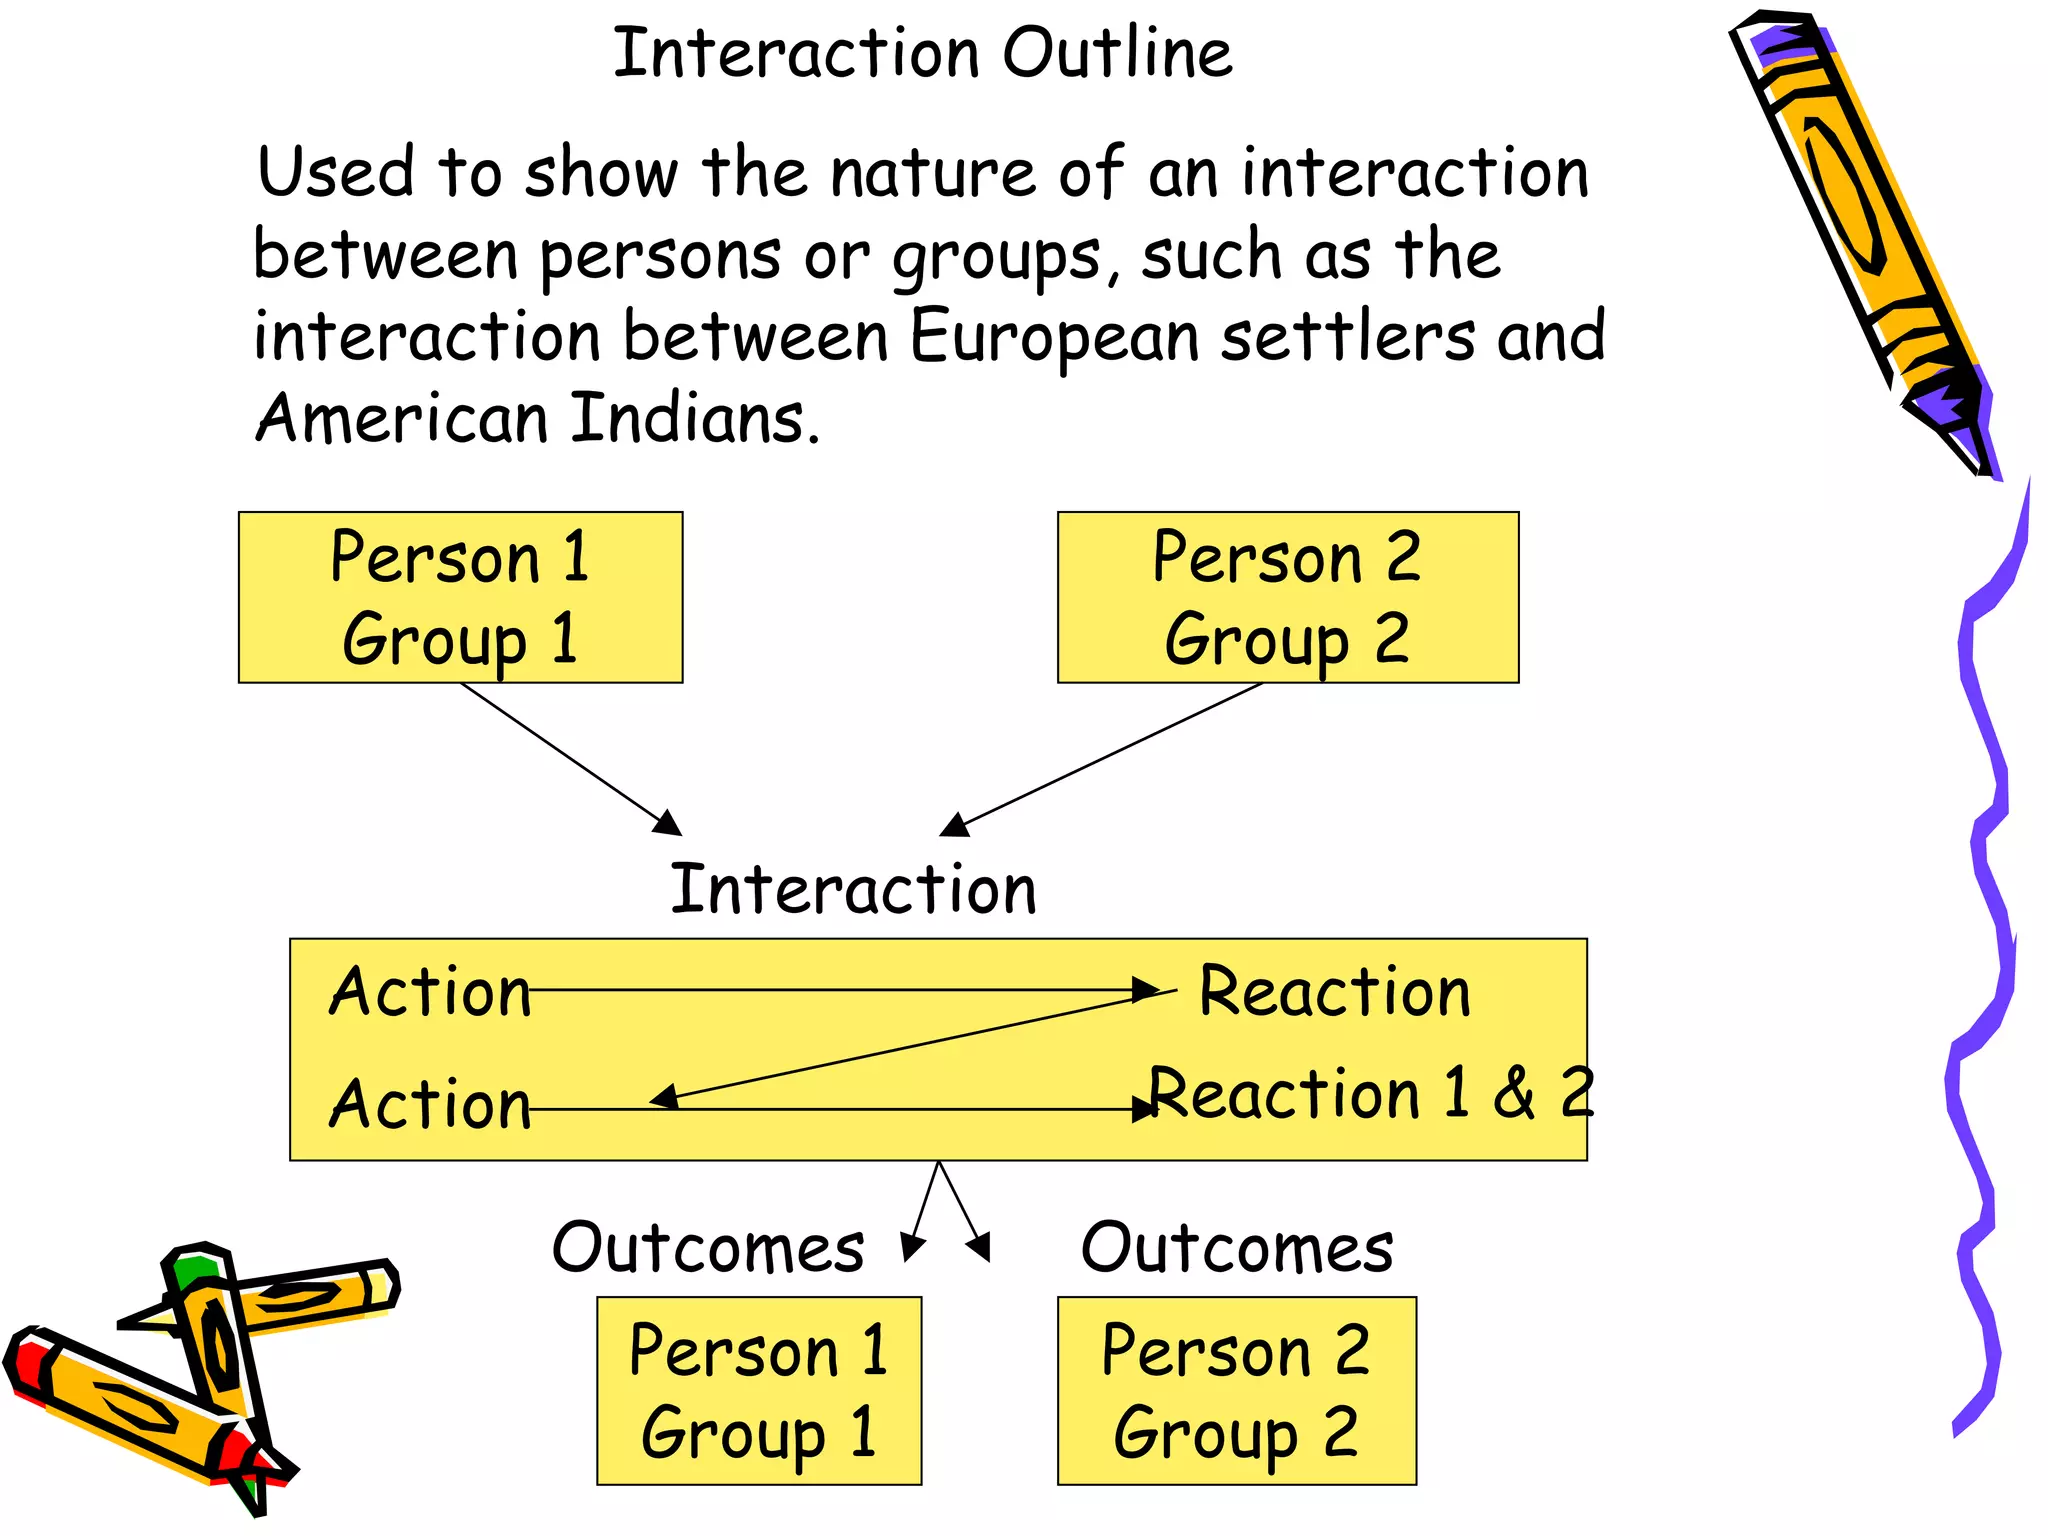
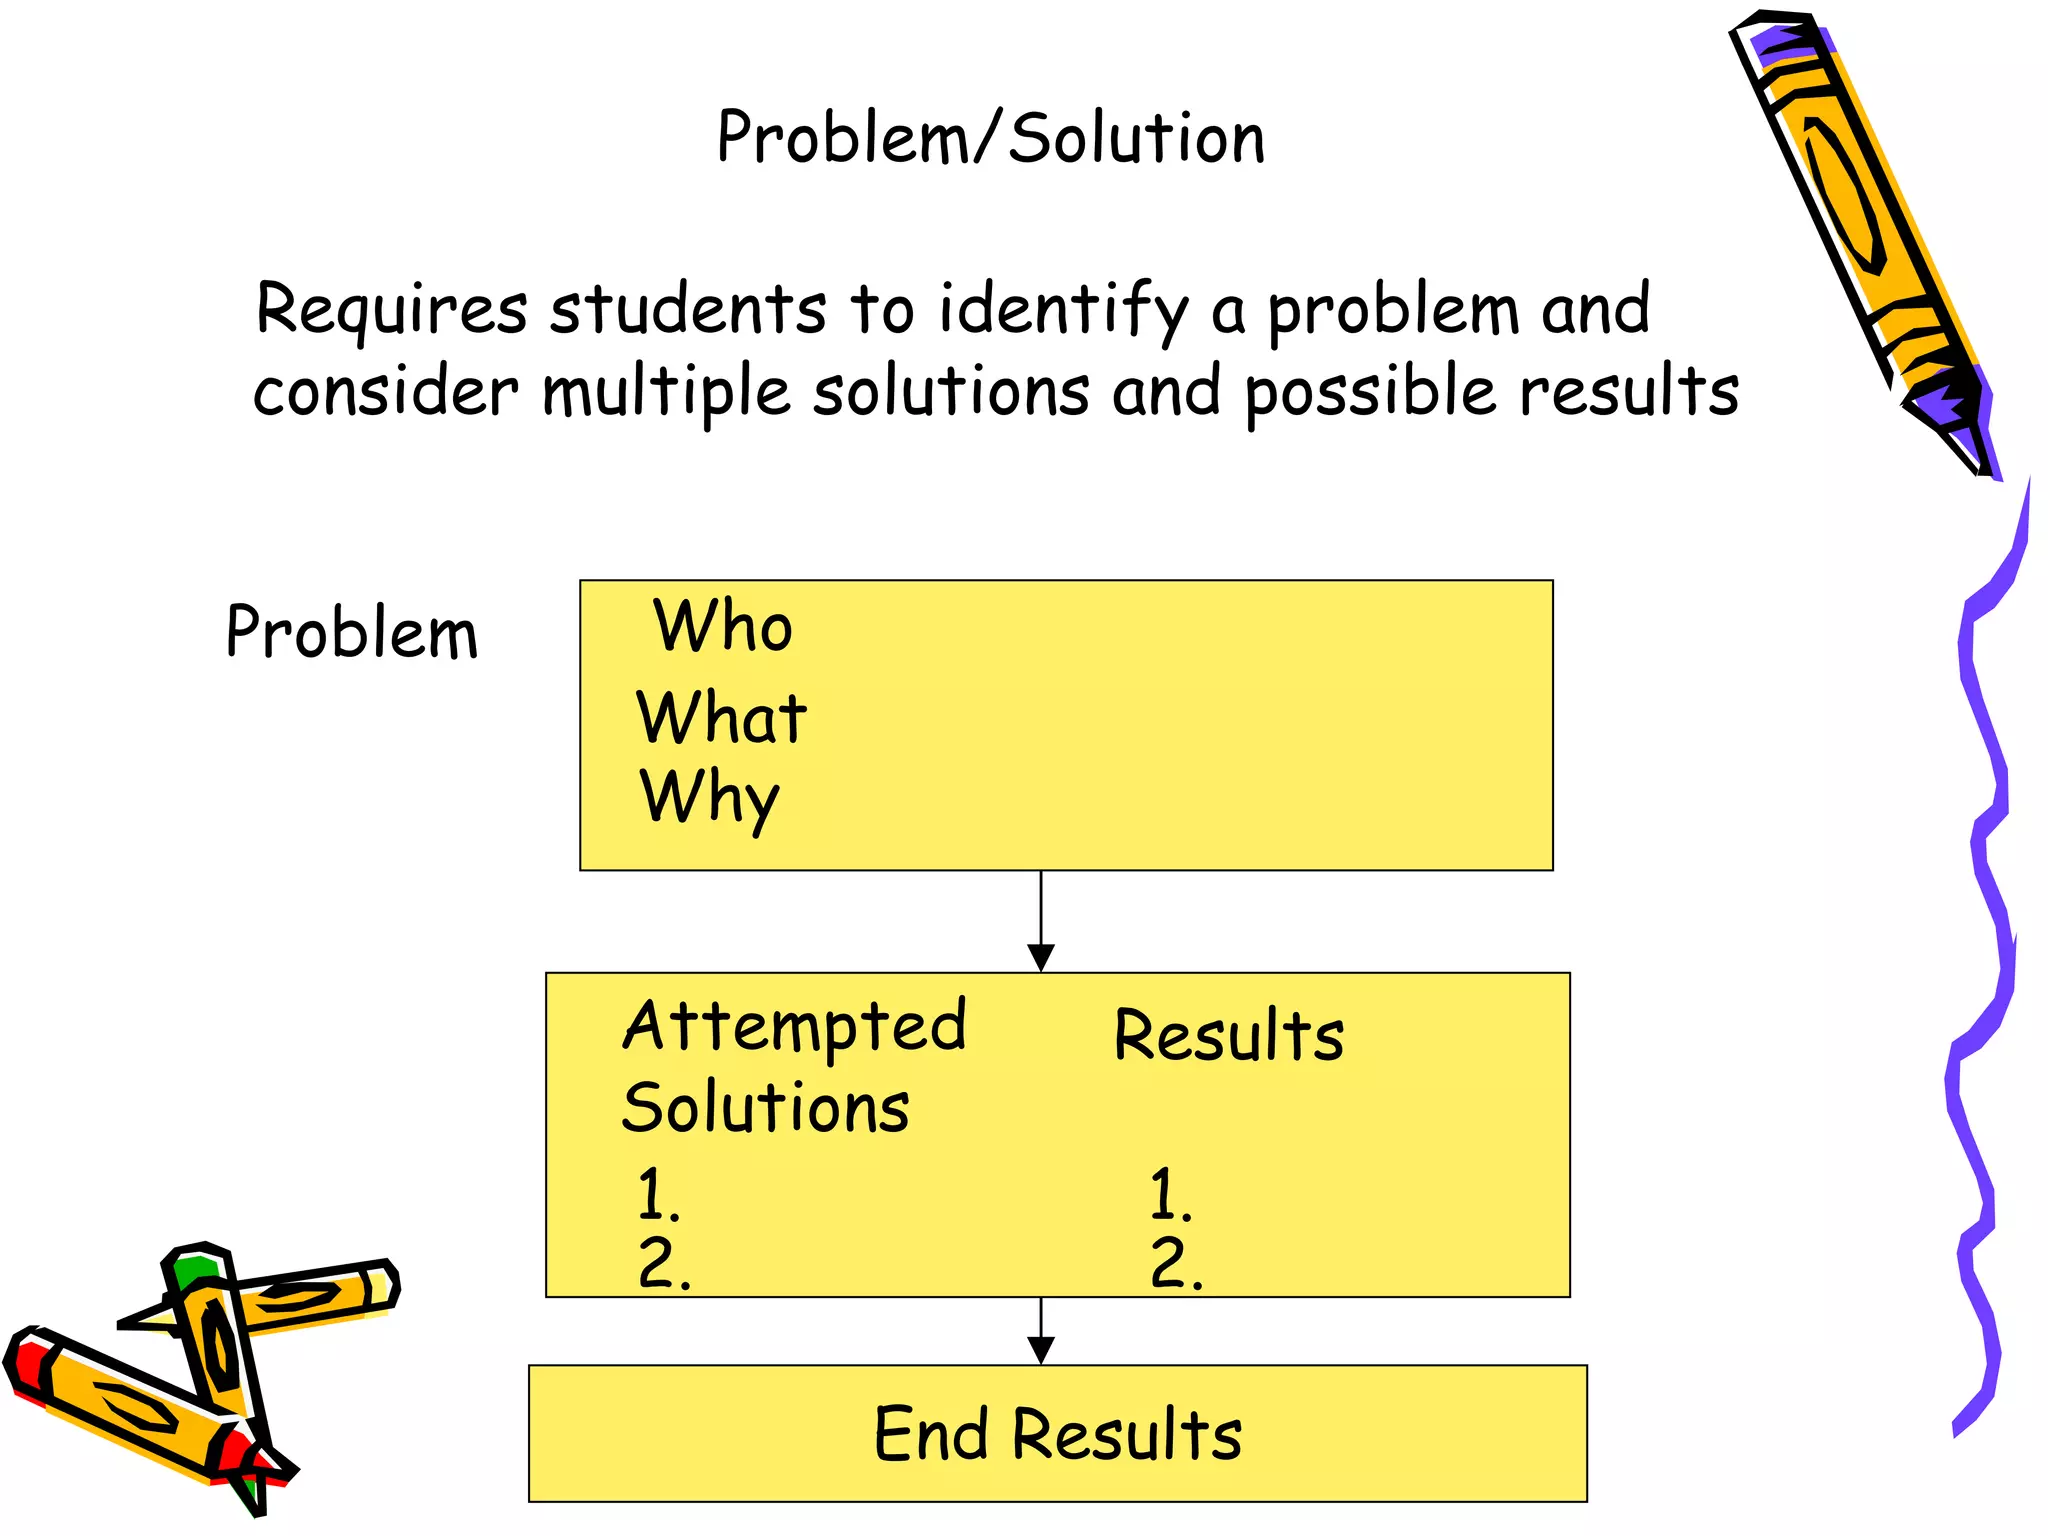
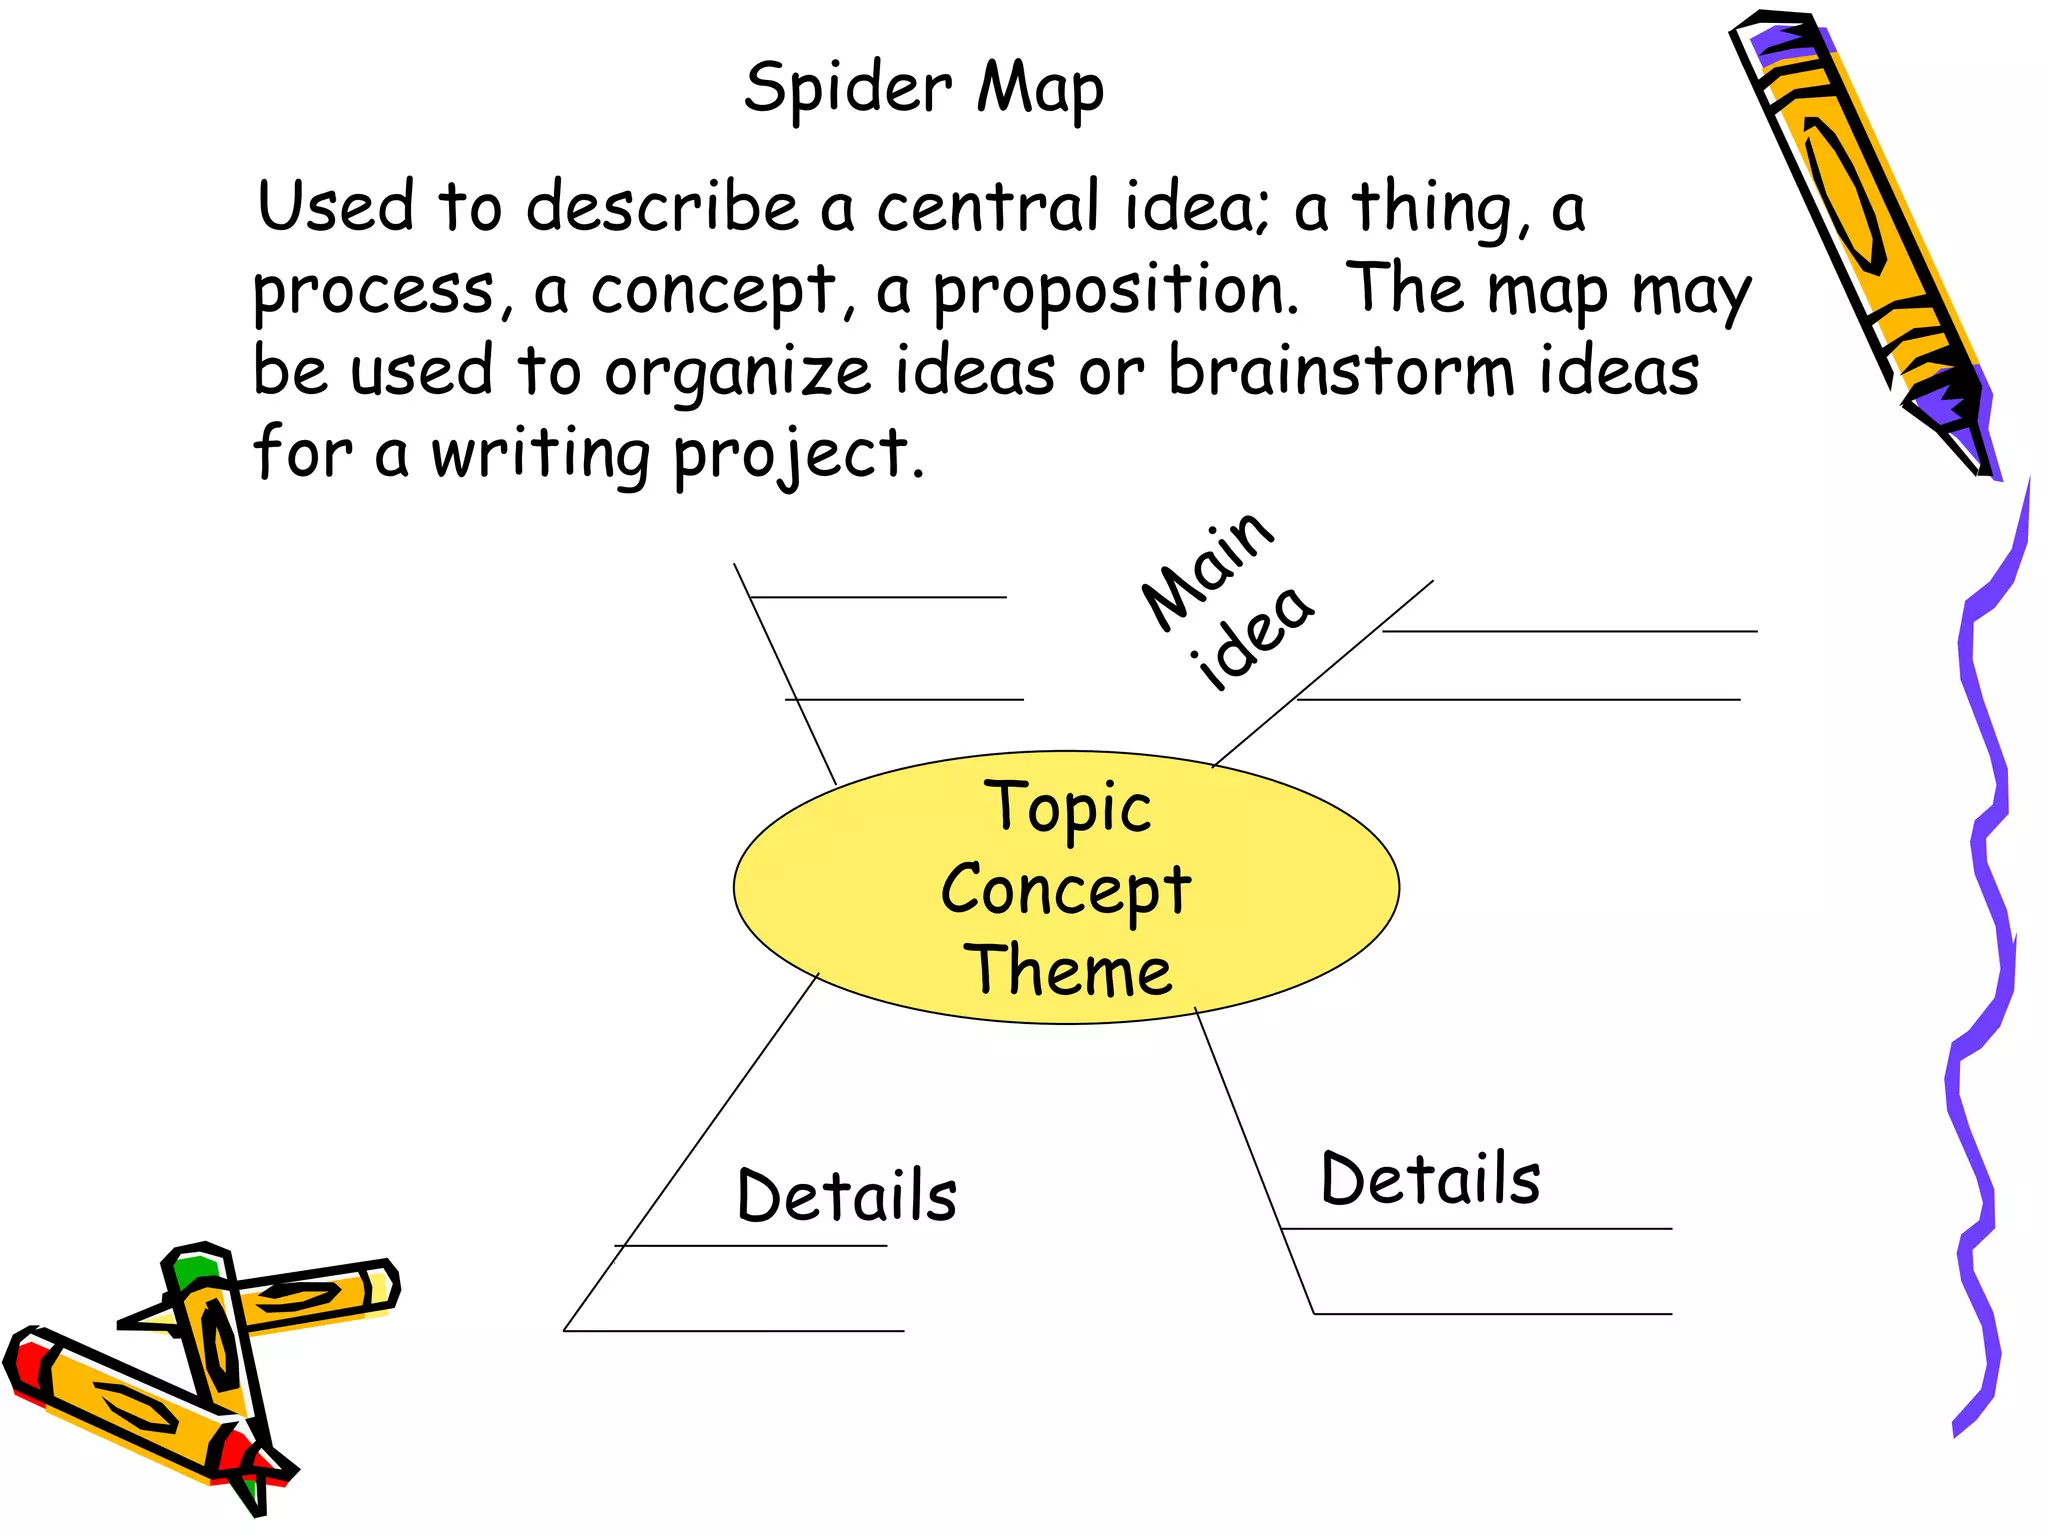
Concept Map
in Social Studies
What is a graphic
organizer?
• A powerful visual picture of
information that allows the mind to
see undiscovered patterns and
relationships.
• A tool that allows organization of
these patterns and relationships in
writing.
Steps to Make Graphic Organizer
1. What is the main topic?
•Put it in the centre or at the top
2. What are the Sub-topics (secondary topics)?
•Draw an arrow from main topic to sub-topic
3. Organize ideas or information through arrows
•Draw arrows to show relationships between
idea/information/topics
•Show cause and effect relationships through arrows too
Steps to Make Graphic Organizer
4. Show similarities and differences through Venn Diagrams
•Draw circles that merge to compare and contrast
5. Be Coherent
•Keep it organized
•Provide clear labels.
•Keep it simple! (DO NOT put in too much information)
6. Be Creative
•Use pictures or symbols
•Use any way to create a graphic model IF it is clear and simple
Types of Graphic Organizers
Venn
Diagram
Story
Board
Spider
Map
Problem/
Solution
Matrix
KWLH
Technique
Interaction
Outline
Fishbone
Mapping
Family
Tree
CycleContinuu
m
ClusteringChain of
Events
Chain of Events
• Used to describe the stages of an event, the
actions of a character or the steps in a
procedure.
Beginning
First
event
Second
event
Final event
Clustering
A nonlinear activity that generates ideas, images
and feelings around a stimulus word. As students
cluster, their thoughts tumble out, enlarging
their word bank for writing and enabling them to
see patterns in their ideas.
anim
als
noctu
rnal
desert
reptile
s
Rainfor
est
lizards
snake
s
tortois
e
Owls
Click Here to Create Your Own
Fishbone Mapping
Used to show causal interaction of a complex
event (an election, a nuclear explosion) or
complex phenomenon (juvenile delinquency,
learning disabilities).
result
Detail Detail
Detail Detail
Interaction Outline
Used to show the nature of an interaction
between persons or groups, such as the
interaction between European settlers and
American Indians.
Person 1
Group 1
Person 2
Group 2
Interaction
Action Reaction
Action Reaction 1 & 2
Person 1
Group 1
Person 2
Group 2
Outcomes Outcomes
Problem/Solution
Requires students to identify a problem and
consider multiple solutions and possible results
Who
What
Why
Problem
Attempted
Solutions
Results
1. 1.
2. 2.
End Results
Spider Map
Used to describe a central idea; a thing, a
process, a concept, a proposition. The map may
be used to organize ideas or brainstorm ideas
for a writing project.
Topic
Concept
Theme
DetailsDetails

Concept Map

  • 1.
  • 2.
    What is agraphic organizer? • A powerful visual picture of information that allows the mind to see undiscovered patterns and relationships. • A tool that allows organization of these patterns and relationships in writing.
  • 3.
    Steps to MakeGraphic Organizer 1. What is the main topic? •Put it in the centre or at the top 2. What are the Sub-topics (secondary topics)? •Draw an arrow from main topic to sub-topic 3. Organize ideas or information through arrows •Draw arrows to show relationships between idea/information/topics •Show cause and effect relationships through arrows too
  • 4.
    Steps to MakeGraphic Organizer 4. Show similarities and differences through Venn Diagrams •Draw circles that merge to compare and contrast 5. Be Coherent •Keep it organized •Provide clear labels. •Keep it simple! (DO NOT put in too much information) 6. Be Creative •Use pictures or symbols •Use any way to create a graphic model IF it is clear and simple
  • 5.
    Types of GraphicOrganizers Venn Diagram Story Board Spider Map Problem/ Solution Matrix KWLH Technique Interaction Outline Fishbone Mapping Family Tree CycleContinuu m ClusteringChain of Events
  • 6.
    Chain of Events •Used to describe the stages of an event, the actions of a character or the steps in a procedure. Beginning First event Second event Final event
  • 7.
    Clustering A nonlinear activitythat generates ideas, images and feelings around a stimulus word. As students cluster, their thoughts tumble out, enlarging their word bank for writing and enabling them to see patterns in their ideas. anim als noctu rnal desert reptile s Rainfor est lizards snake s tortois e Owls Click Here to Create Your Own
  • 8.
    Fishbone Mapping Used toshow causal interaction of a complex event (an election, a nuclear explosion) or complex phenomenon (juvenile delinquency, learning disabilities). result Detail Detail Detail Detail
  • 9.
    Interaction Outline Used toshow the nature of an interaction between persons or groups, such as the interaction between European settlers and American Indians. Person 1 Group 1 Person 2 Group 2 Interaction Action Reaction Action Reaction 1 & 2 Person 1 Group 1 Person 2 Group 2 Outcomes Outcomes
  • 10.
    Problem/Solution Requires students toidentify a problem and consider multiple solutions and possible results Who What Why Problem Attempted Solutions Results 1. 1. 2. 2. End Results
  • 11.
    Spider Map Used todescribe a central idea; a thing, a process, a concept, a proposition. The map may be used to organize ideas or brainstorm ideas for a writing project. Topic Concept Theme DetailsDetails