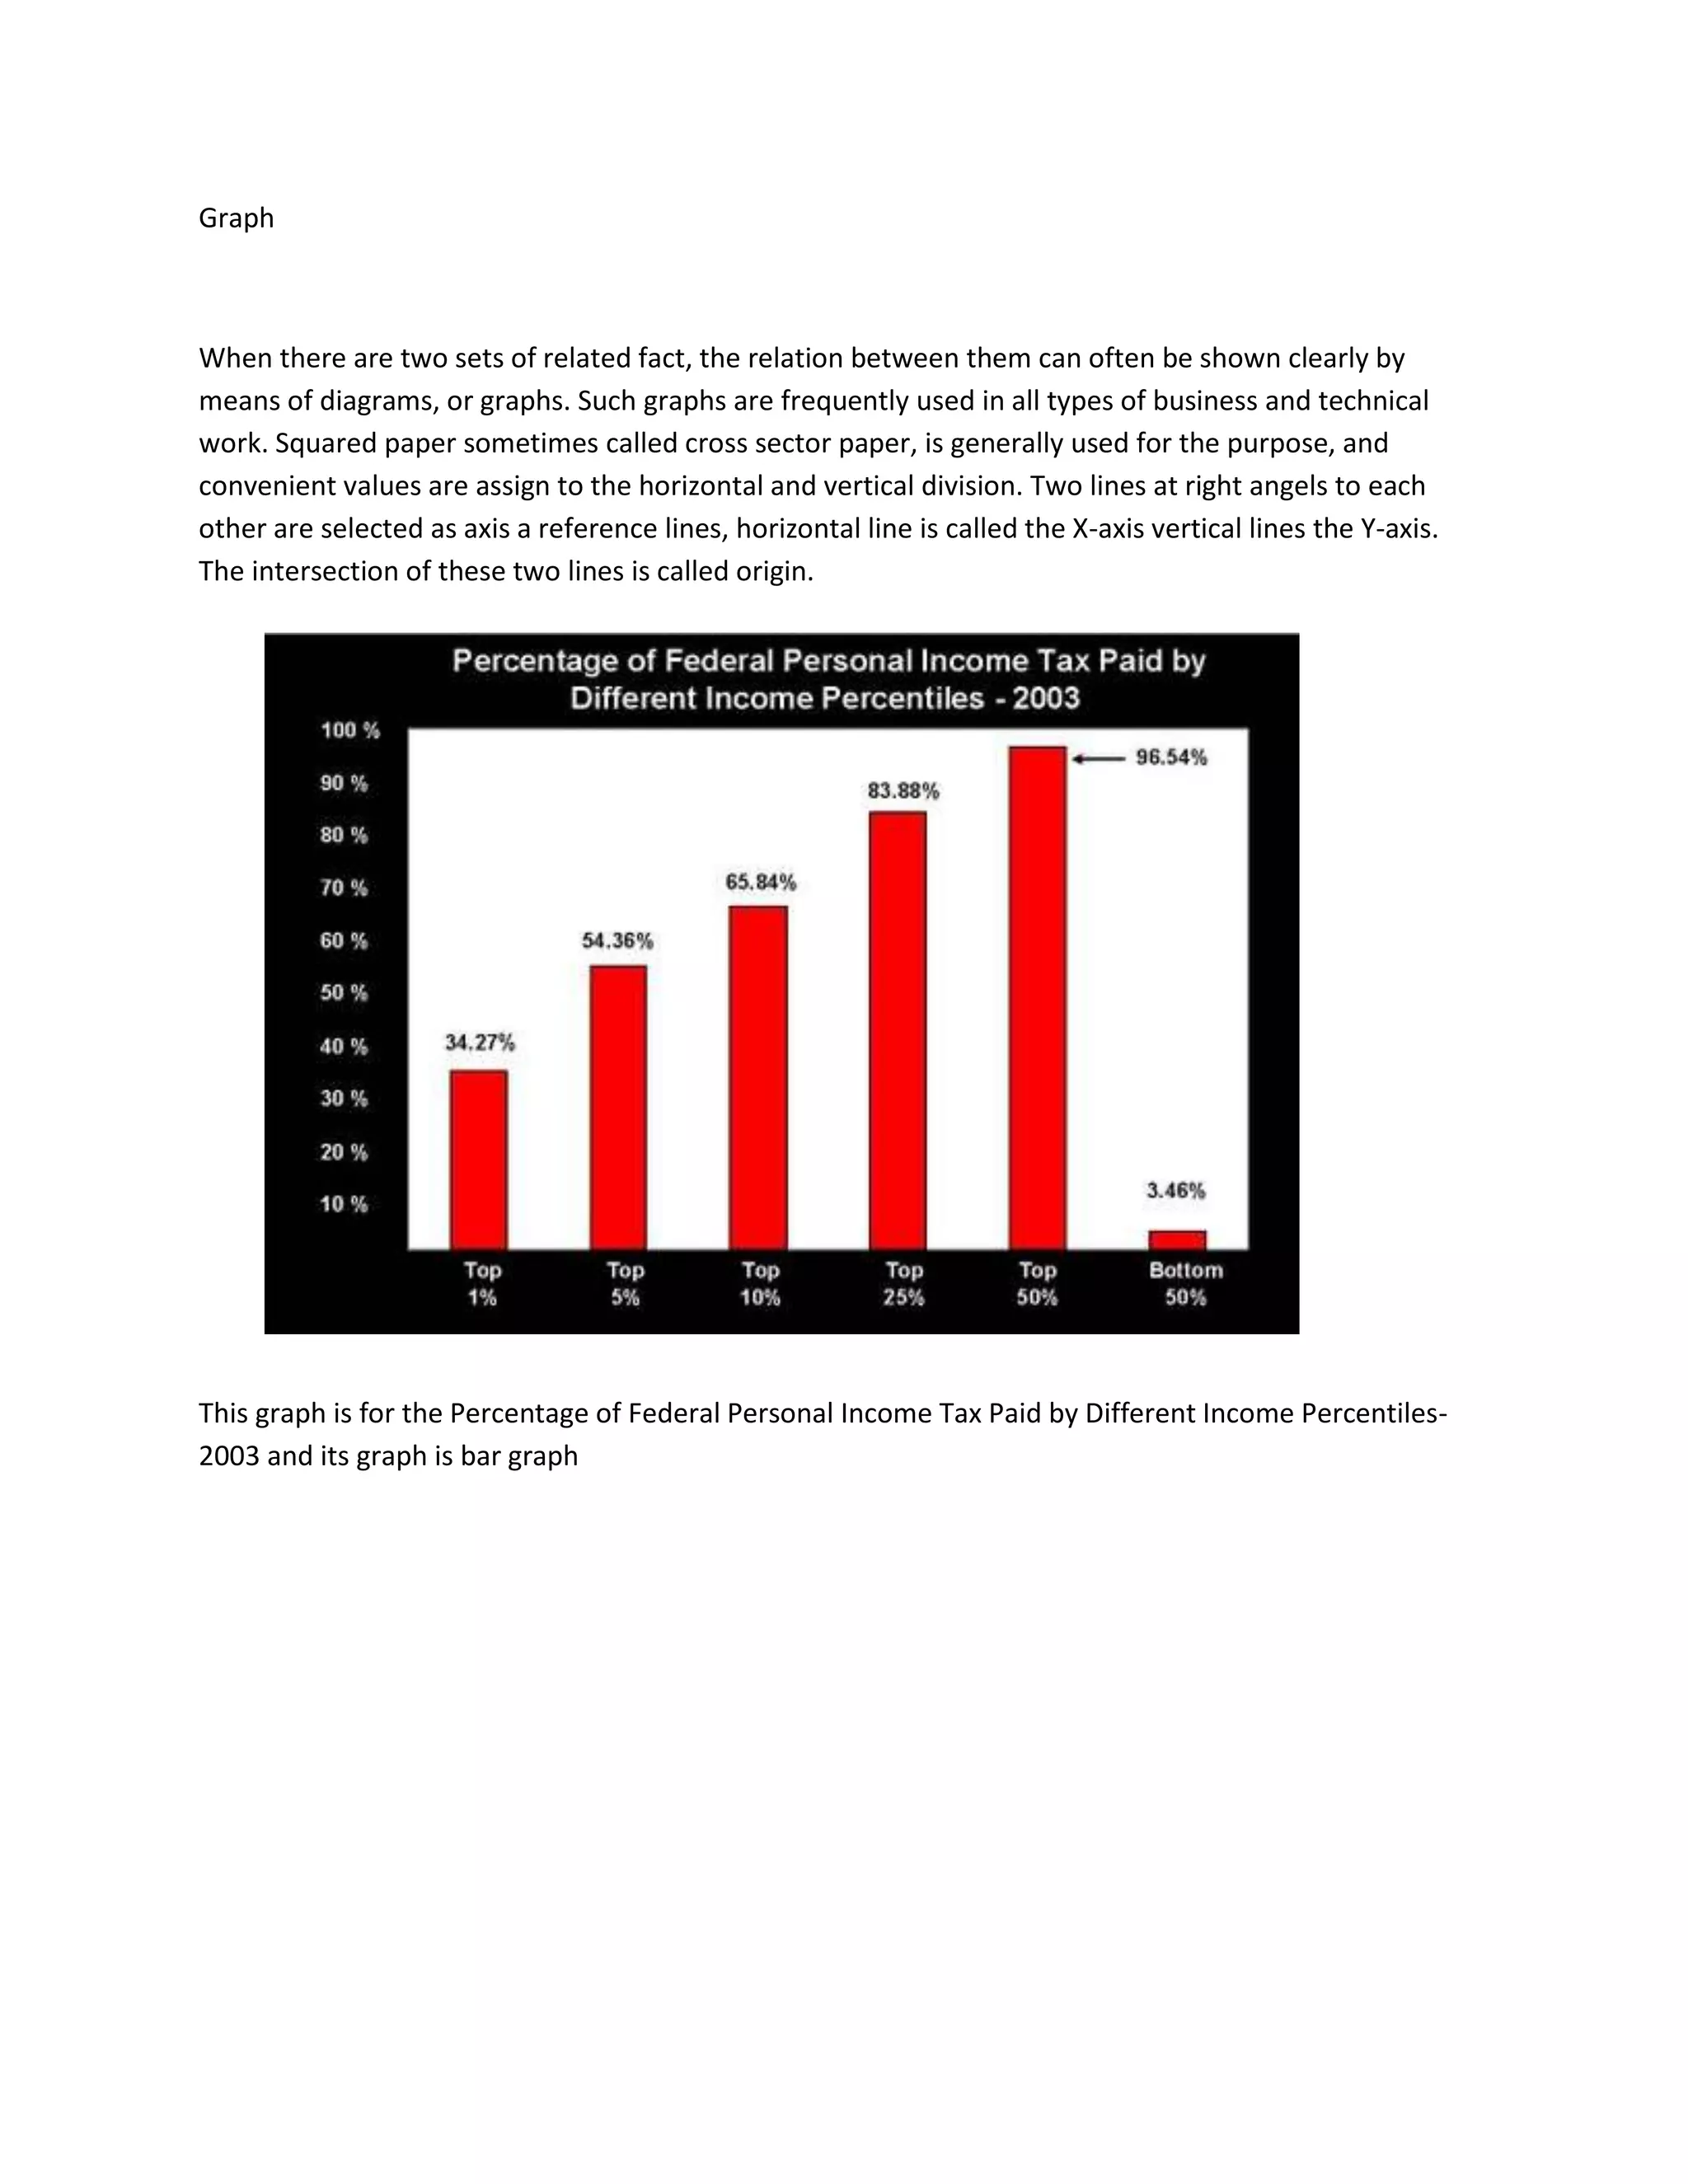
SlideShare a Scribd company logo
Graph <br />3048001353820When there are two sets of related fact, the relation between them can often be shown clearly by means of diagrams, or graphs. Such graphs are frequently used in all types of business and technical work. Squared paper sometimes called cross sector paper, is generally used for the purpose, and convenient values are assign to the horizontal and vertical division. Two lines at right angels to each other are selected as axis a reference lines, horizontal line is called the X-axis vertical lines the Y-axis. The intersection of these two lines is called origin.       <br />This graph is for the Percentage of Federal Personal Income Tax Paid by Different Income Percentiles-2003 and its graph is bar graph  <br />
Graph

More Related Content

What's hot

Charts And Graphs
Charts And GraphsCharts And Graphs
Charts And Graphs
Himadri Shekhar
 
Using lograrithmic graph paper
Using lograrithmic graph paperUsing lograrithmic graph paper
Using lograrithmic graph paper
martyynyyte
 
Types of graphs and charts and their uses with examples and pics
Types of graphs and charts and their uses  with examples and picsTypes of graphs and charts and their uses  with examples and pics
Types of graphs and charts and their uses with examples and pics
Makati Science High School
 
Graph ppt
Graph pptGraph ppt
Graph ppt
Ravi Ramchandani
 
Statistics
StatisticsStatistics
Statisticsdiereck
 
Types Of Charts
Types Of ChartsTypes Of Charts
Types Of Chartswmassie
 
Interpret data for use in charts and graphs
Interpret data for use in charts and graphsInterpret data for use in charts and graphs
Interpret data for use in charts and graphsCharles Flynt
 
Types of Charts
Types of ChartsTypes of Charts
Types of Charts
Loyd Calangan
 
Line graphs, slope, and interpreting line graphs
Line graphs, slope, and interpreting line graphs Line graphs, slope, and interpreting line graphs
Line graphs, slope, and interpreting line graphs
Charalee
 
Presenting information presentation.
Presenting information presentation.Presenting information presentation.
Presenting information presentation.danielle93
 
Charts in excel
Charts in excelCharts in excel
Charts in excel
Jithin Krishnan
 
Introduction to graph
Introduction to graphIntroduction to graph
Introduction to graphRoyB
 
Graphexamples how-to-do
Graphexamples how-to-doGraphexamples how-to-do
Graphexamples how-to-doMelody Teoxon
 
Understanding on graph in bpo
Understanding on graph in bpoUnderstanding on graph in bpo
Understanding on graph in bpo
Ajit Kumar
 
Writing Figures, grap
Writing Figures, grapWriting Figures, grap
Writing Figures, grapjuvinmiscala
 

What's hot (19)

Charts And Graphs
Charts And GraphsCharts And Graphs
Charts And Graphs
 
Using lograrithmic graph paper
Using lograrithmic graph paperUsing lograrithmic graph paper
Using lograrithmic graph paper
 
Types of graphs and charts and their uses with examples and pics
Types of graphs and charts and their uses  with examples and picsTypes of graphs and charts and their uses  with examples and pics
Types of graphs and charts and their uses with examples and pics
 
Graph ppt
Graph pptGraph ppt
Graph ppt
 
Statistics
StatisticsStatistics
Statistics
 
Graphs in science
Graphs in scienceGraphs in science
Graphs in science
 
Types Of Charts
Types Of ChartsTypes Of Charts
Types Of Charts
 
Interpret data for use in charts and graphs
Interpret data for use in charts and graphsInterpret data for use in charts and graphs
Interpret data for use in charts and graphs
 
Ways of presenting information
Ways of presenting informationWays of presenting information
Ways of presenting information
 
Types of Charts
Types of ChartsTypes of Charts
Types of Charts
 
Line graphs, slope, and interpreting line graphs
Line graphs, slope, and interpreting line graphs Line graphs, slope, and interpreting line graphs
Line graphs, slope, and interpreting line graphs
 
Presenting information presentation.
Presenting information presentation.Presenting information presentation.
Presenting information presentation.
 
Charts in excel
Charts in excelCharts in excel
Charts in excel
 
Spreadsheets 2
Spreadsheets 2Spreadsheets 2
Spreadsheets 2
 
TYPES ON CHARTS
TYPES ON CHARTS TYPES ON CHARTS
TYPES ON CHARTS
 
Introduction to graph
Introduction to graphIntroduction to graph
Introduction to graph
 
Graphexamples how-to-do
Graphexamples how-to-doGraphexamples how-to-do
Graphexamples how-to-do
 
Understanding on graph in bpo
Understanding on graph in bpoUnderstanding on graph in bpo
Understanding on graph in bpo
 
Writing Figures, grap
Writing Figures, grapWriting Figures, grap
Writing Figures, grap
 

Viewers also liked

Wie is CoachSander en CT2
Wie is CoachSander en CT2Wie is CoachSander en CT2
Wie is CoachSander en CT2
CoachSander (Vrugt van Keulen)
 
Bim bij Berkvens Deursystemen 2015
Bim bij Berkvens Deursystemen 2015Bim bij Berkvens Deursystemen 2015
Bim bij Berkvens Deursystemen 2015
Berkvens Deursystemen
 
Pitch 2 ehv vitale stad 6 november
Pitch 2 ehv vitale stad 6 novemberPitch 2 ehv vitale stad 6 november
Pitch 2 ehv vitale stad 6 november
Boris de Jong
 
Zizi
ZiziZizi
Zizi
zehrija
 
5 de leerinhouden van het leren lezen 130410
5 de leerinhouden van het leren lezen 1304105 de leerinhouden van het leren lezen 130410
5 de leerinhouden van het leren lezen 130410
Lexima
 
Sociale media voor wak en efgoeddag
Sociale media voor wak en efgoeddagSociale media voor wak en efgoeddag
Sociale media voor wak en efgoeddagHannes D'Hulster
 

Viewers also liked (8)

Wie is CoachSander en CT2
Wie is CoachSander en CT2Wie is CoachSander en CT2
Wie is CoachSander en CT2
 
The heart worksheet
The heart worksheetThe heart worksheet
The heart worksheet
 
Bim bij Berkvens Deursystemen 2015
Bim bij Berkvens Deursystemen 2015Bim bij Berkvens Deursystemen 2015
Bim bij Berkvens Deursystemen 2015
 
Pitch 2 ehv vitale stad 6 november
Pitch 2 ehv vitale stad 6 novemberPitch 2 ehv vitale stad 6 november
Pitch 2 ehv vitale stad 6 november
 
Zizi
ZiziZizi
Zizi
 
Tomo 6.2
Tomo 6.2Tomo 6.2
Tomo 6.2
 
5 de leerinhouden van het leren lezen 130410
5 de leerinhouden van het leren lezen 1304105 de leerinhouden van het leren lezen 130410
5 de leerinhouden van het leren lezen 130410
 
Sociale media voor wak en efgoeddag
Sociale media voor wak en efgoeddagSociale media voor wak en efgoeddag
Sociale media voor wak en efgoeddag
 

More from maricrisracho

Resumeracho 091027014720-phpapp01
Resumeracho 091027014720-phpapp01Resumeracho 091027014720-phpapp01
Resumeracho 091027014720-phpapp01maricrisracho
 
Haiku operating system
Haiku operating systemHaiku operating system
Haiku operating systemmaricrisracho
 

More from maricrisracho (9)

Maricris resume
Maricris resumeMaricris resume
Maricris resume
 
Maricris resume
Maricris resumeMaricris resume
Maricris resume
 
Maricris resume
Maricris resumeMaricris resume
Maricris resume
 
Maricris
MaricrisMaricris
Maricris
 
Resumeracho 091027014720-phpapp01
Resumeracho 091027014720-phpapp01Resumeracho 091027014720-phpapp01
Resumeracho 091027014720-phpapp01
 
Graph
GraphGraph
Graph
 
Graph
GraphGraph
Graph
 
Me and my friend
Me and my friendMe and my friend
Me and my friend
 
Haiku operating system
Haiku operating systemHaiku operating system
Haiku operating system
 

Graph

  • 1. Graph <br />3048001353820When there are two sets of related fact, the relation between them can often be shown clearly by means of diagrams, or graphs. Such graphs are frequently used in all types of business and technical work. Squared paper sometimes called cross sector paper, is generally used for the purpose, and convenient values are assign to the horizontal and vertical division. Two lines at right angels to each other are selected as axis a reference lines, horizontal line is called the X-axis vertical lines the Y-axis. The intersection of these two lines is called origin. <br />This graph is for the Percentage of Federal Personal Income Tax Paid by Different Income Percentiles-2003 and its graph is bar graph <br />