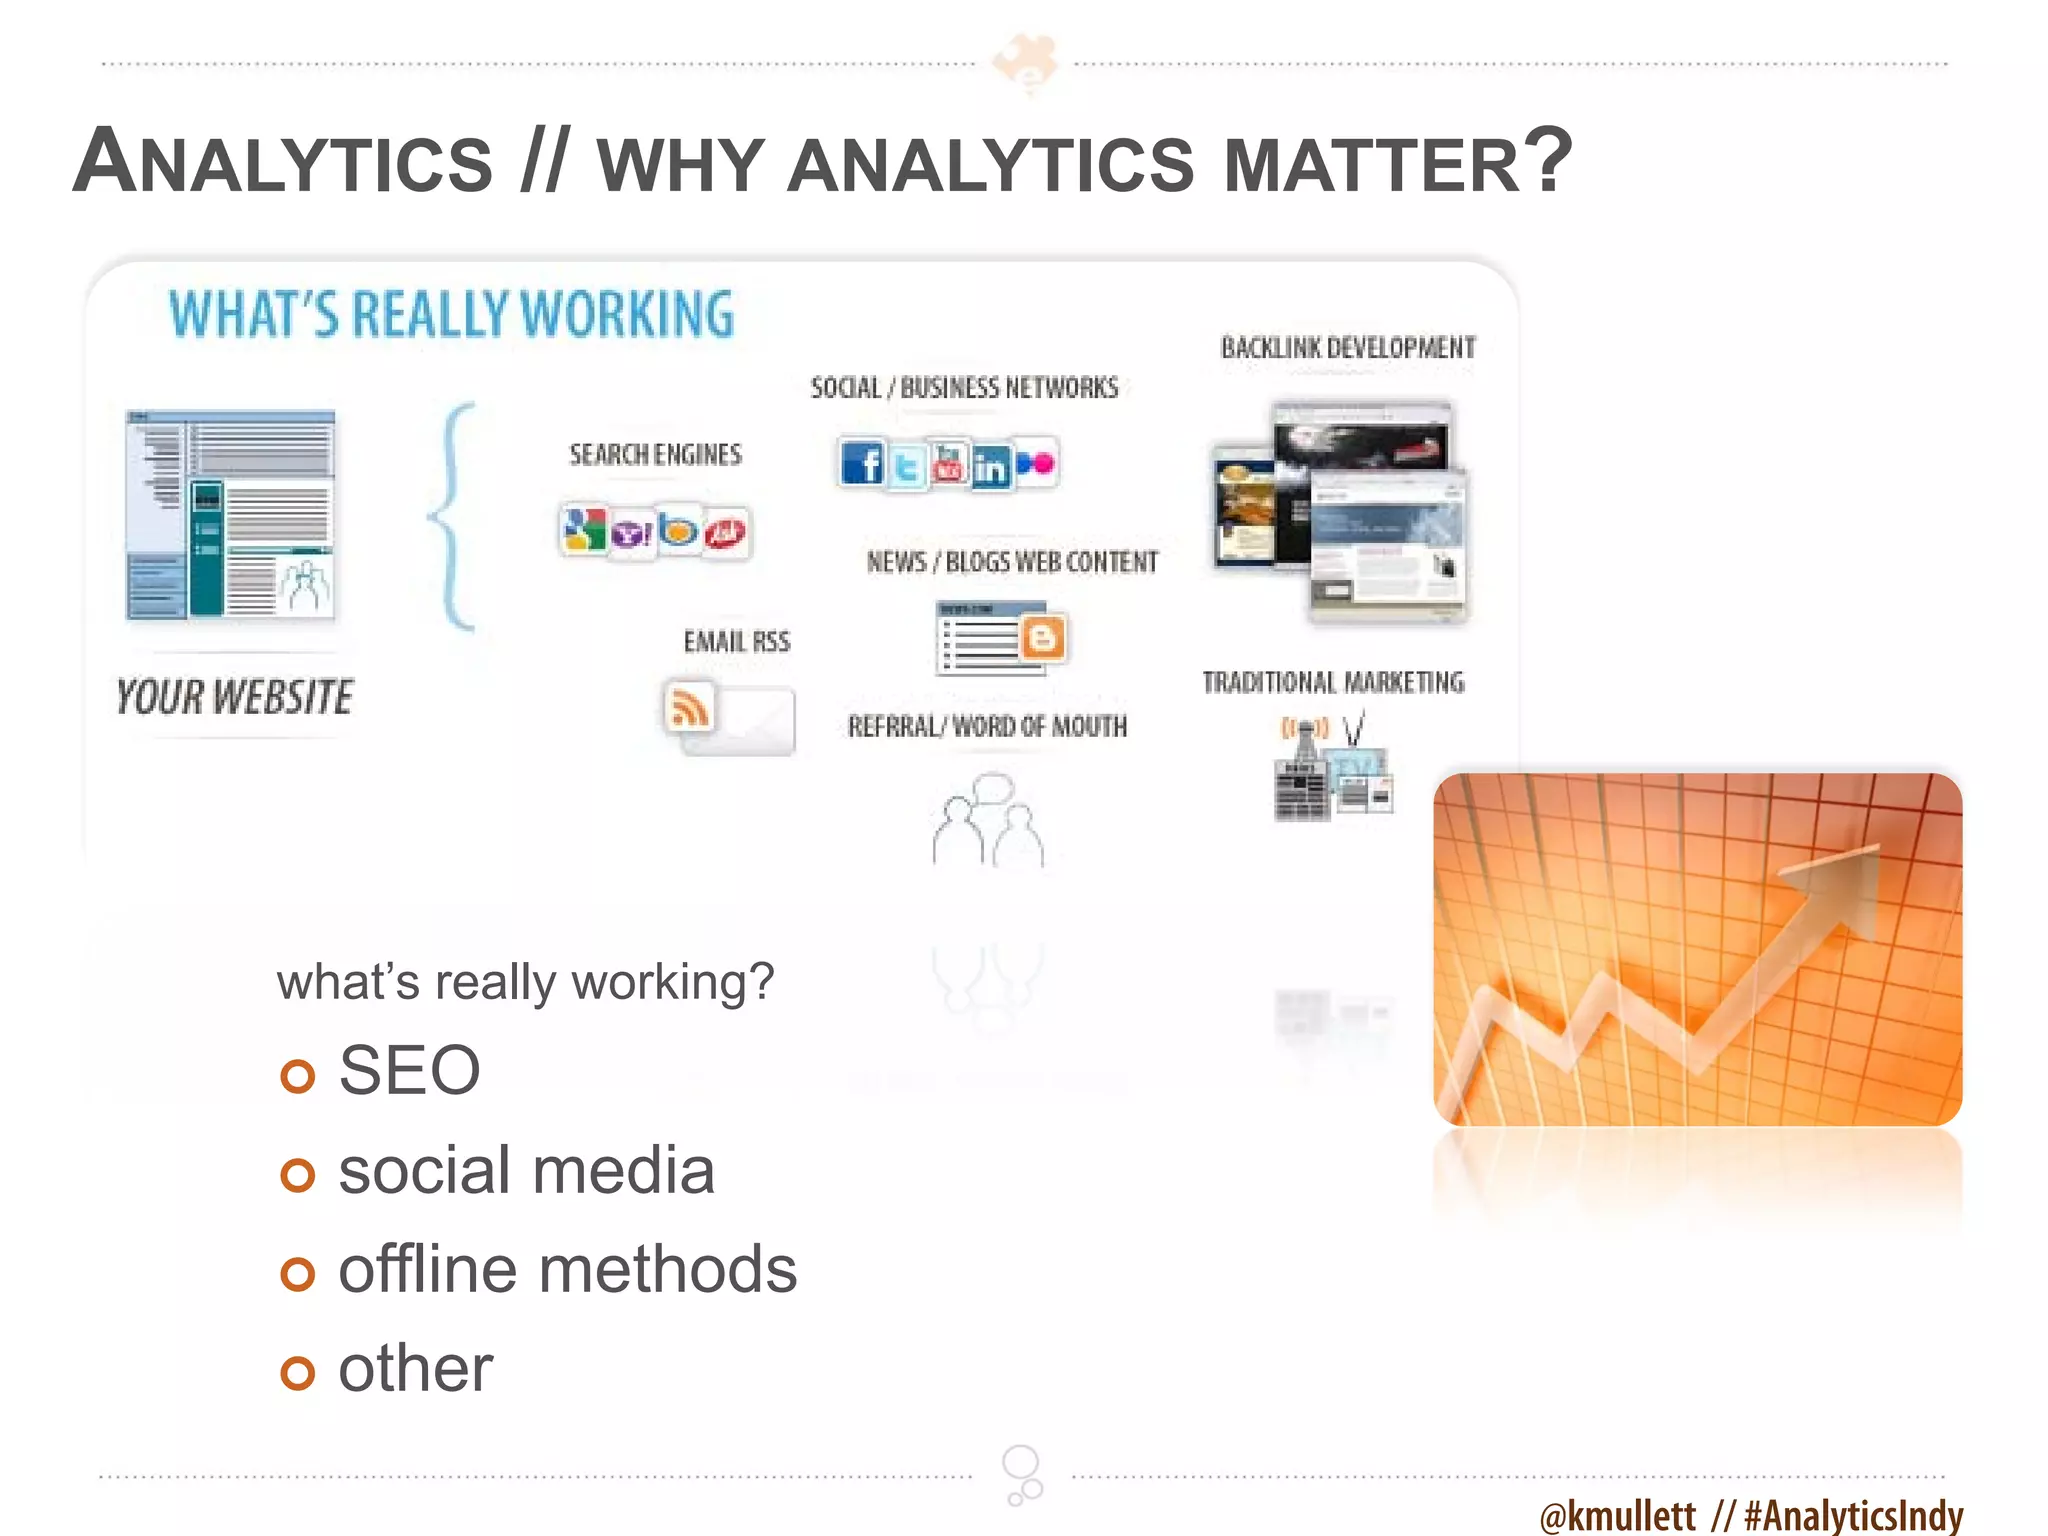
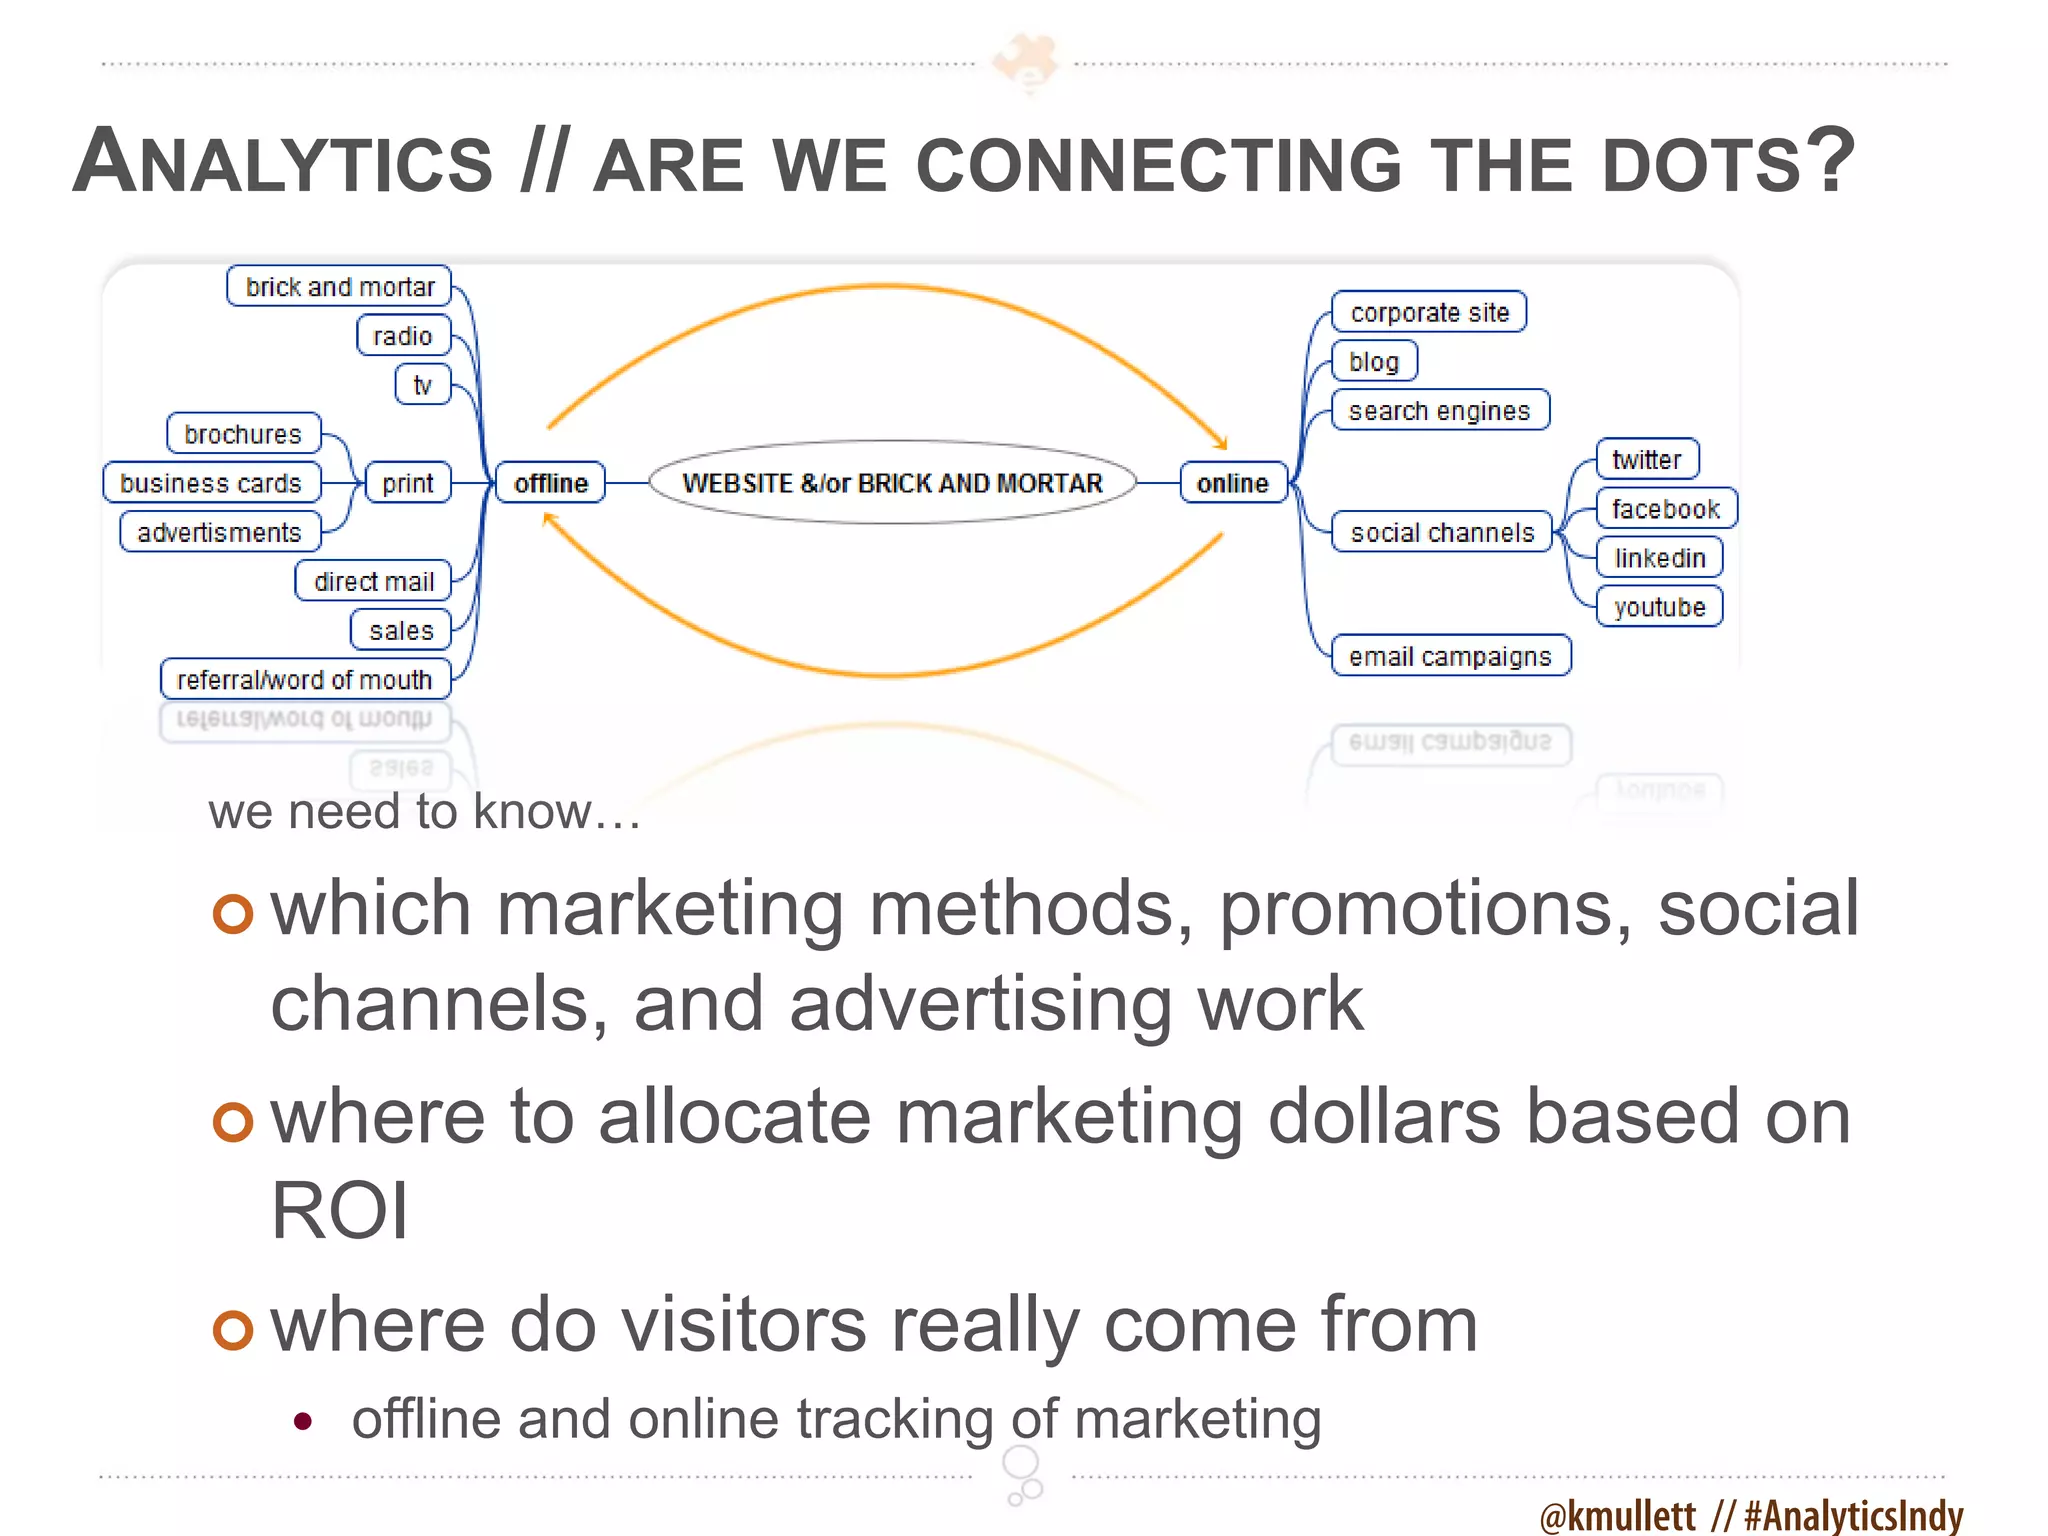
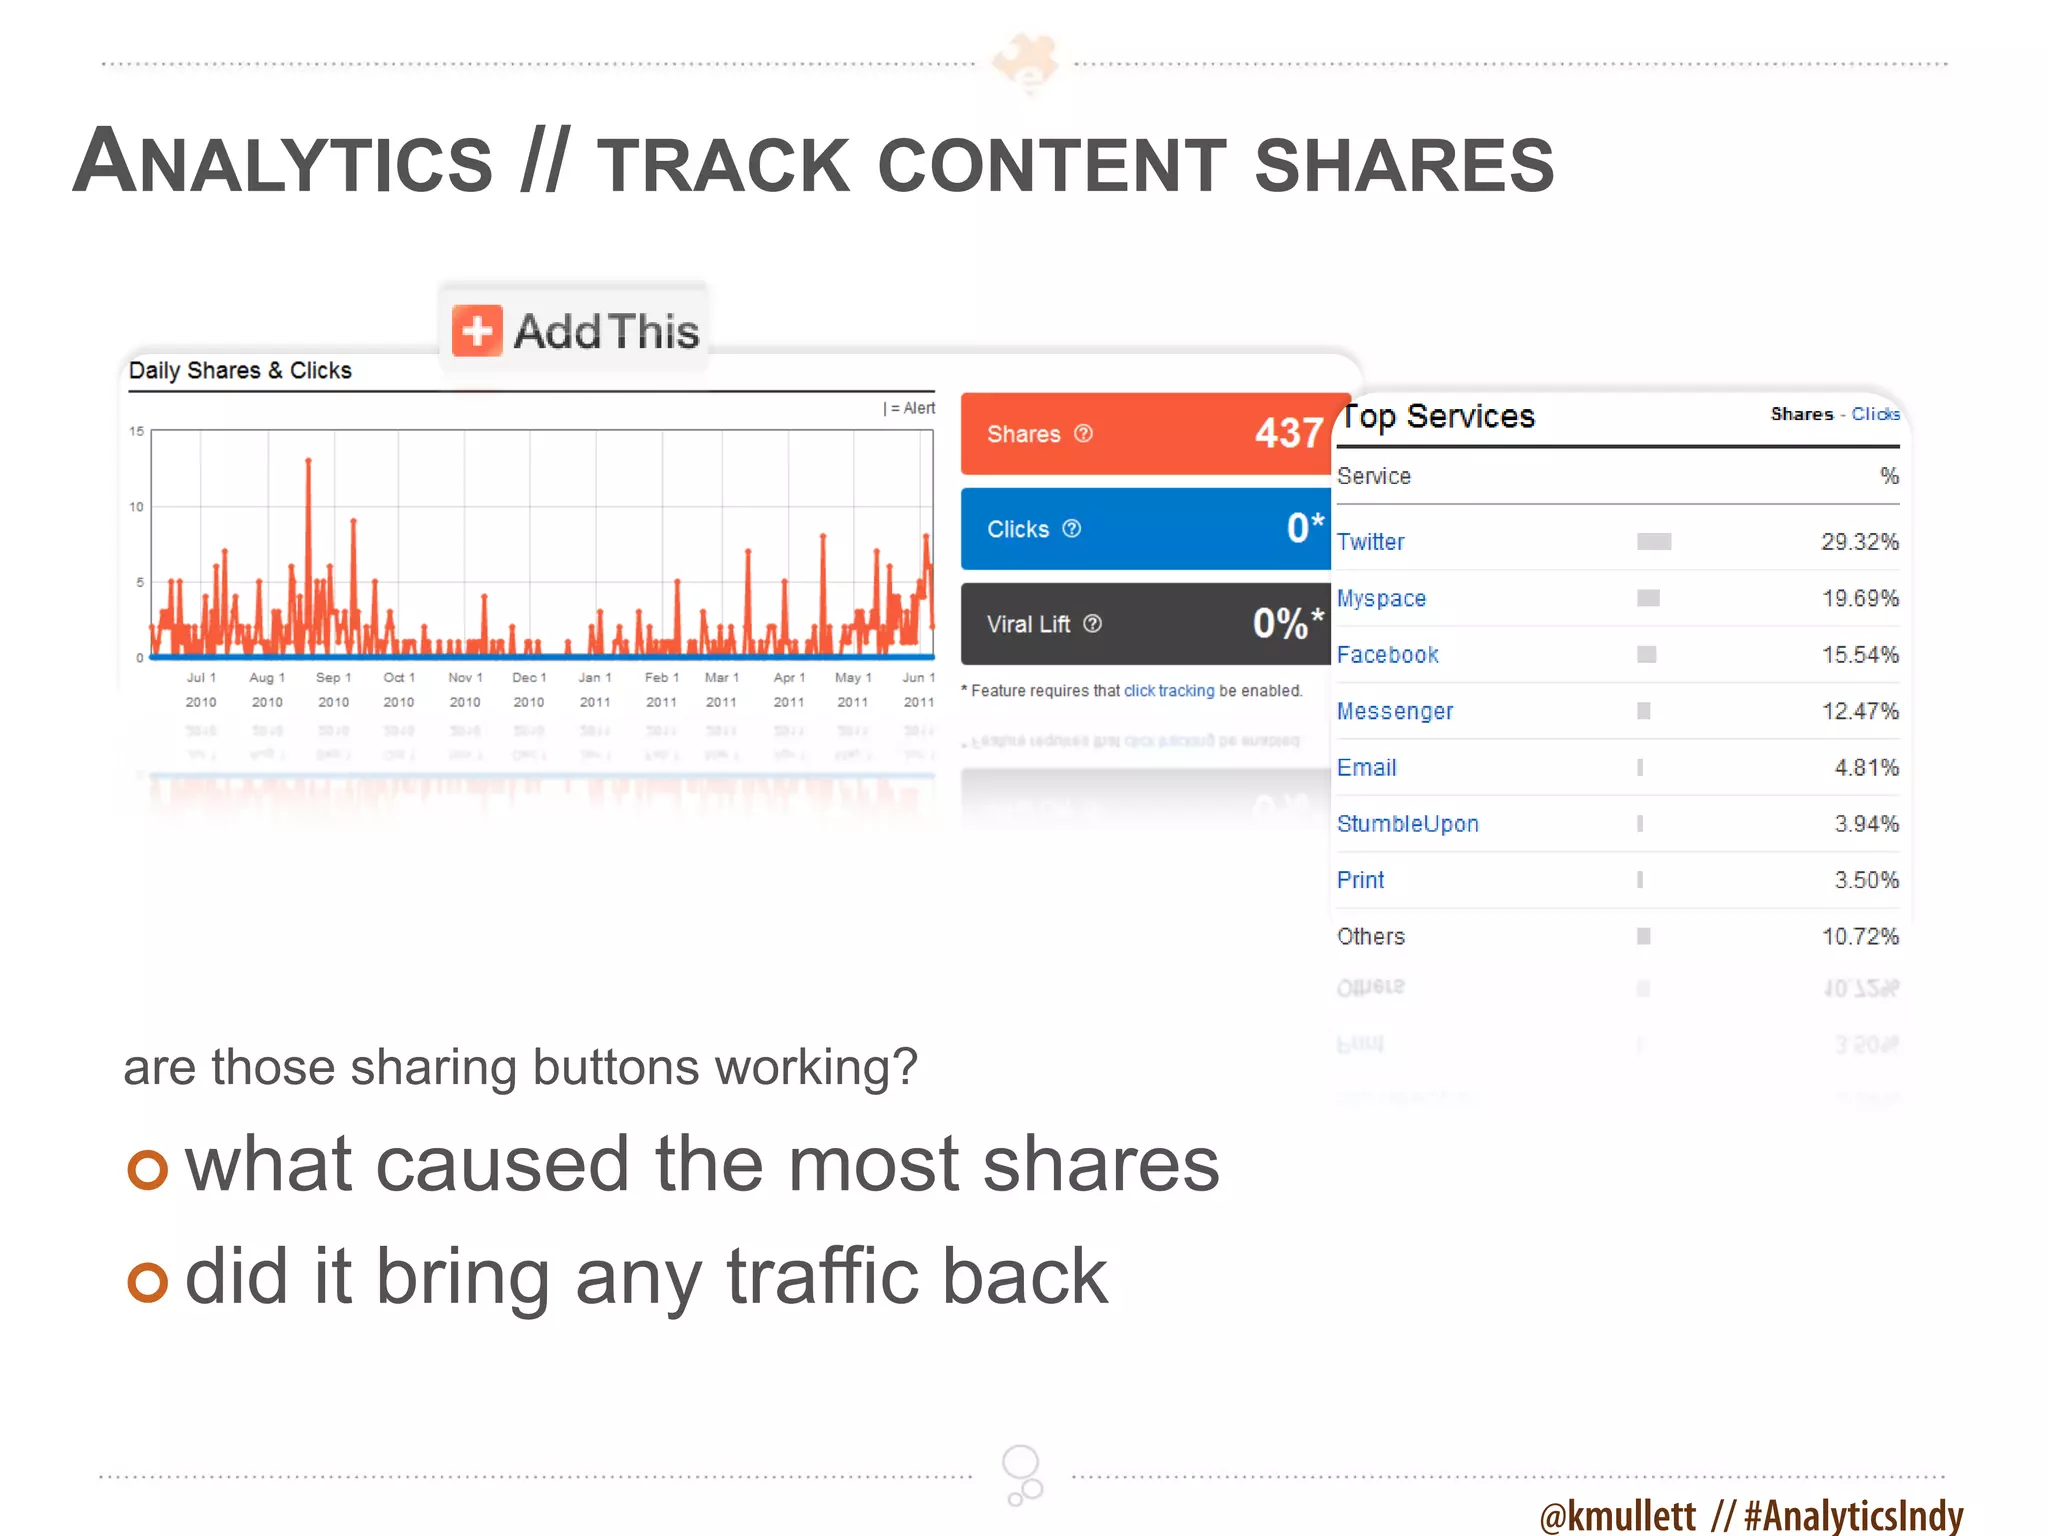
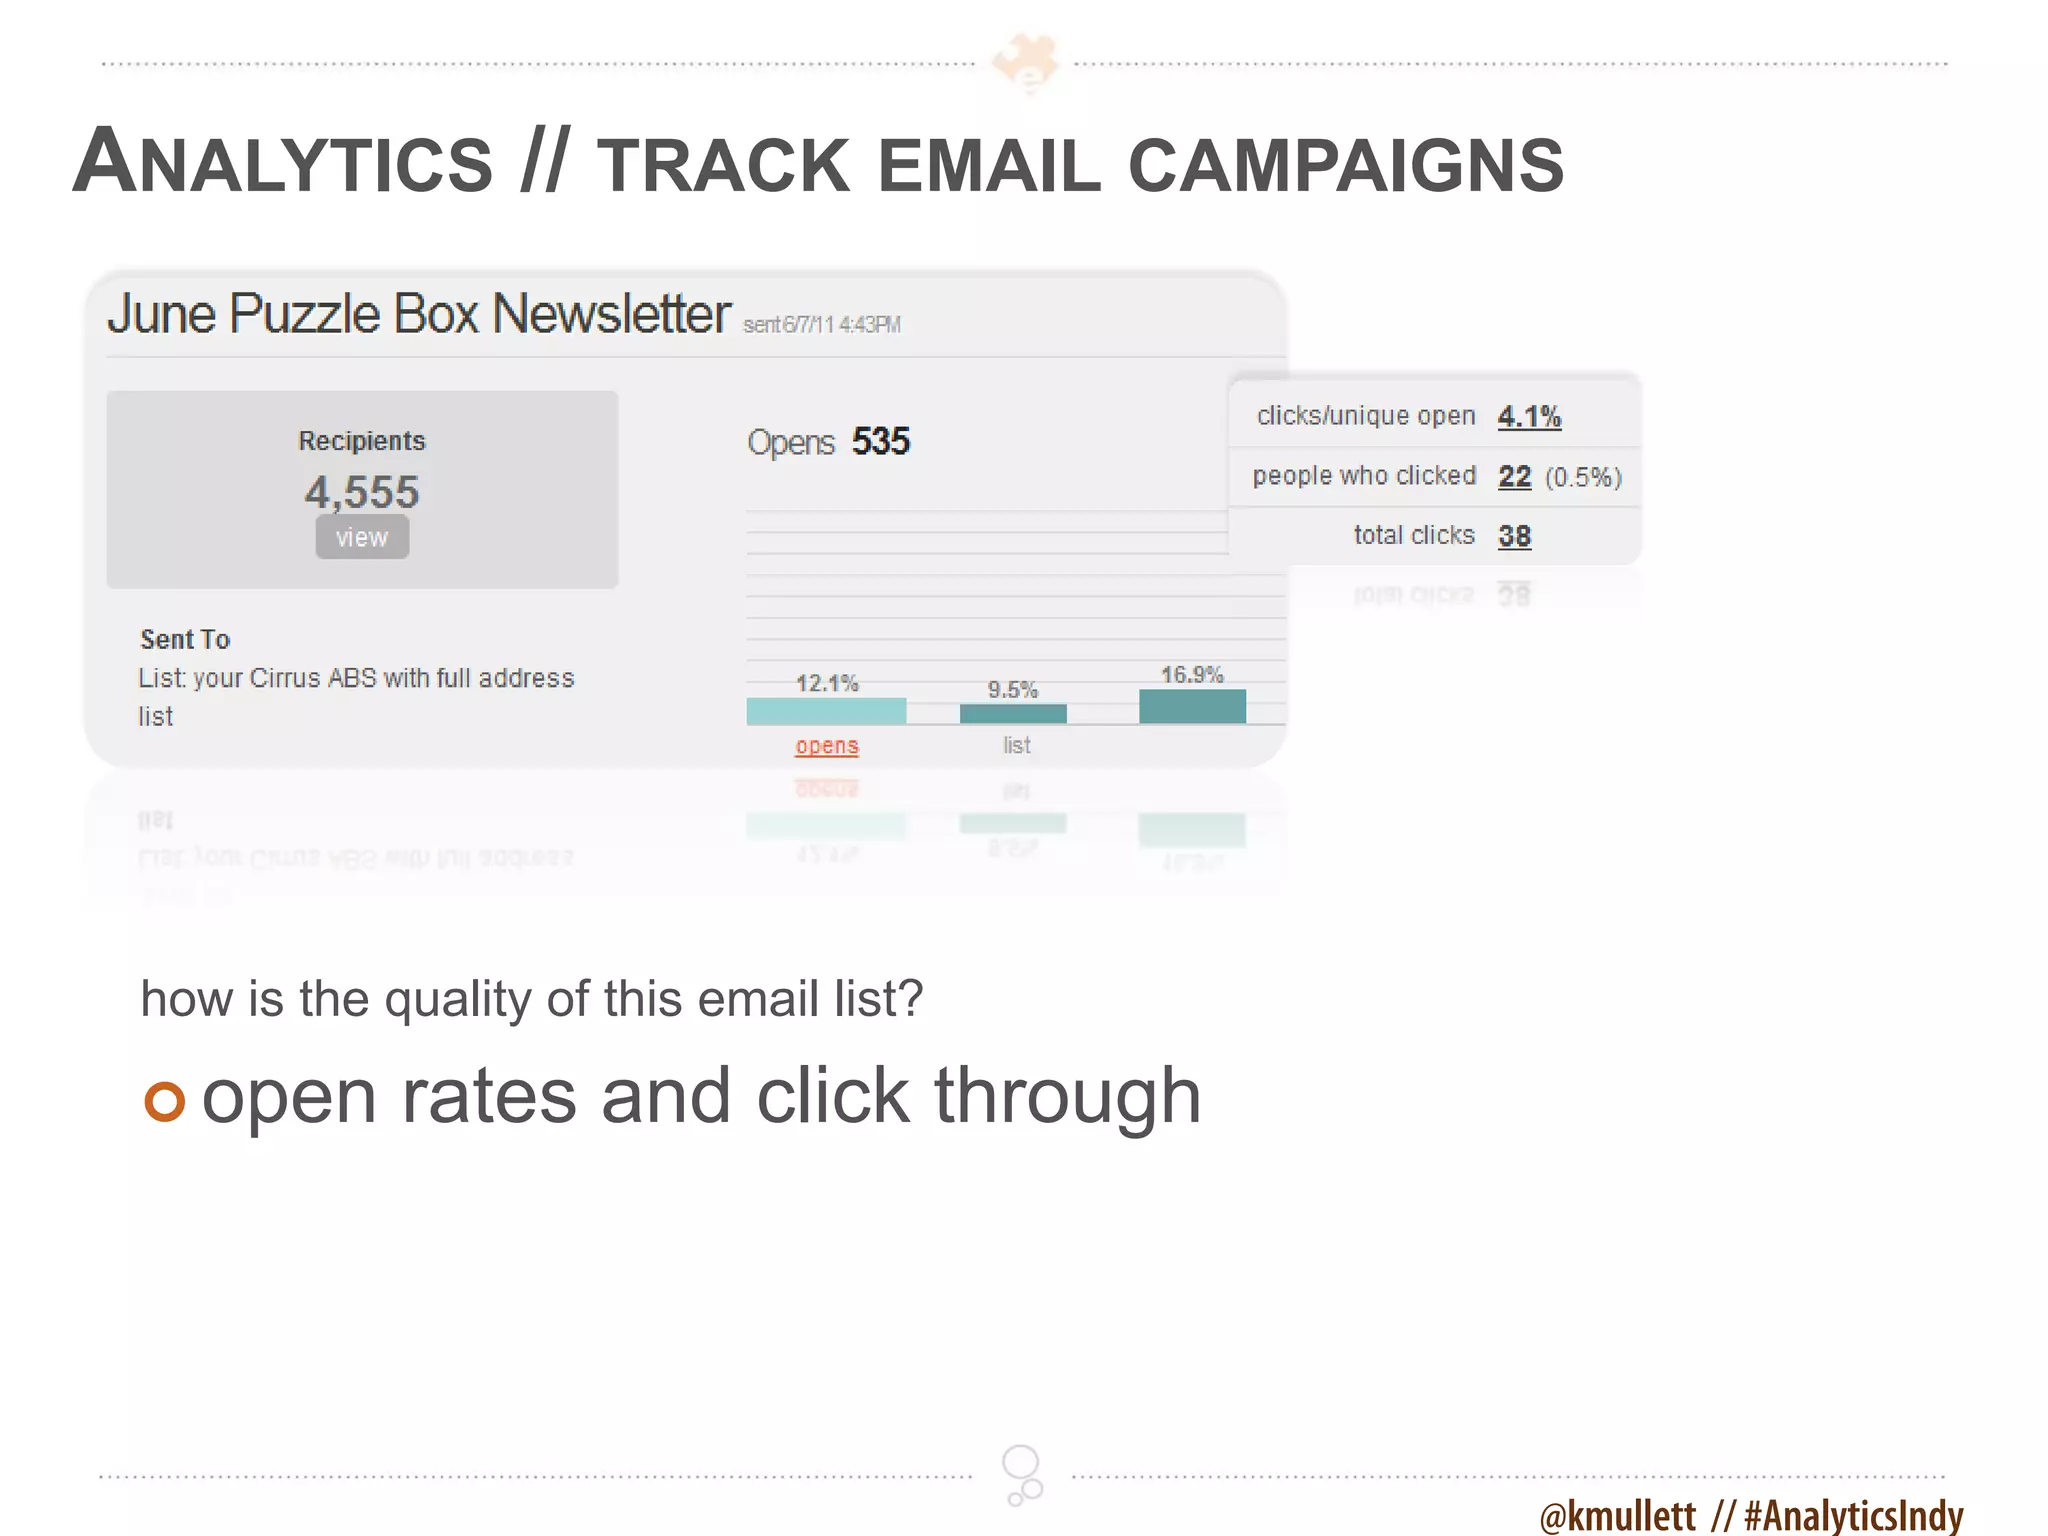
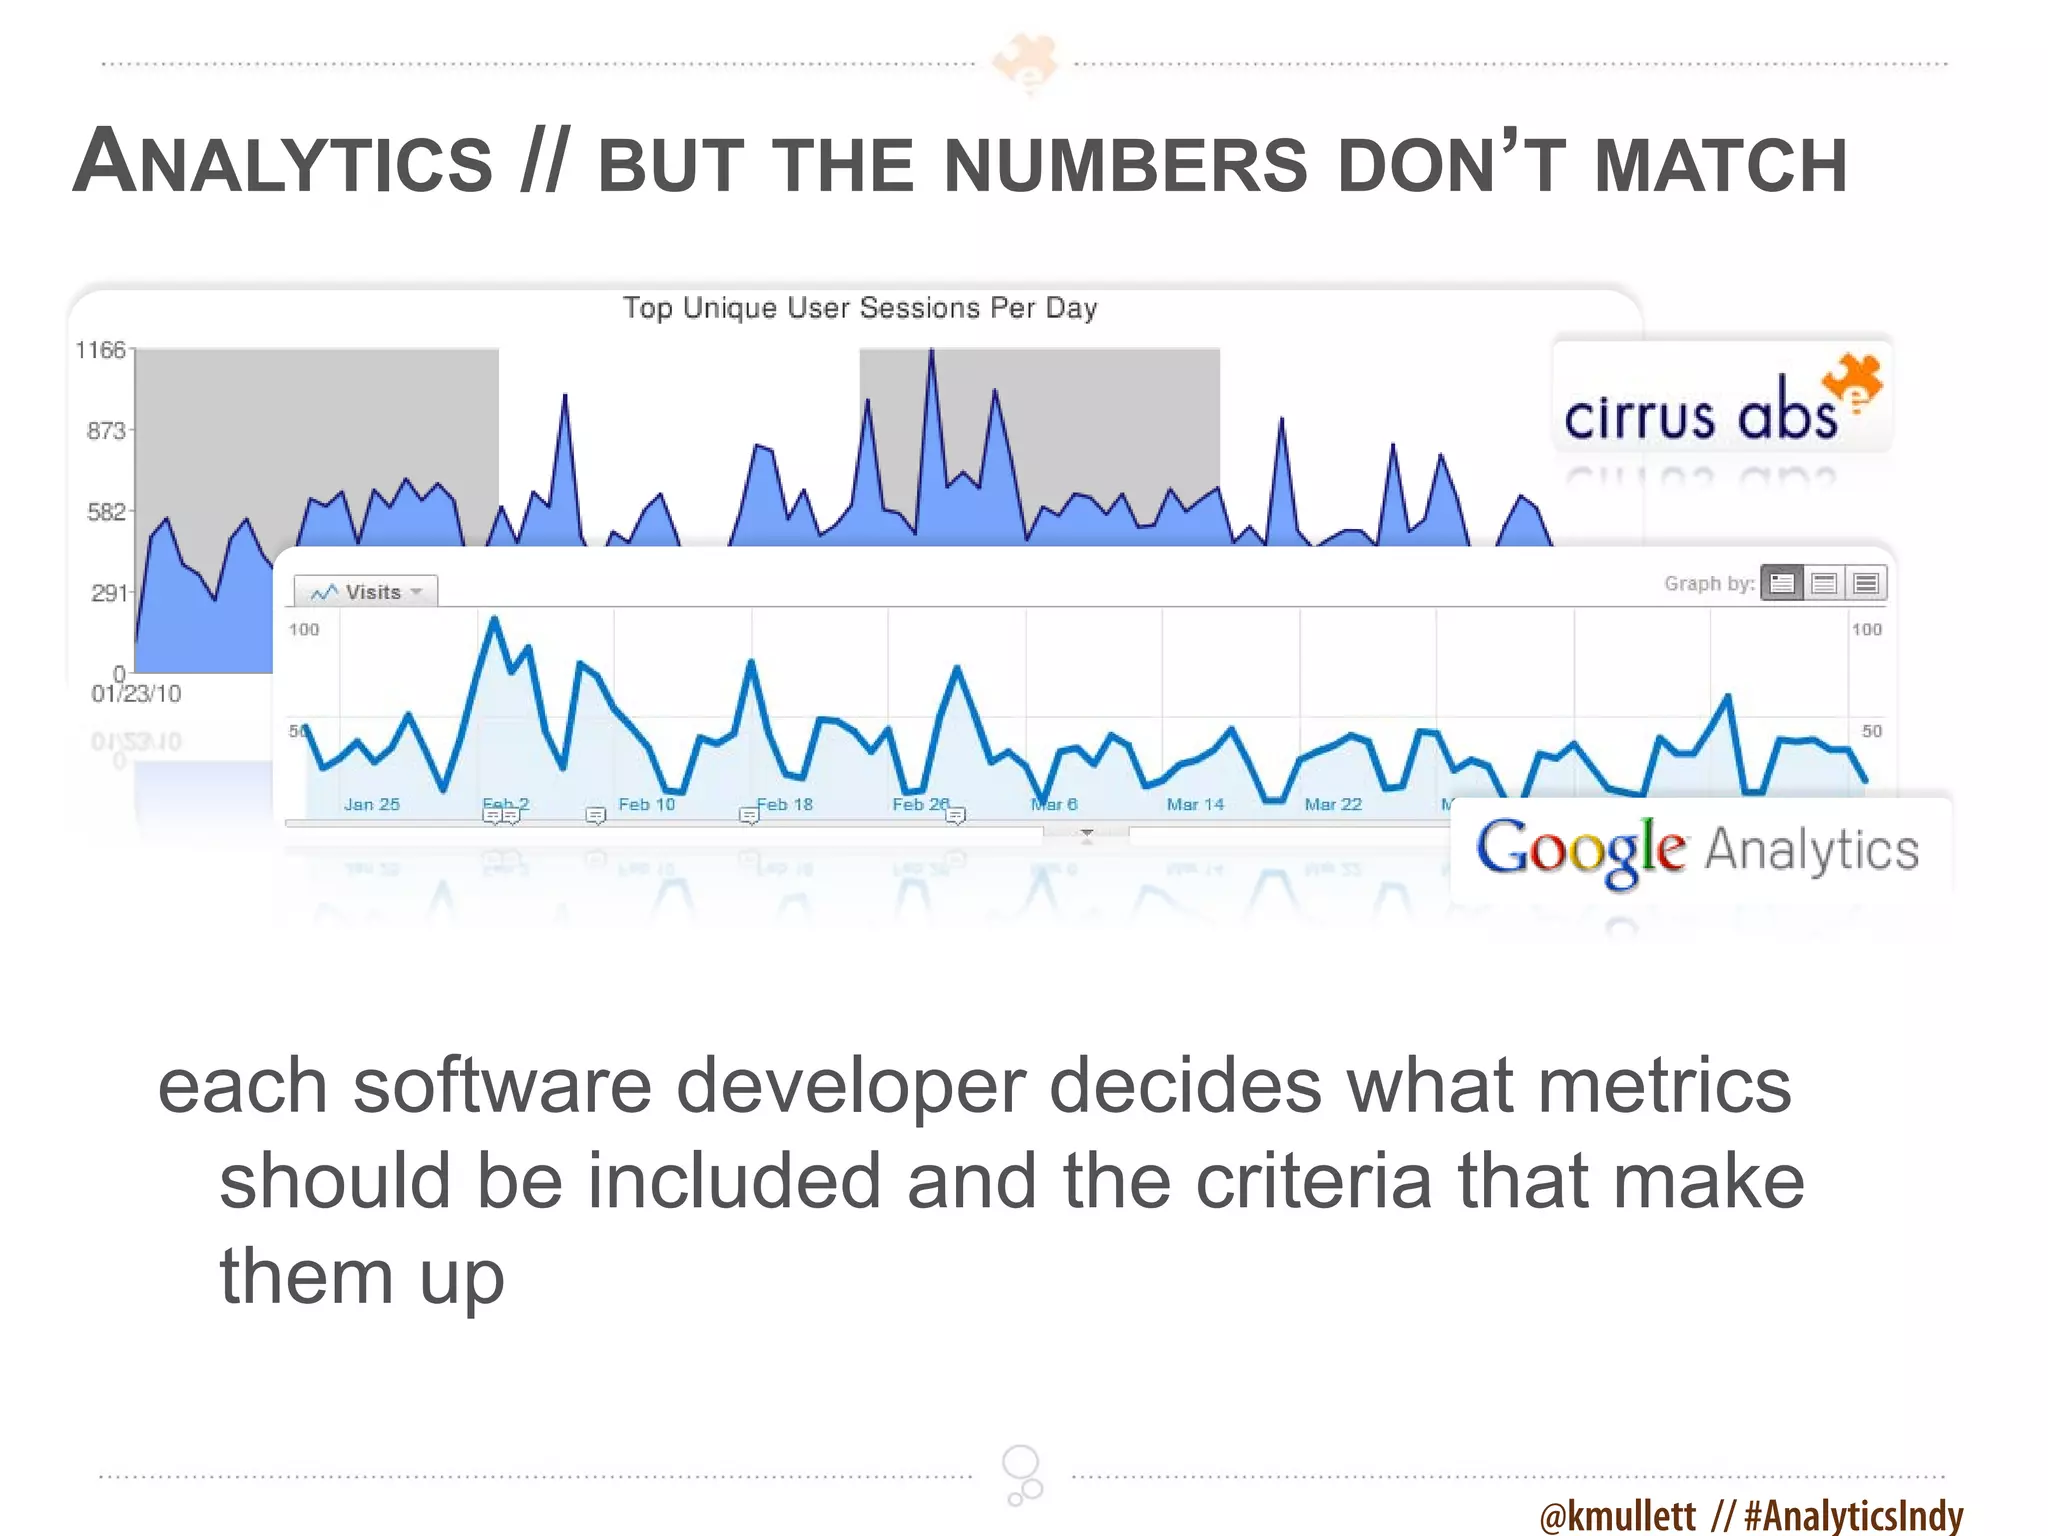
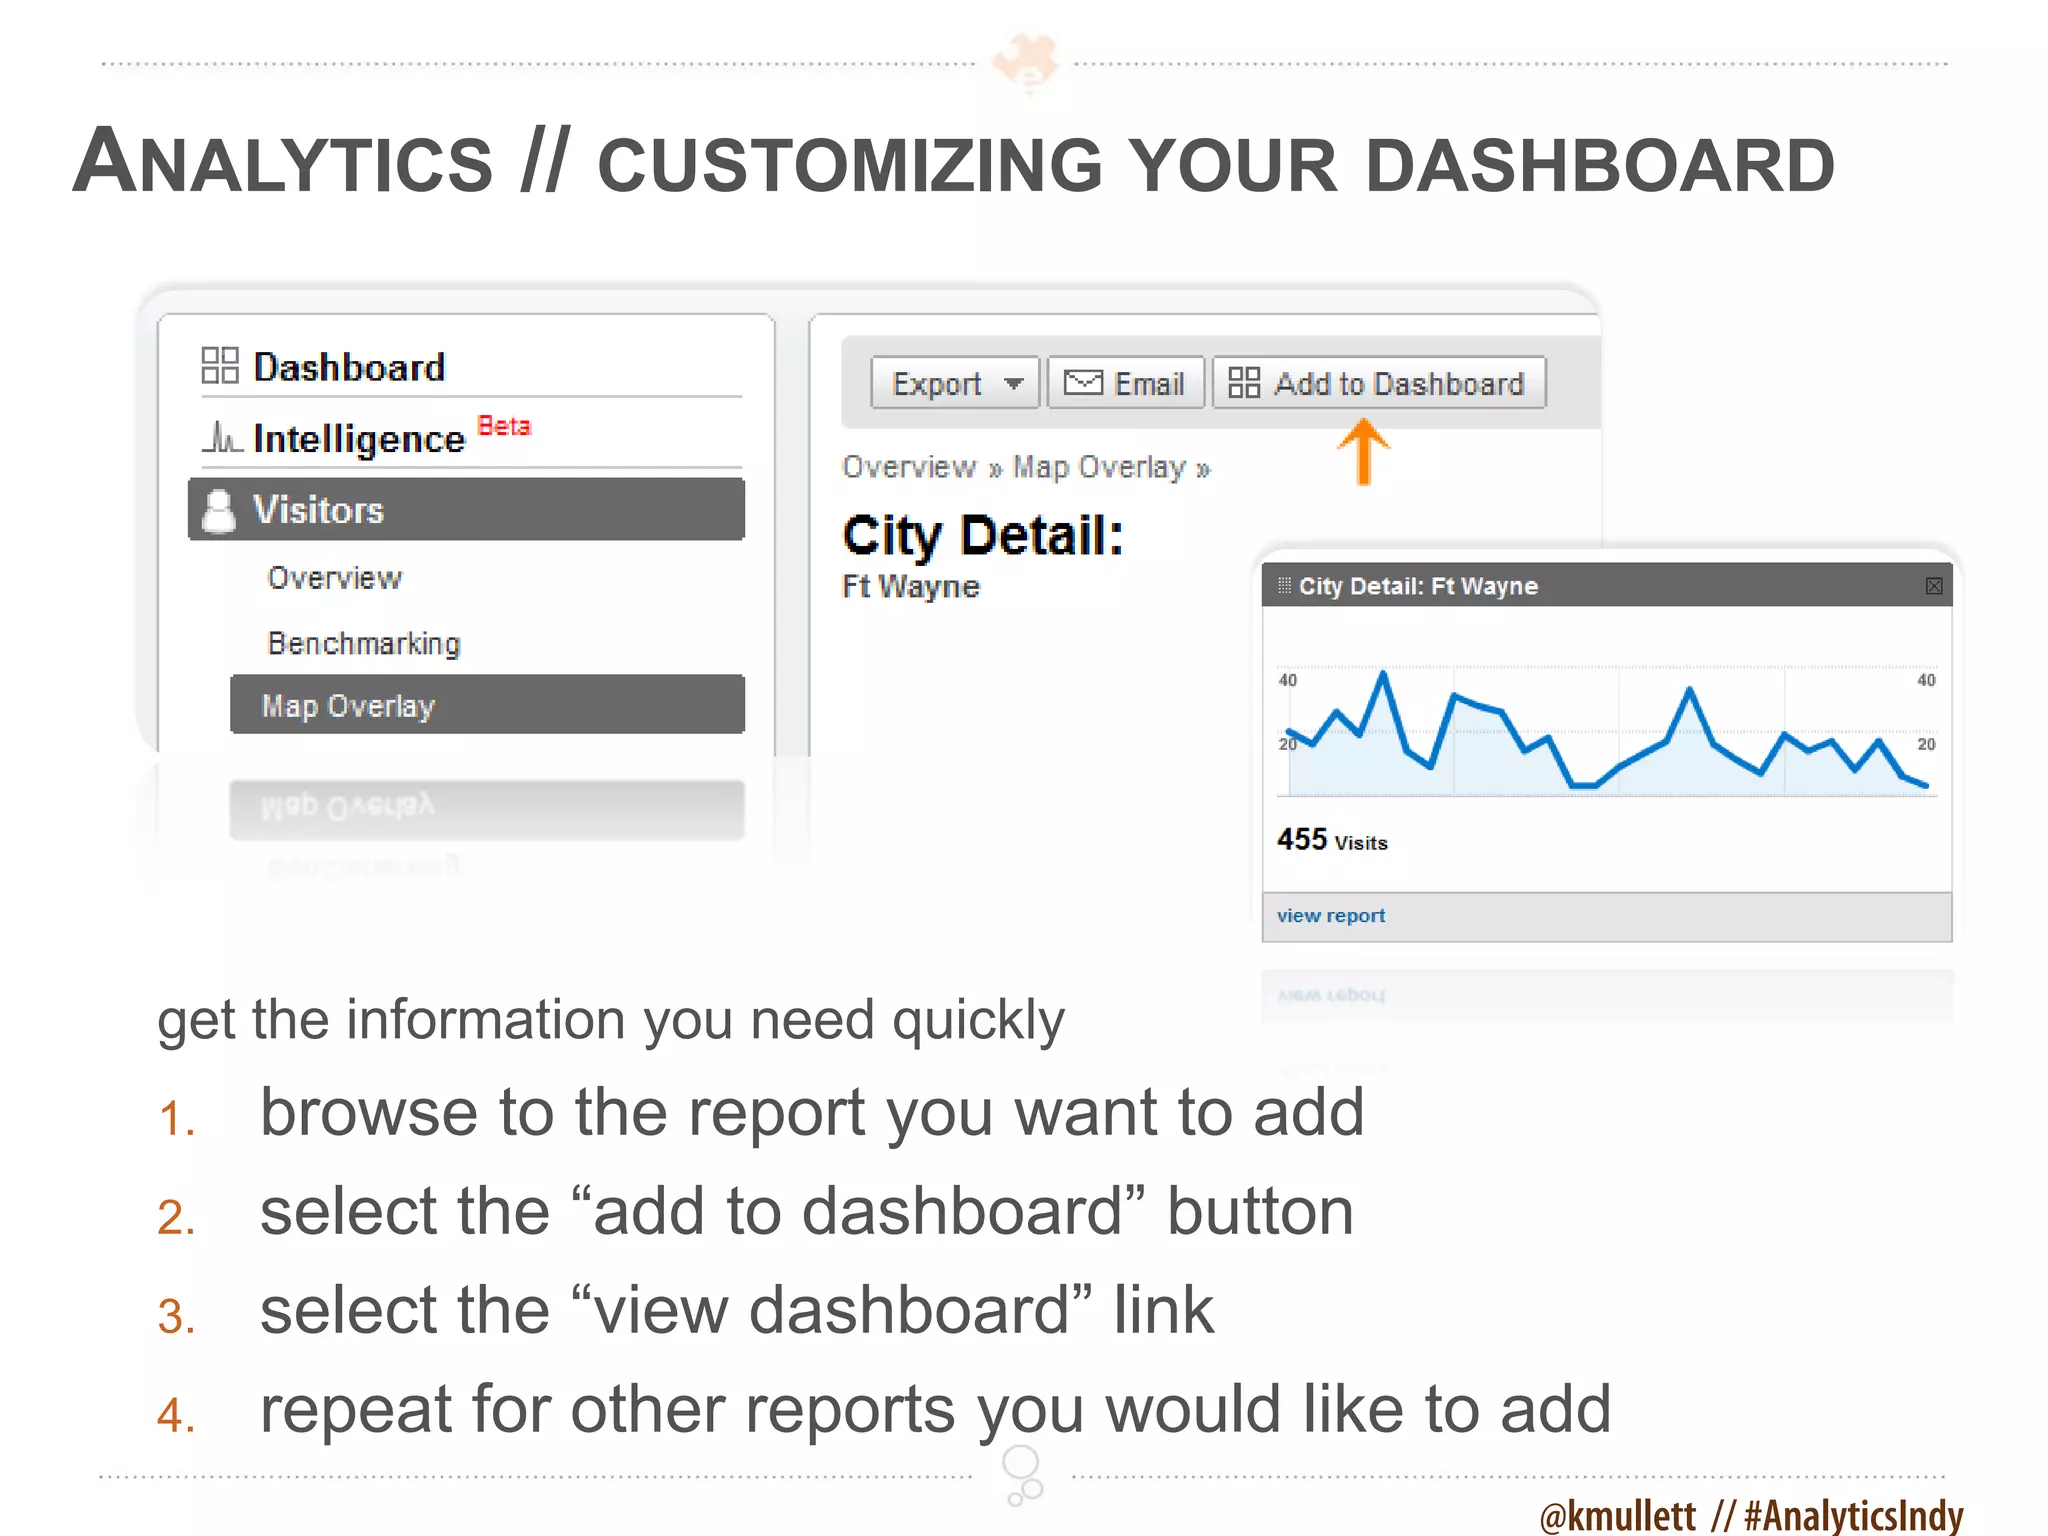
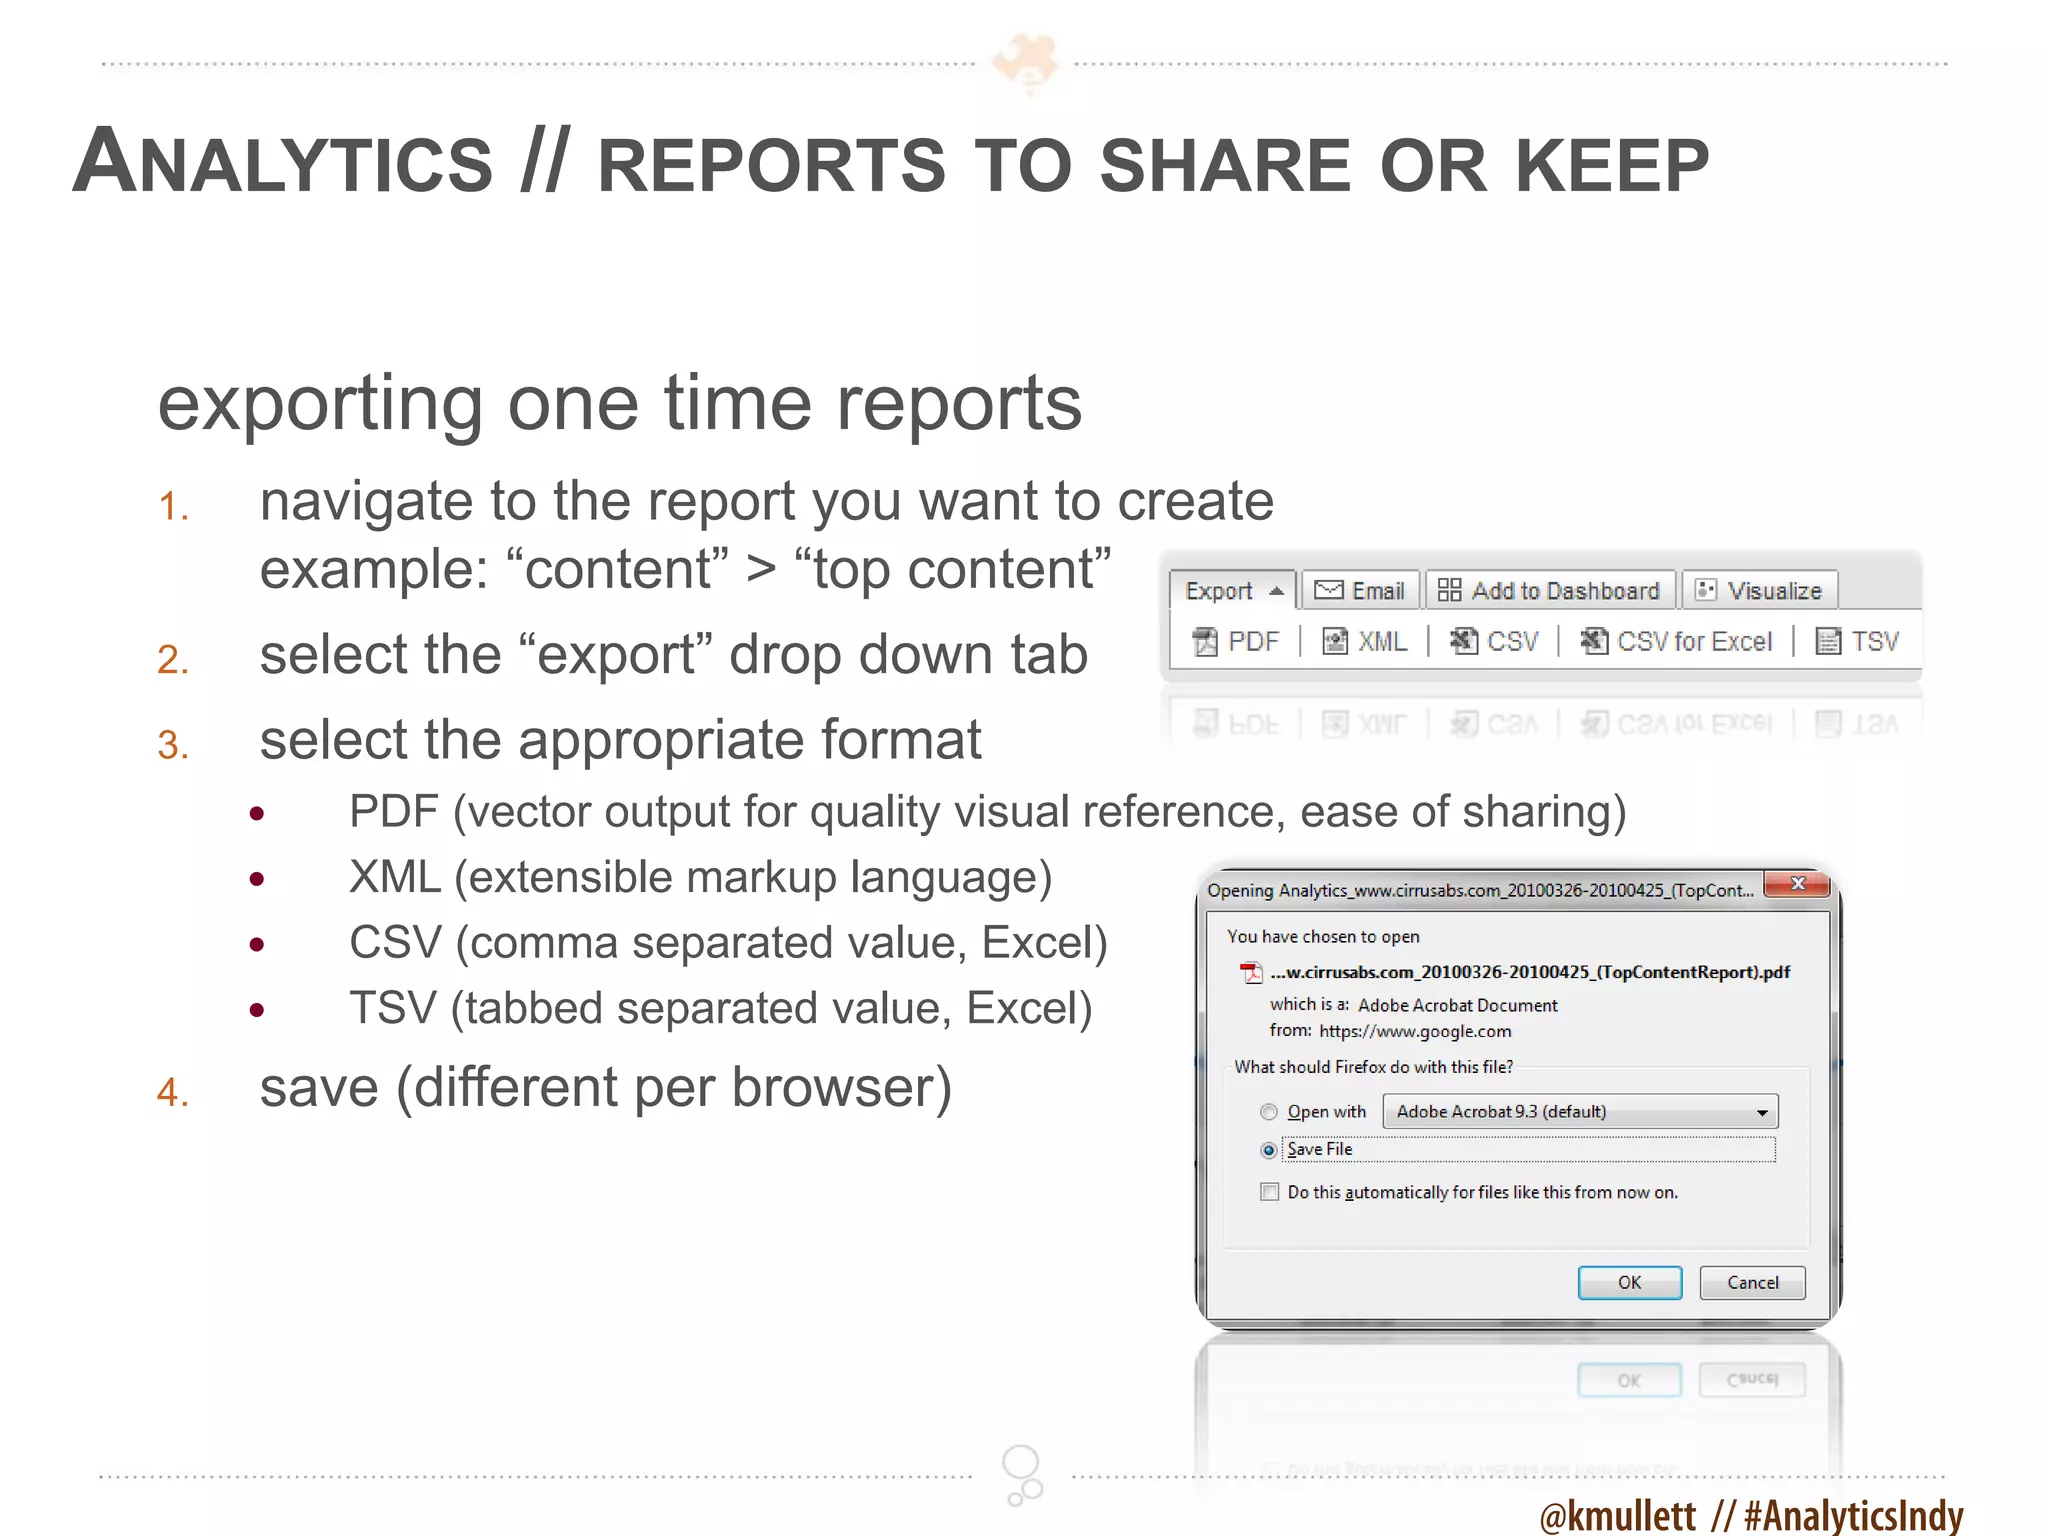
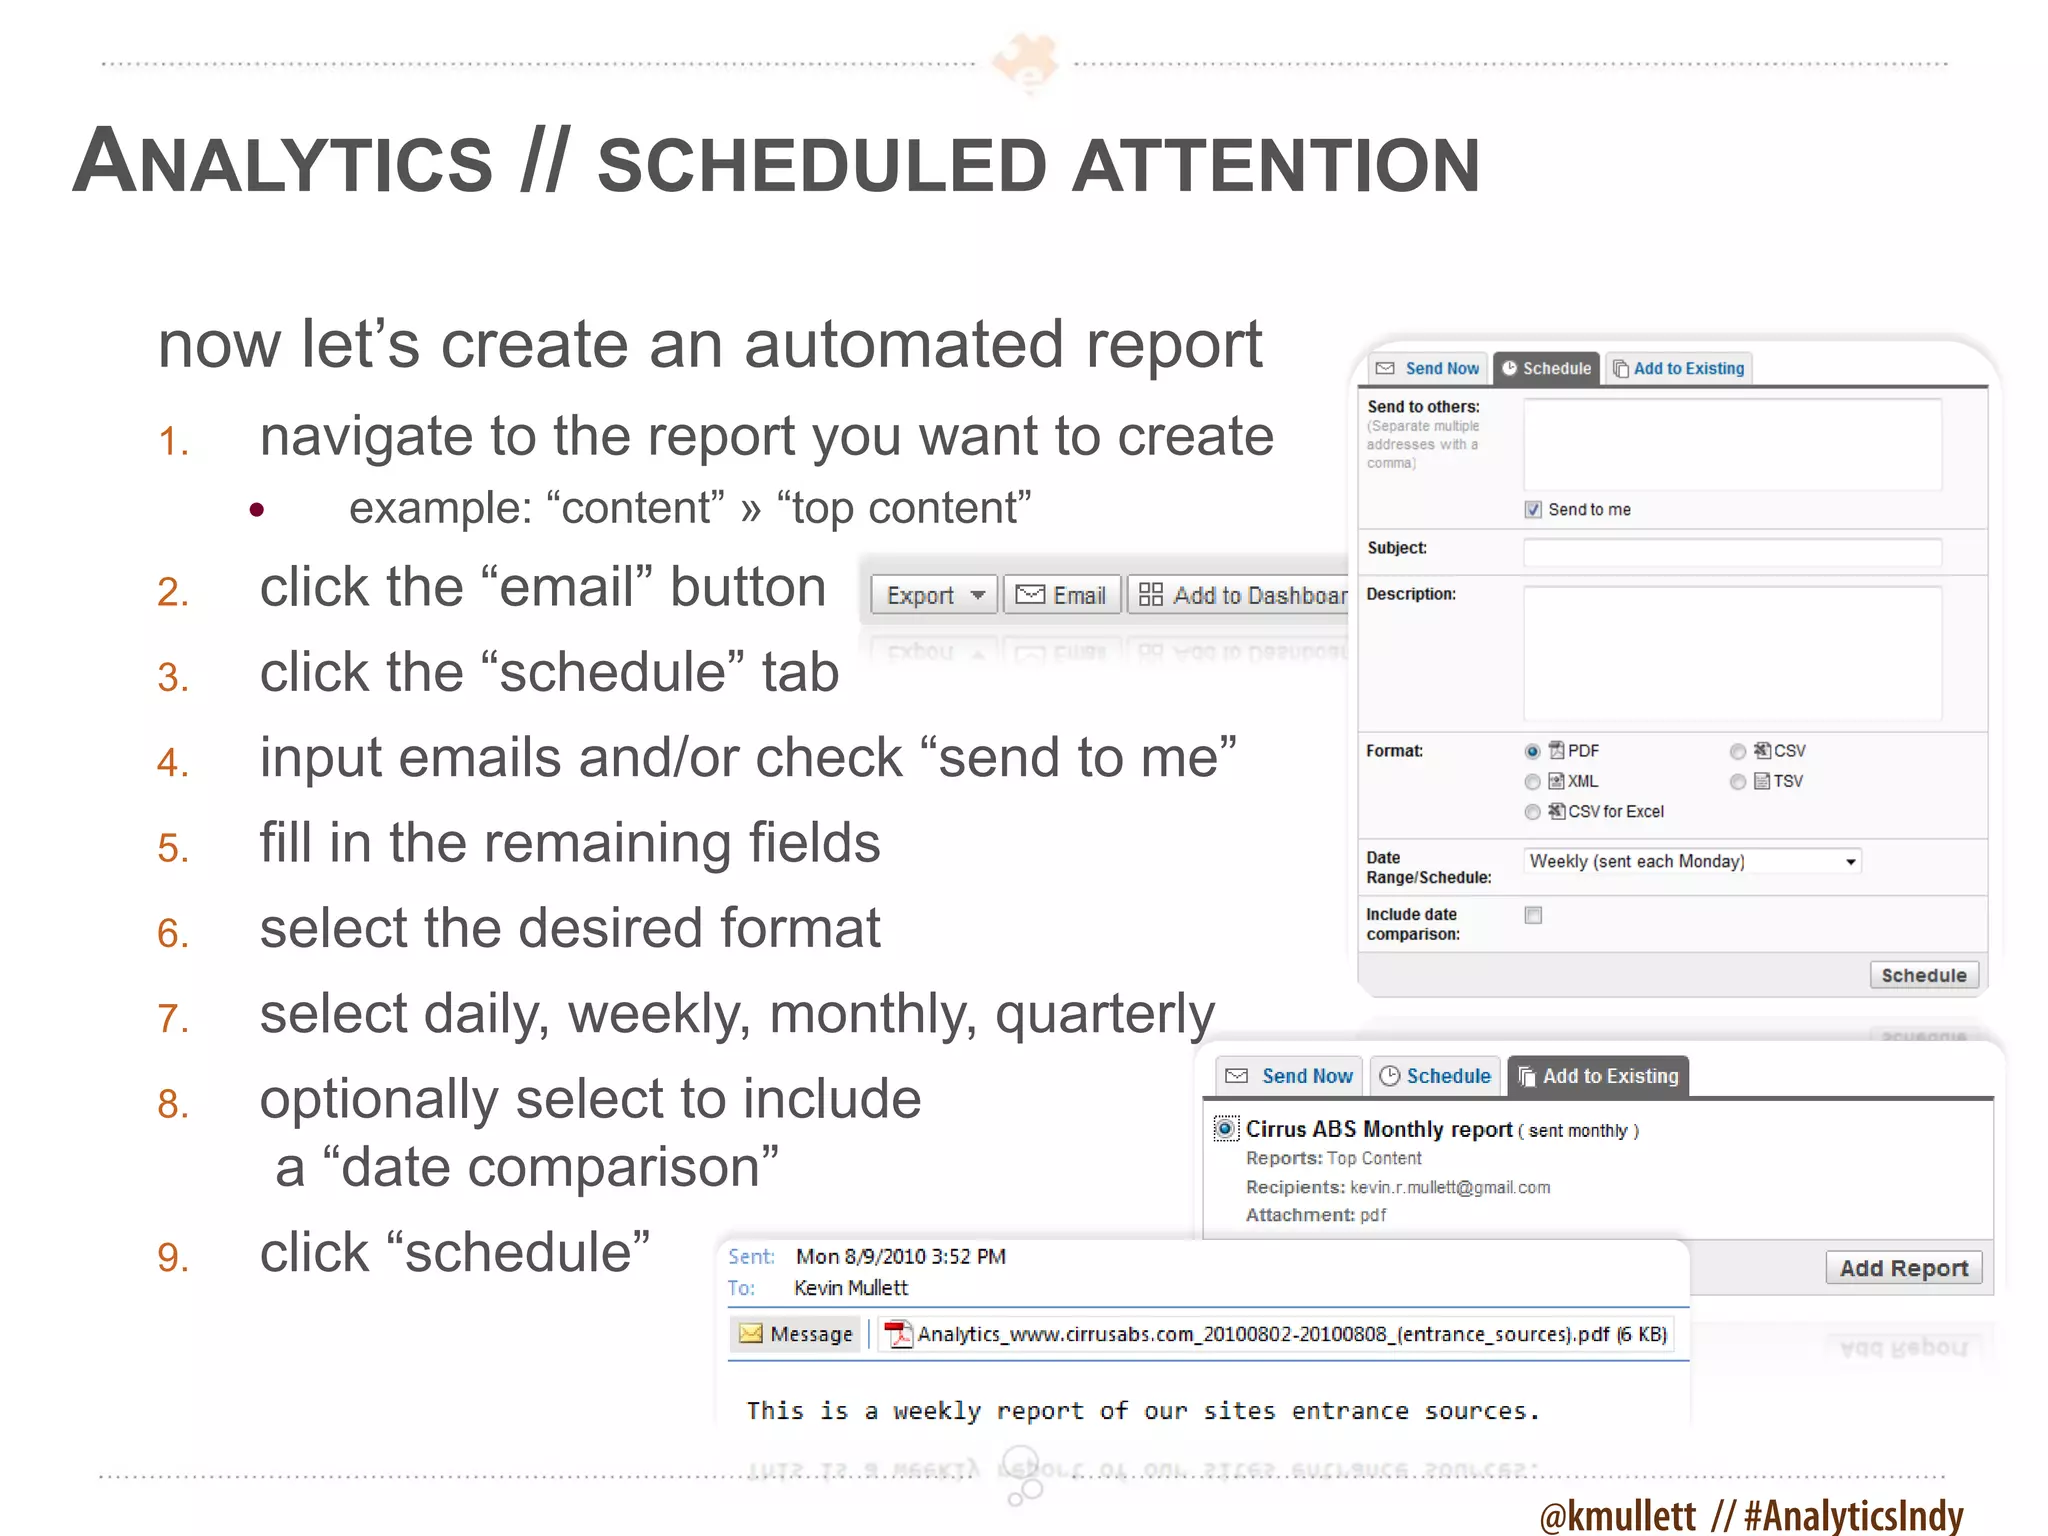
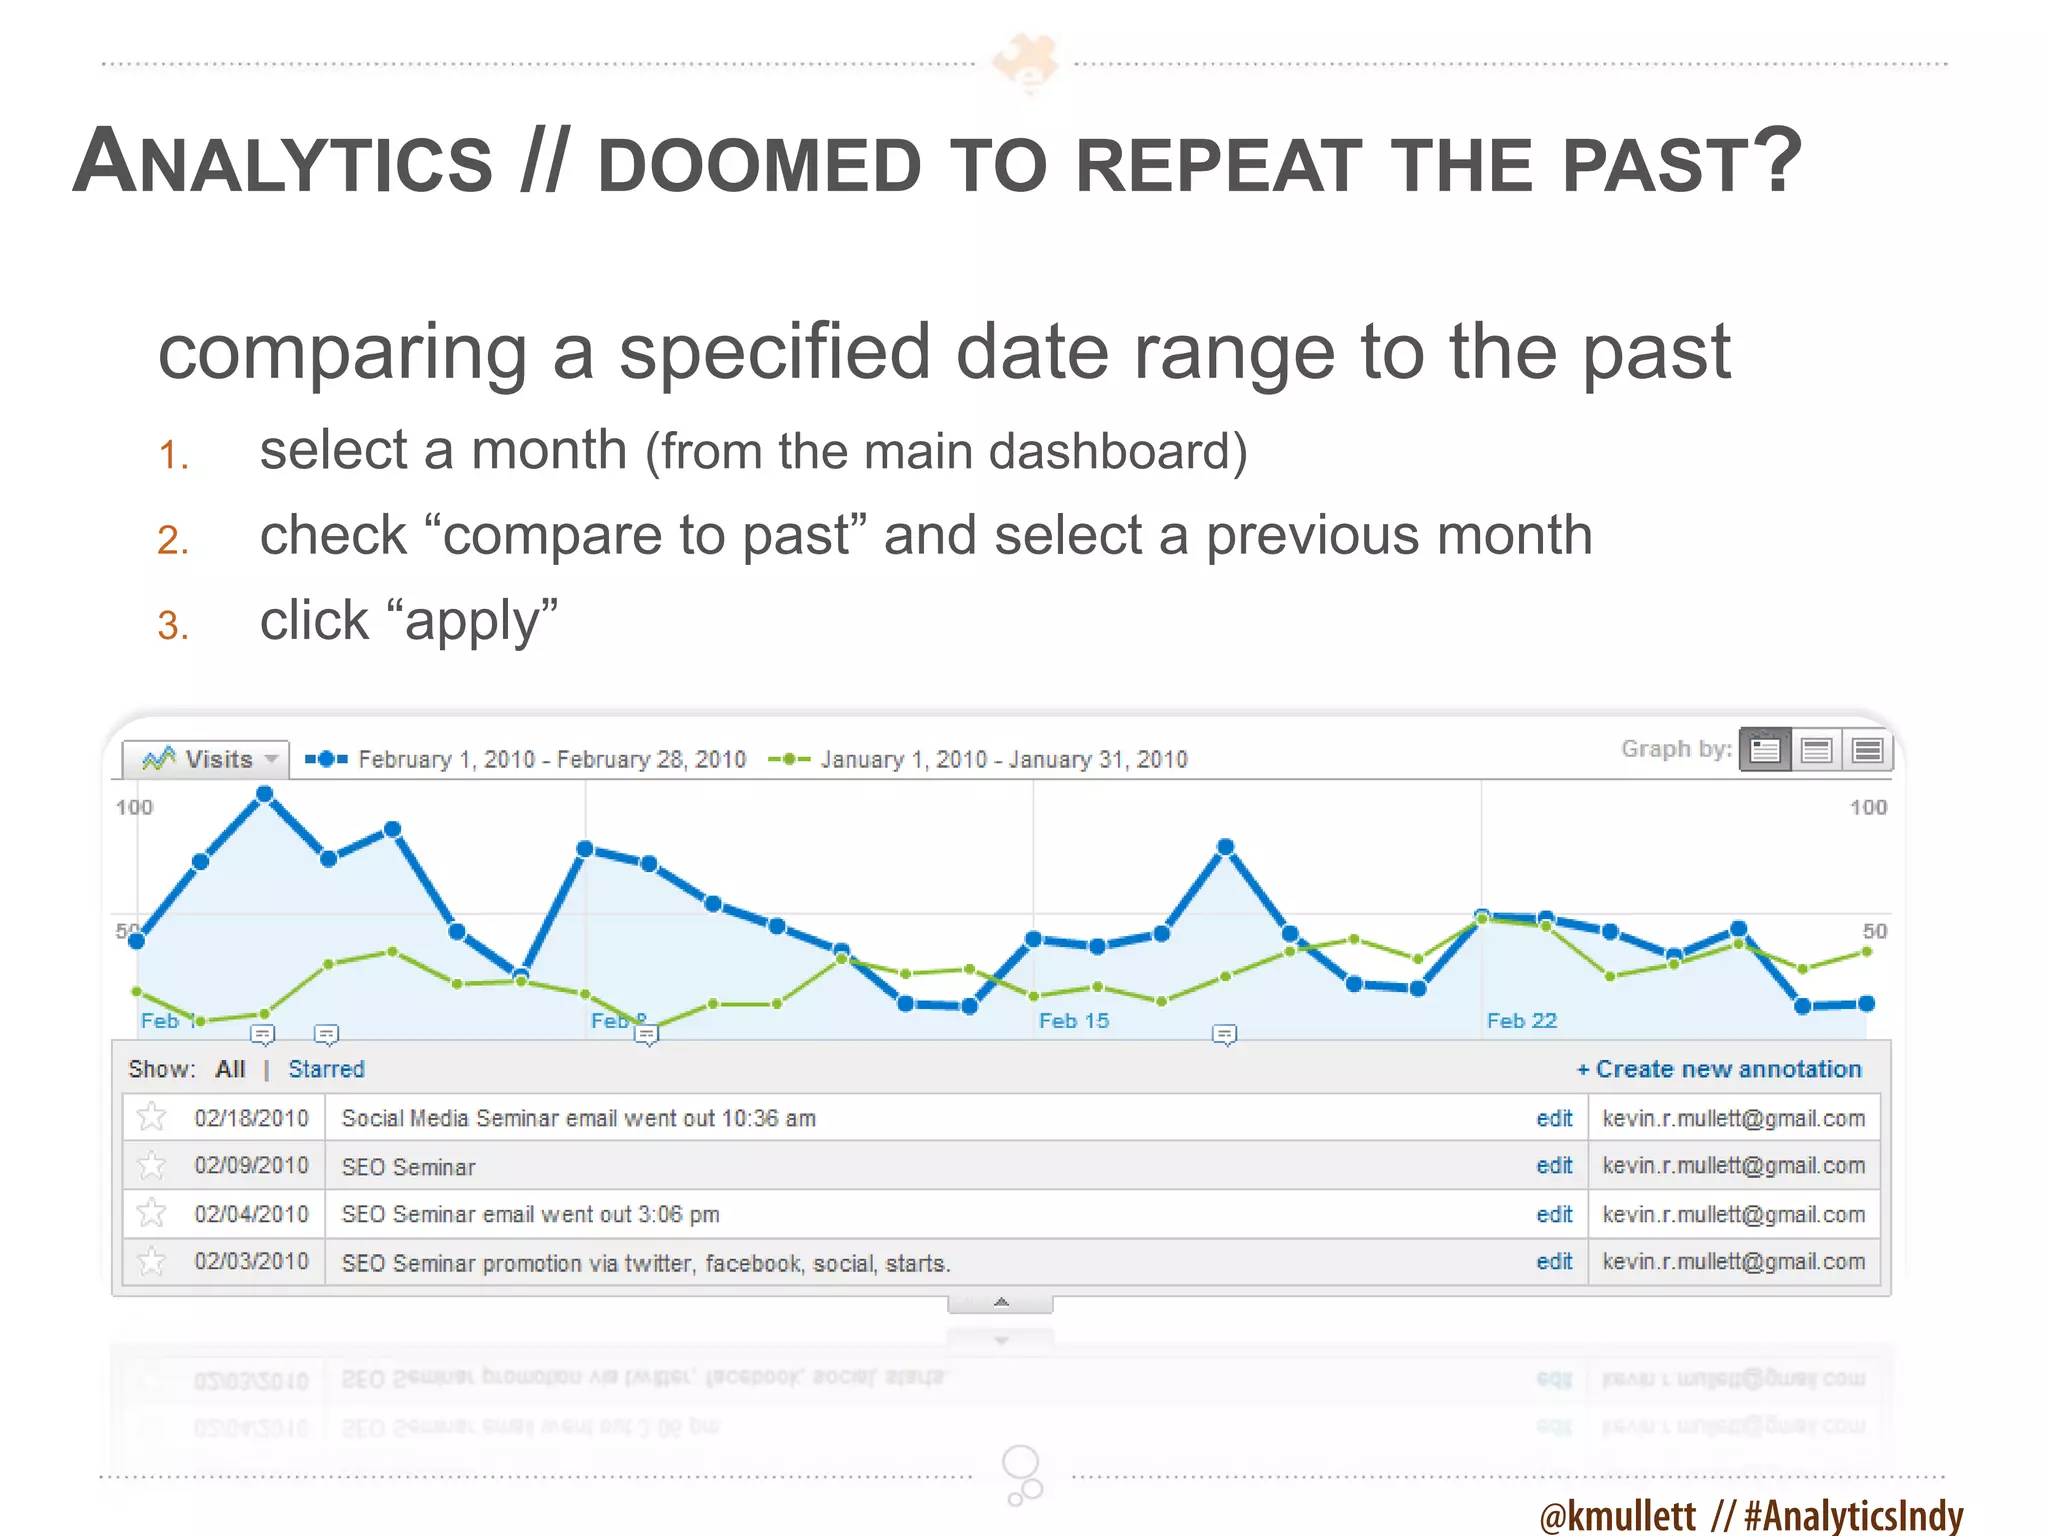
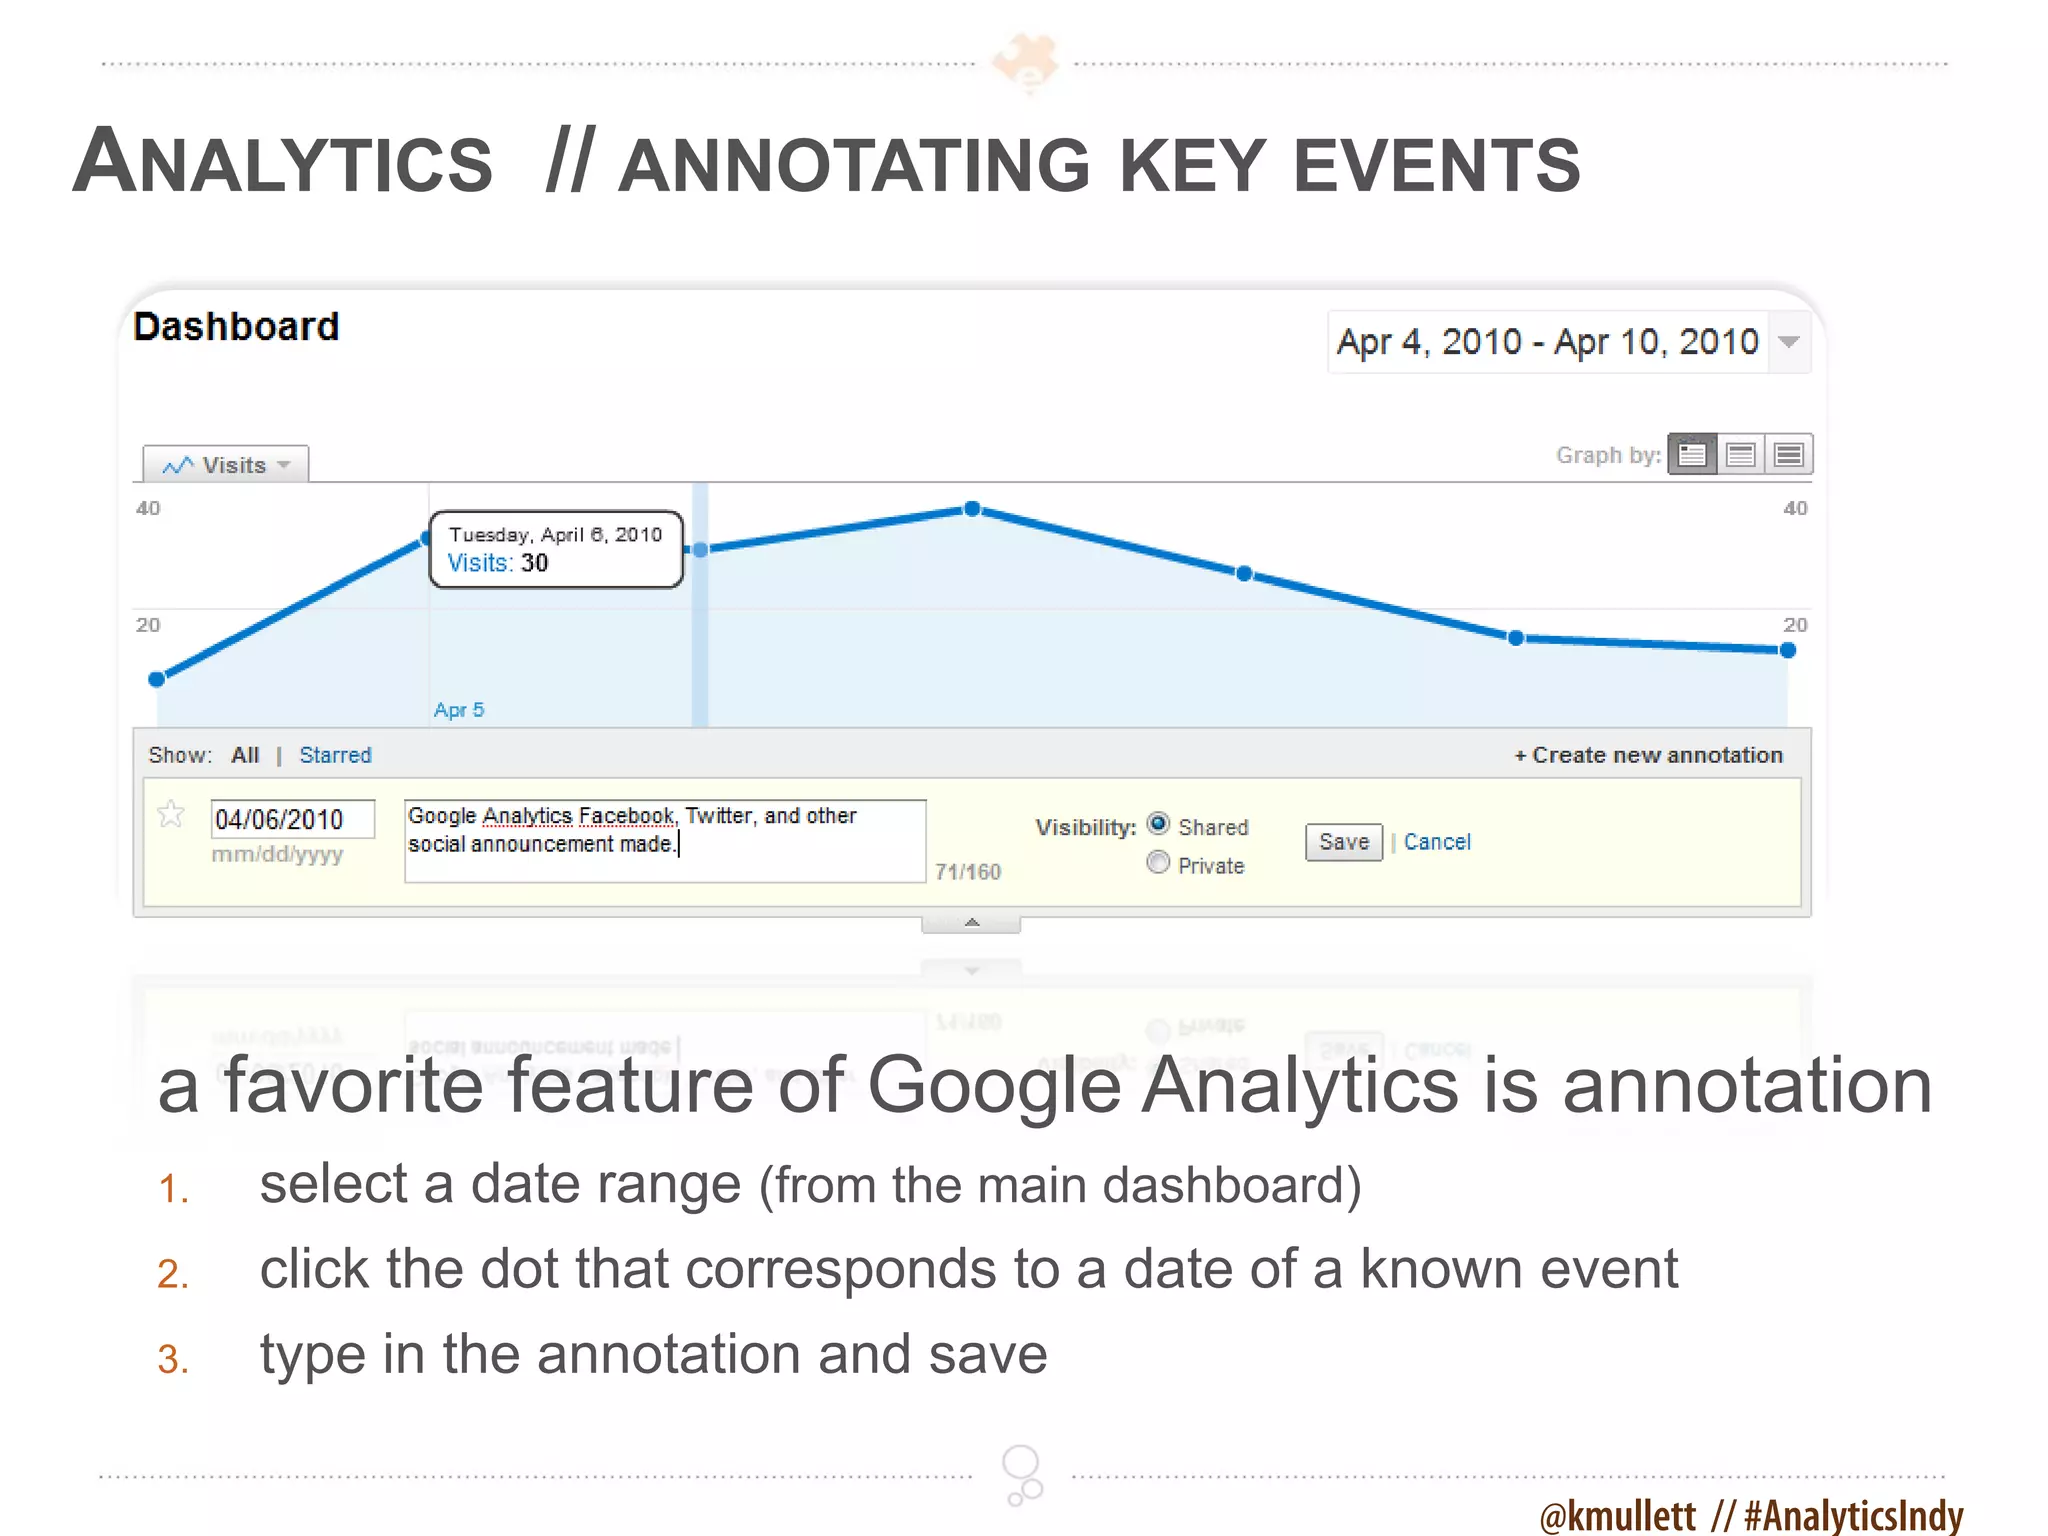
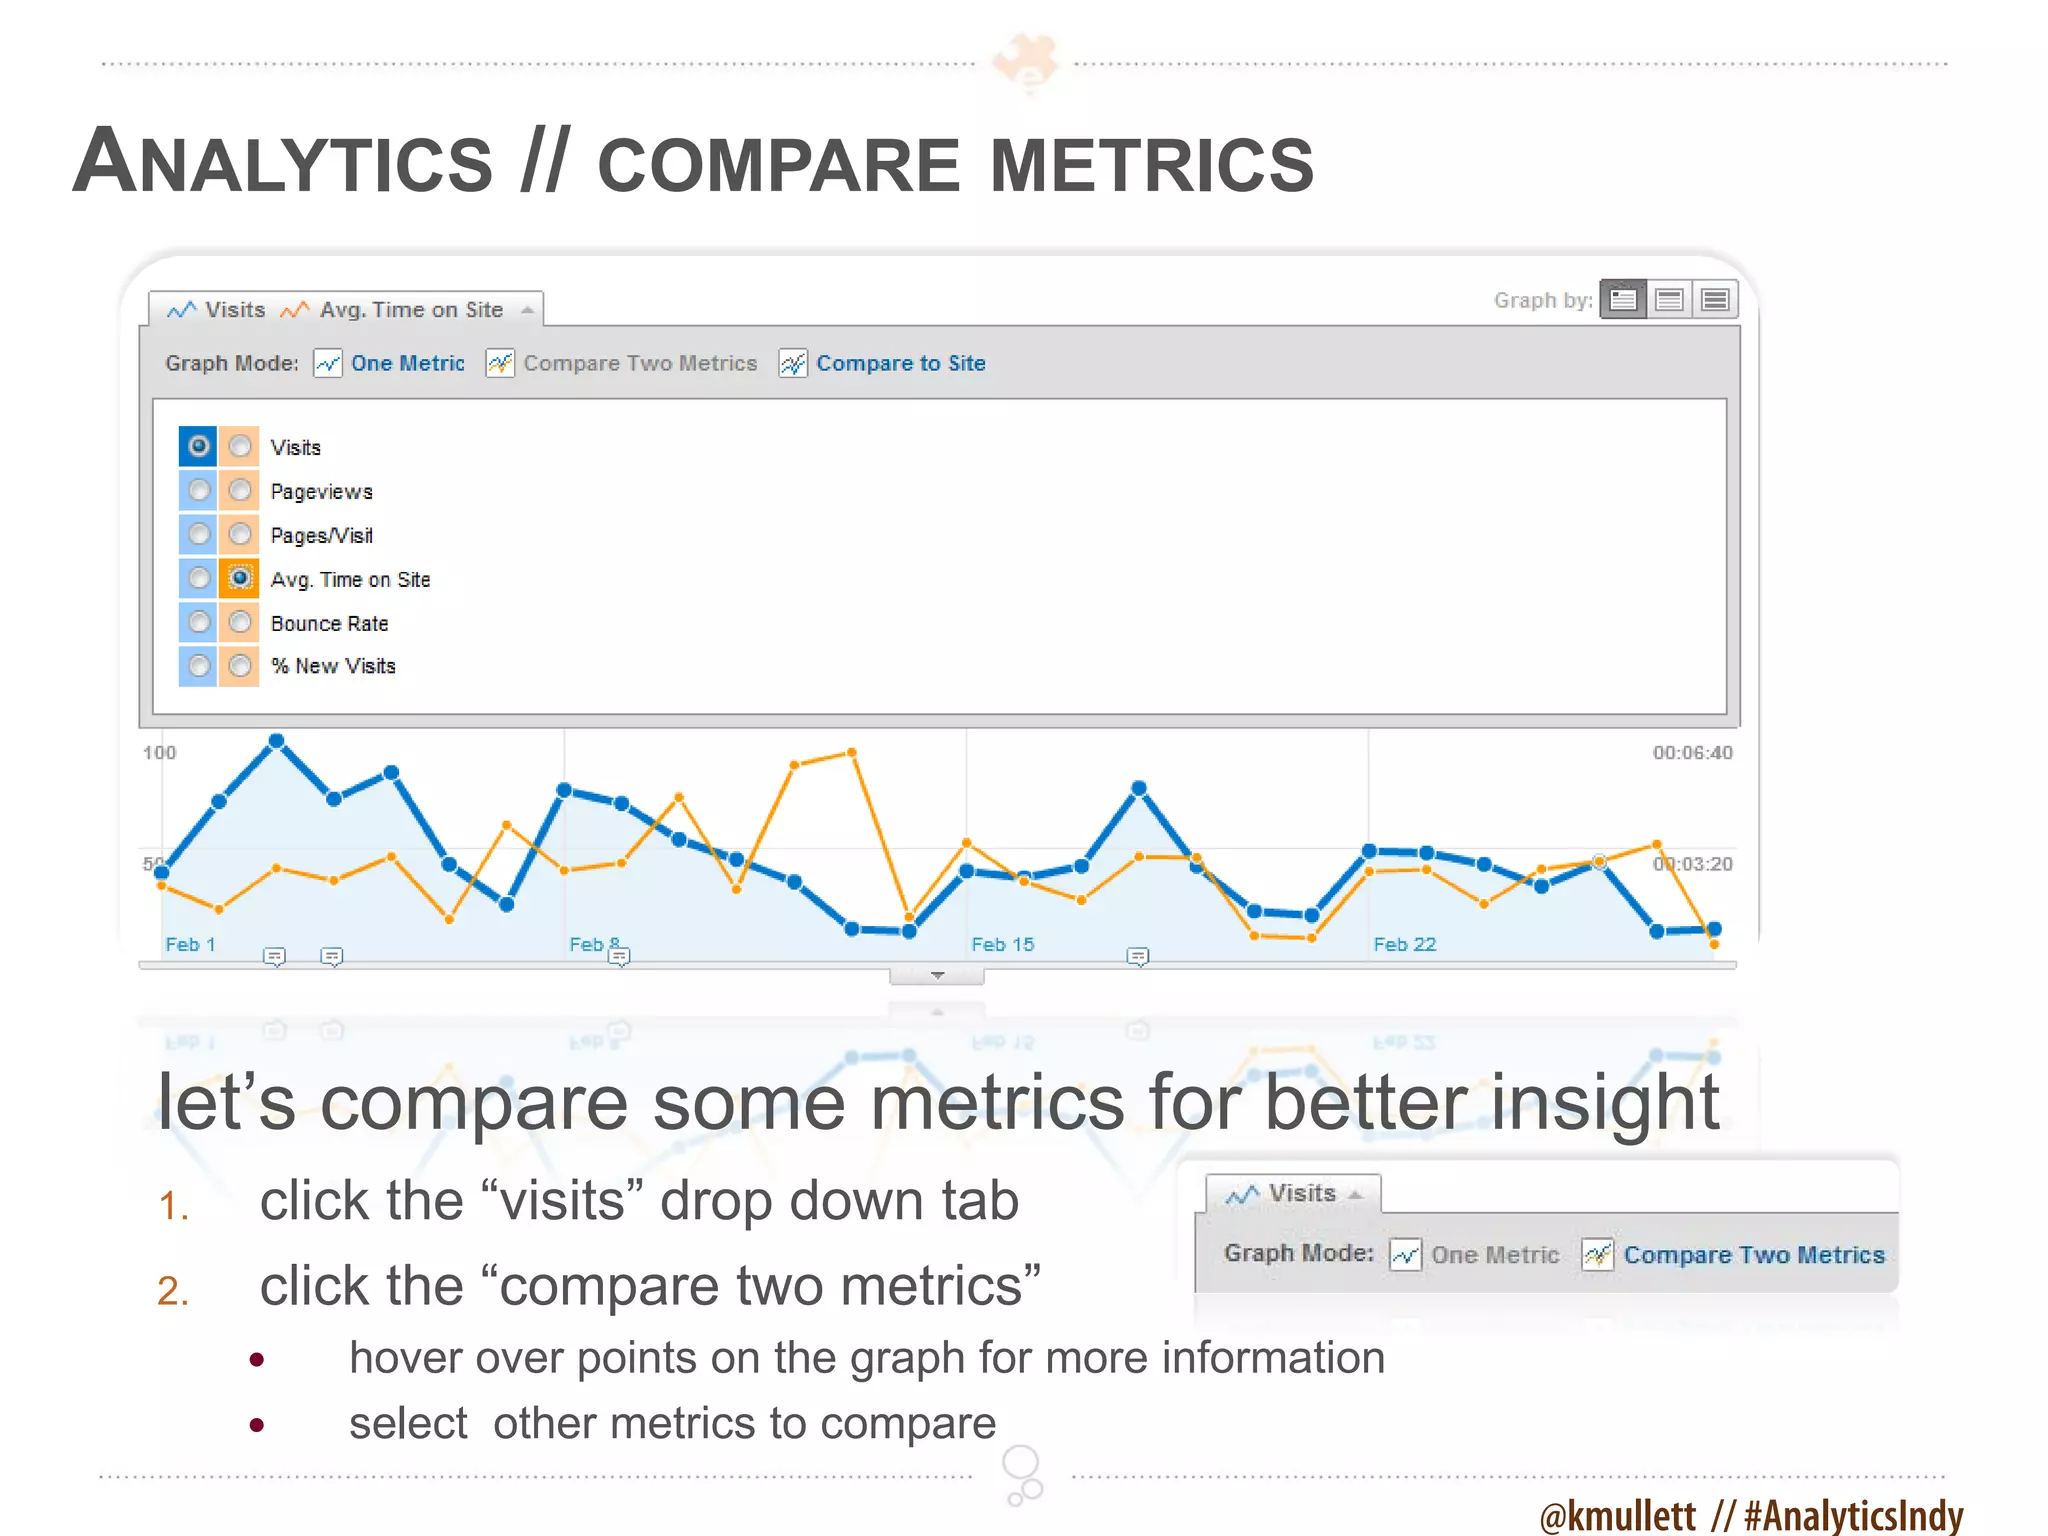
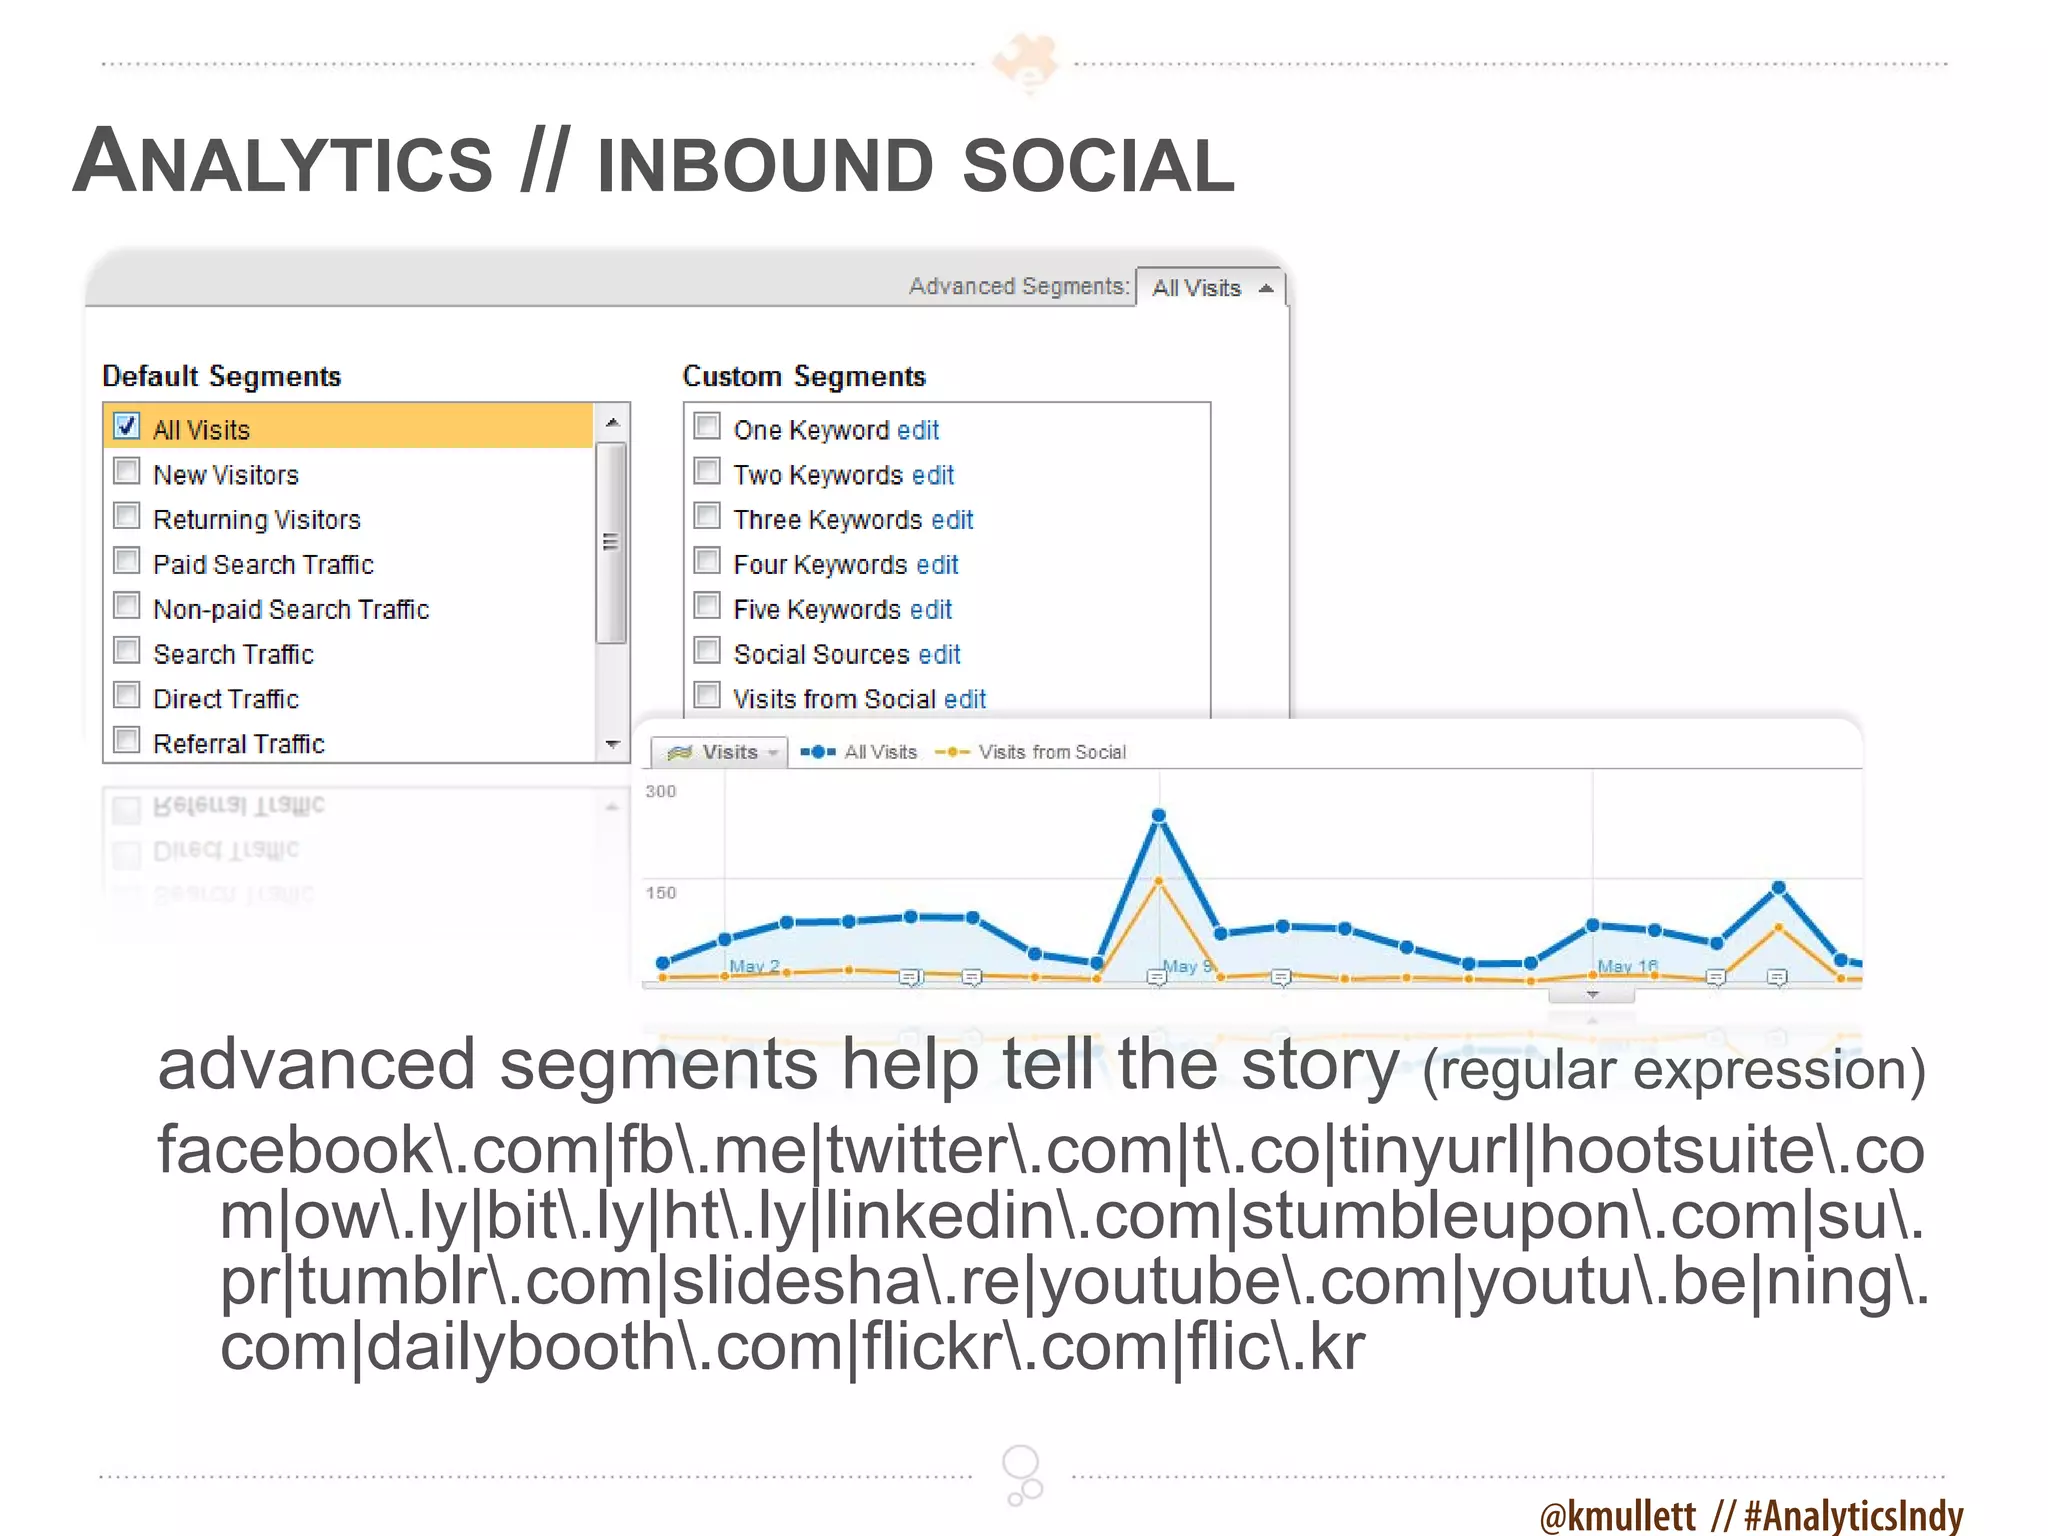
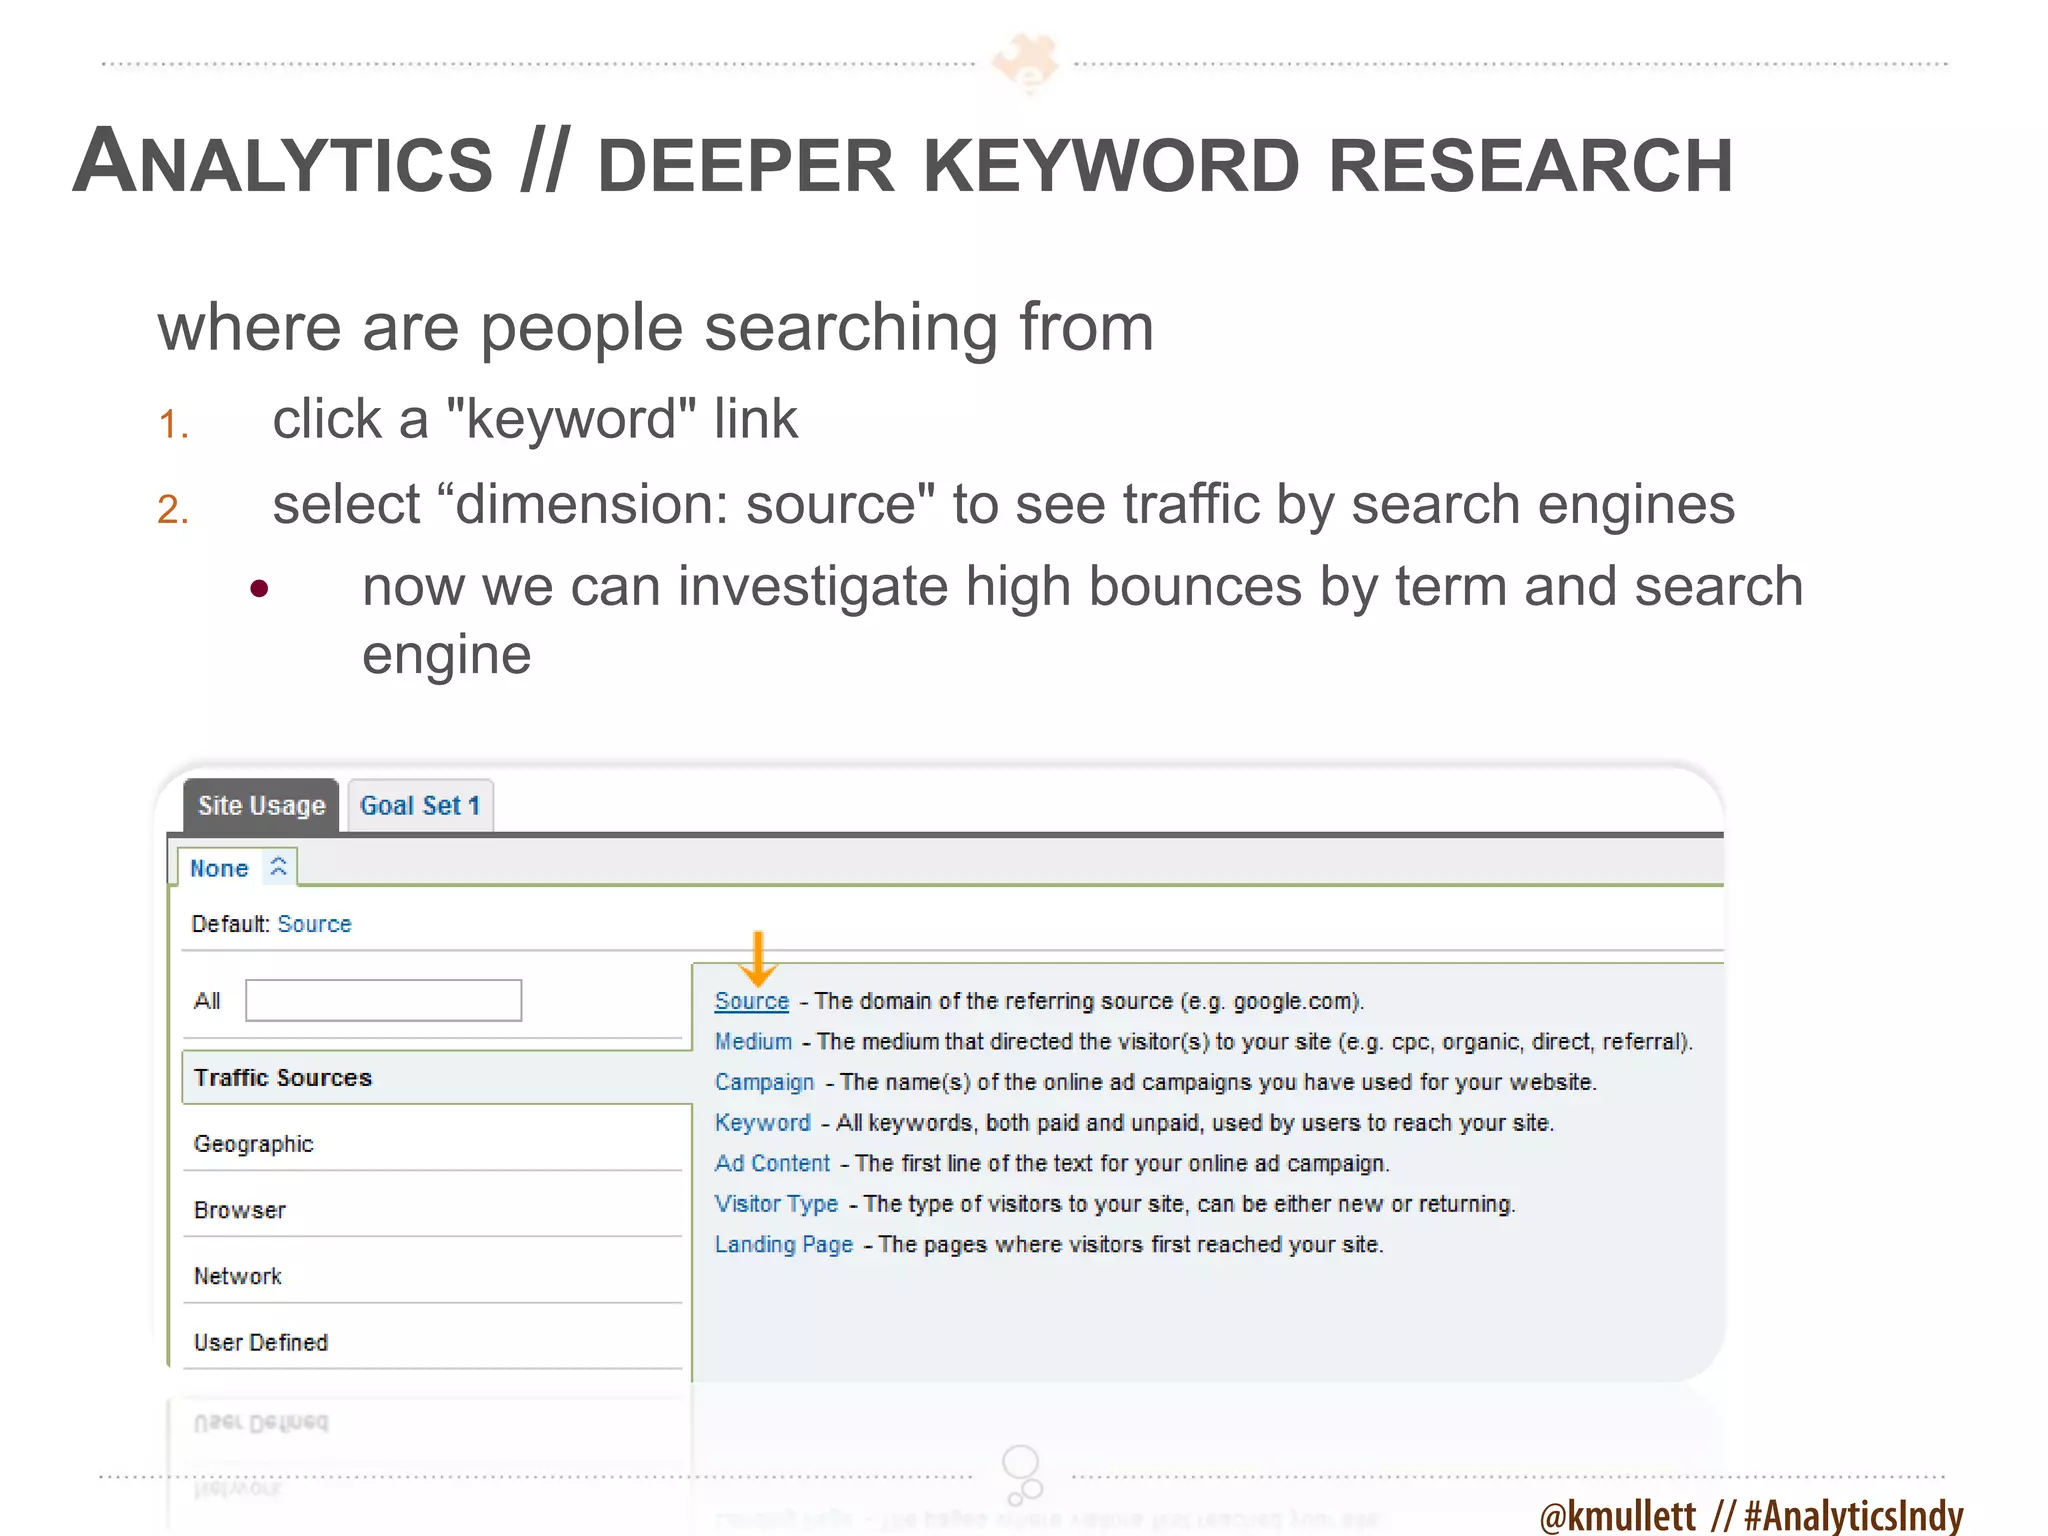
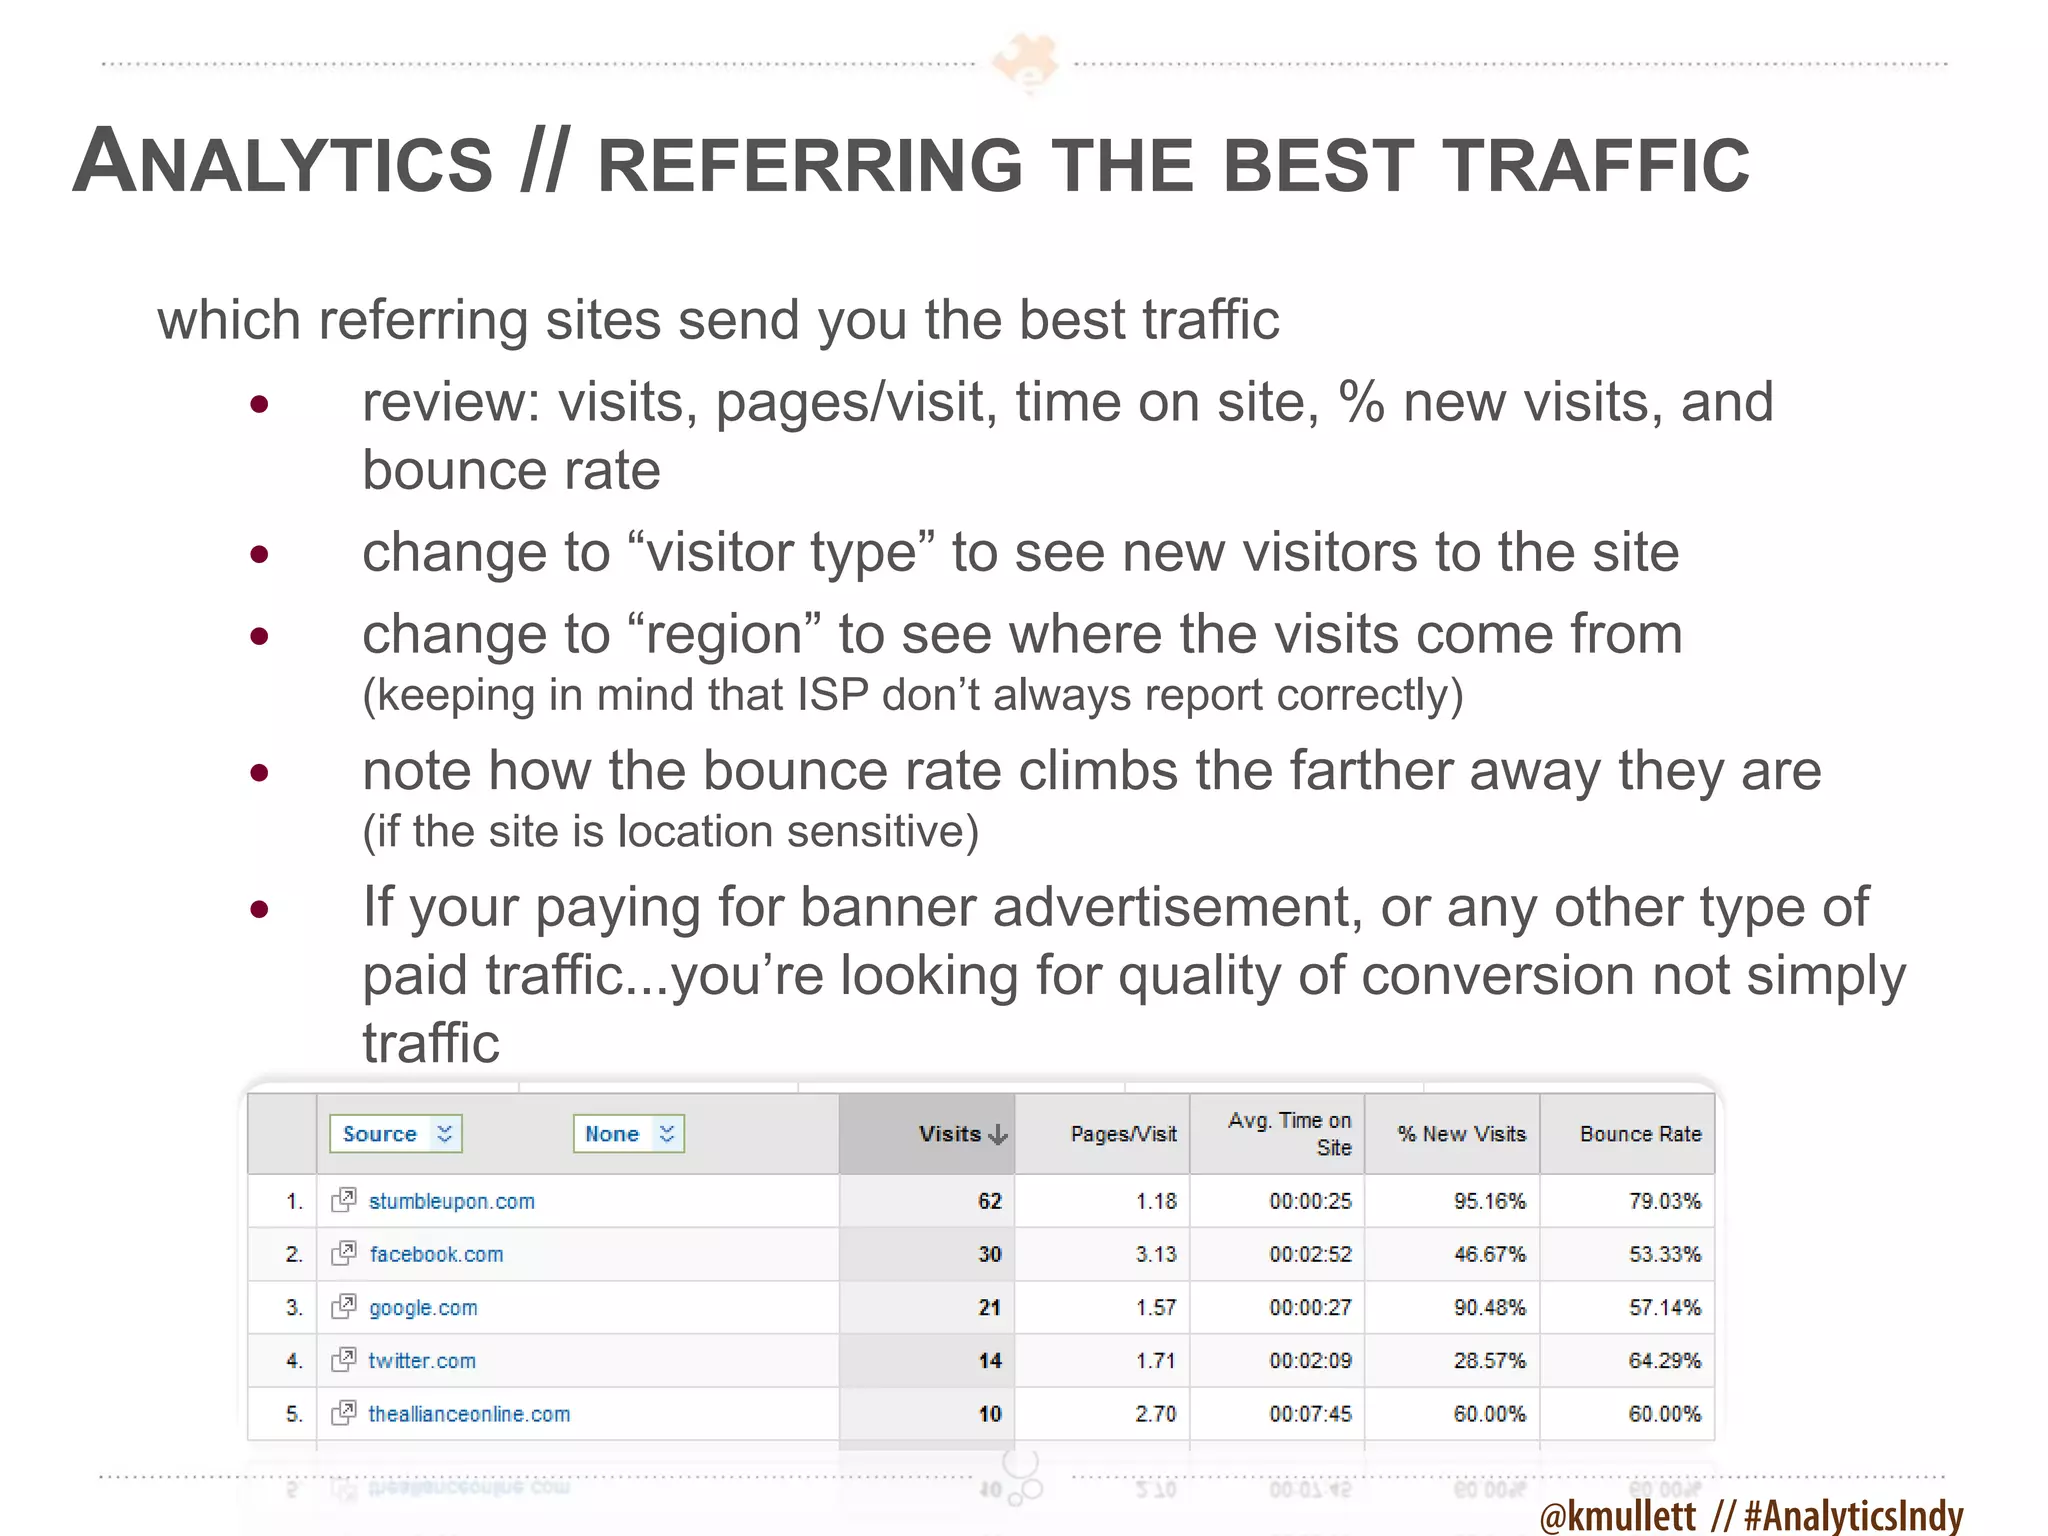
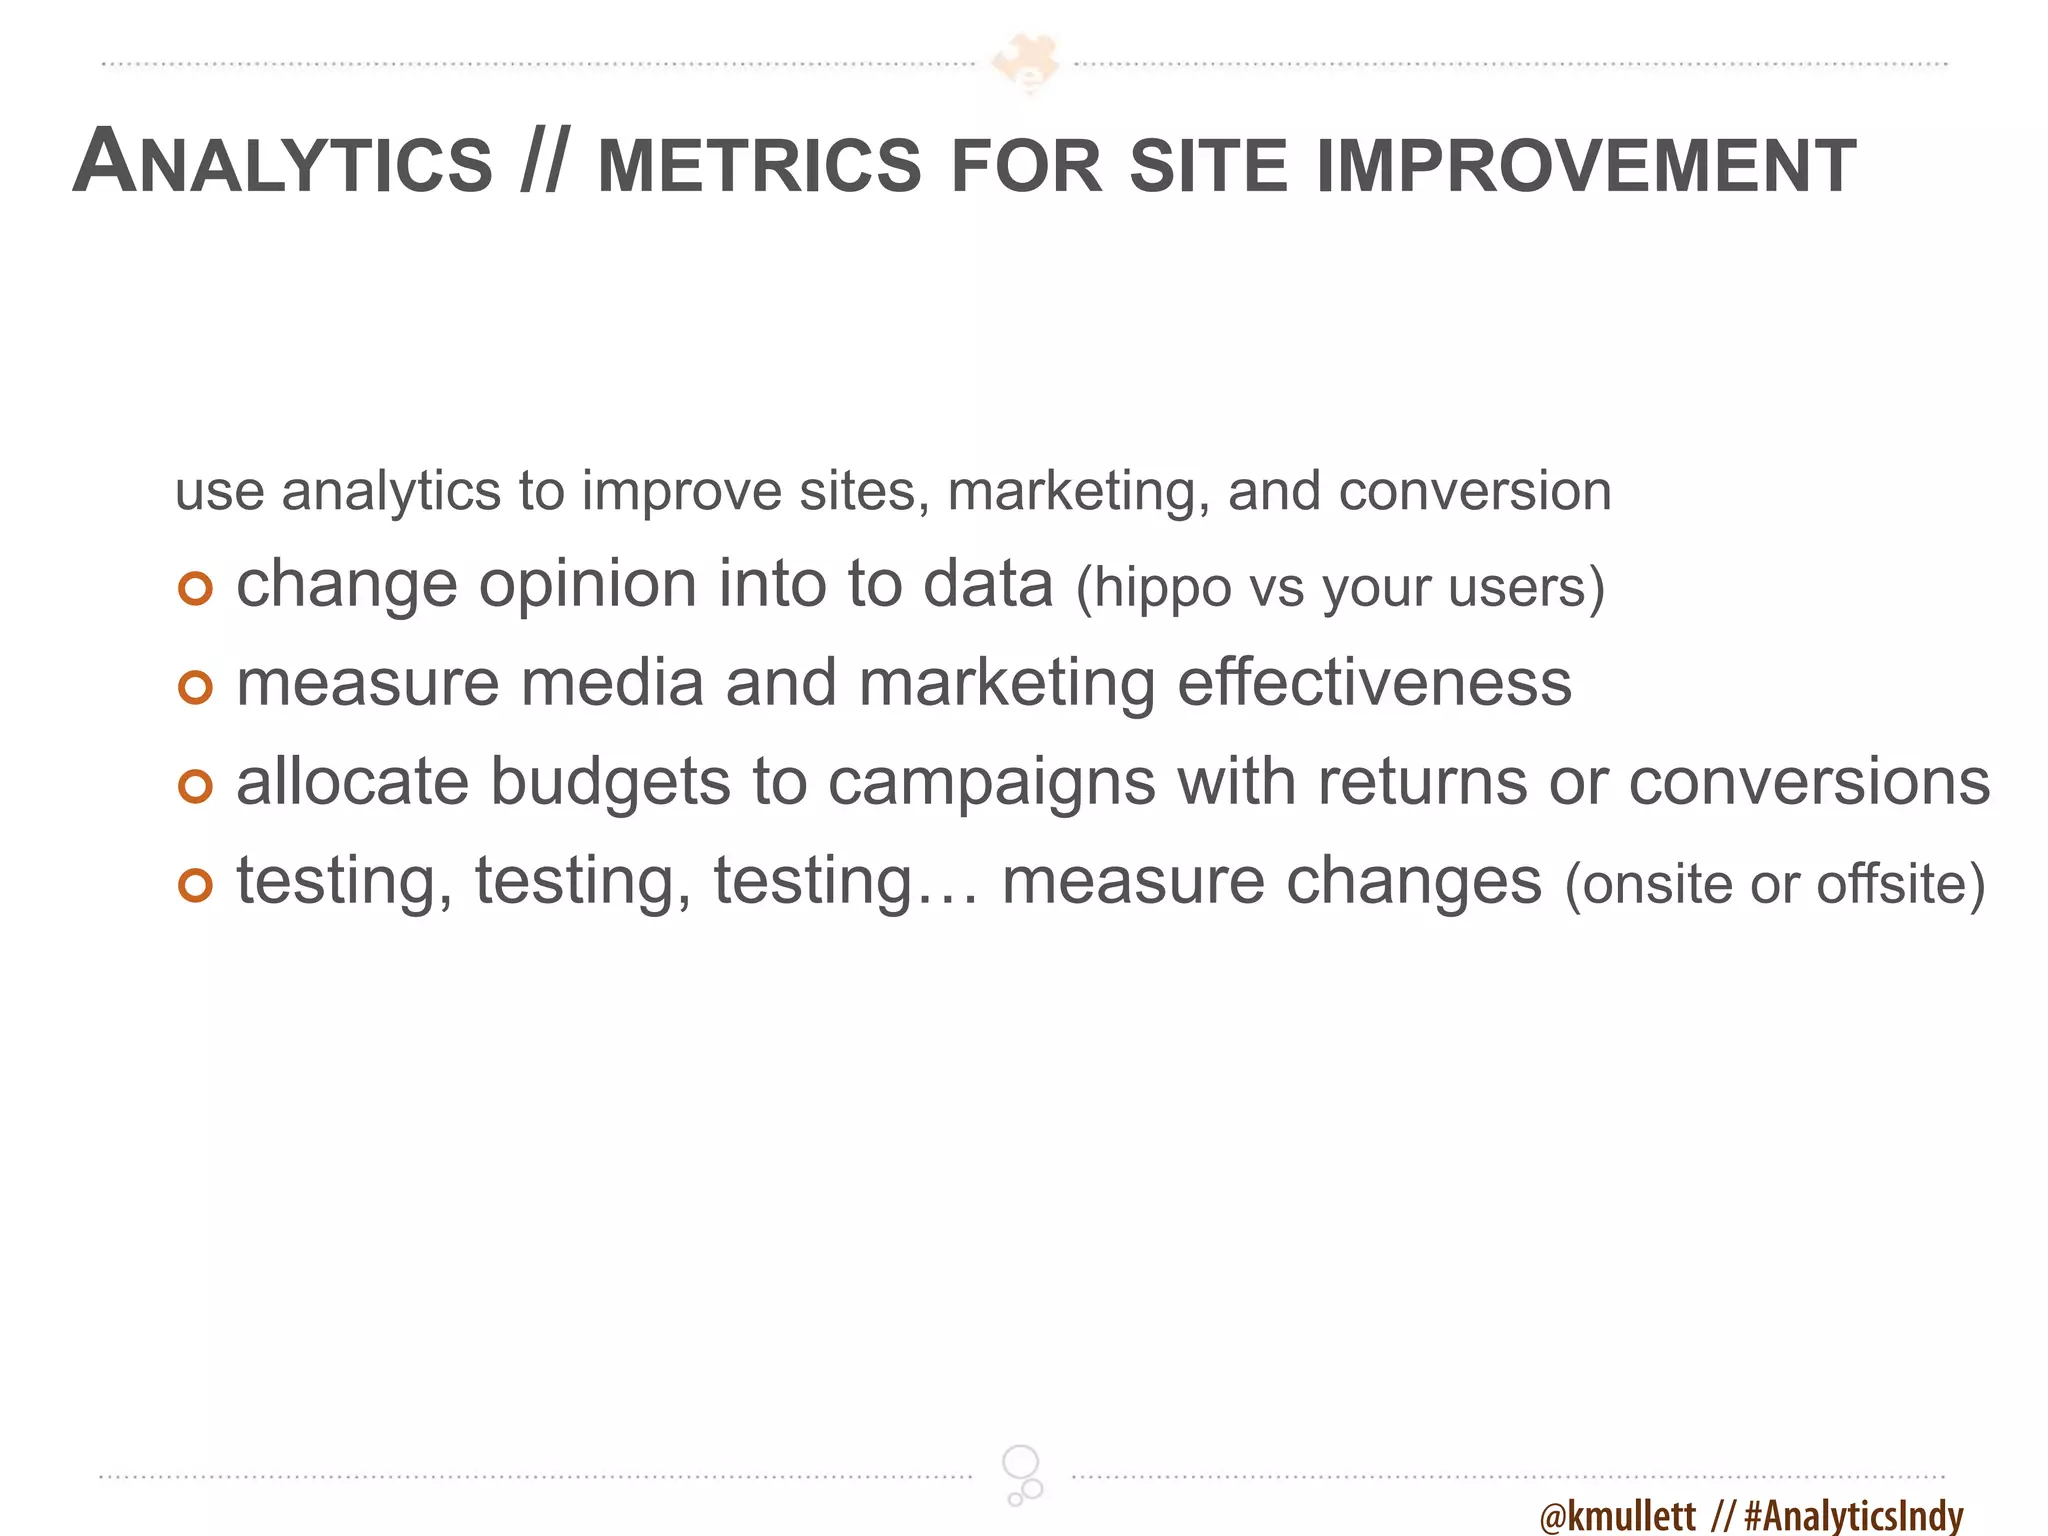
MEASURING THE RIGHT THINGS MATTERS
June 22nd, 2011

Powered by Cirrus ABS and Element Three


                                          DISCOVERELEMENTTHREE.COM & CIRRUSABS.COM
Measuring the Right Things Matters
      Powered by Cirrus ABS and Element Three


                 kevinmullett.com
                 twitter.com/kmullett
                 facebook.com/kevinmullett
                 linkedin.com/in/kevinmullett
                 just google “kevin mullett”
                 director of product development
ANALYTICS // FACING THE REALITY OF ANALYTICS
time + knowledge
 keeping up and interpreting can be a full time job
 tool selection, configuration, interpretation, & reporting

 someone will know more about a specific uses

 goal is to get you thinking critically about marketing
  measurement
 always changing


                                                  @kmullett // #AnalyticsIndy
ANALYTICS // HIPPO HUNTING


 hippo hunting with a bonus expert tag to fill

  turning       opinion into data
 * hippo = highest paid persons opinion


                                                 @kmullett // #AnalyticsIndy
ANALYTICS // DATA TRUMPS OPINION


 Analytics will provide you with powerful data
  (ammo) capable of bringing down the largest
  hippos and experts when opinion starts to creep
  in to a conversation.


                                       @kmullett // #AnalyticsIndy
ANALYTICS // WHY ANALYTICS MATTER?


    what’s really working?
     SEO
     social media

     offline methods

     other

                                 @kmullett // #AnalyticsIndy
ANALYTICS // ARE WE CONNECTING THE DOTS?


   we need to know…

    whichmarketing methods, promotions, social
     channels, and advertising work
    where to allocate marketing dollars based on
     ROI
    where do visitors really come from
         offline and online tracking of marketing
                                                     @kmullett // #AnalyticsIndy
ANALYTICS // WHAT CAN ANALYTICS CAN TELL US?
what might not be working?

 human  traffic/visitors
 search bots/spiders

 general performance and platform information


                                       @kmullett // #AnalyticsIndy
ANALYTICS // ARE THERE ISSUES?
how is the performance of…

 keyword   phrases we are found for
 our audience message (demographics)

 social activity changes, message, growth

 our site (browsers, resolution, platforms)

 pages and specifically calls to action
  - does the copy, call to actions, or imagery need changed
 over all site issues (errors, bounce rate)


                                               @kmullett // #AnalyticsIndy
ANALYTICS // HOW GRANULAR ?


 trends, cause, effect, abnormalities…did it work?
                                        @kmullett // #AnalyticsIndy
ANALYTICS // THE DIFFERENT CHOICES

    server level statistics (by host; AW Stats, WebTrends, Urchin)
    CMS (specific to each content management system)
    third party (external to site services; Google Analytics,
     Chartbeat, Clicky, Woopra, crazyegg)


                                                      @kmullett // #AnalyticsIndy
ANALYTICS // PLENTY OF OTHERS
    aggregators (stats from multiple sources and services; postrank)
    niche’ (measure specific services, like social networks, or metrics;
     ClickTale, Facebook Insights, Buzz-Charts, Twitalyzer)


                                                            @kmullett // #AnalyticsIndy
ANALYTICS // NO GOOD IF NEVER SEEN


 The best analytics package won't help if never
  reviewed, deciphered, and acted upon. Set up
  automated reports or schedule reminders.


                                       @kmullett // #AnalyticsIndy
ANALYTICS // POSTRANK SITES + SOCIAL


 data from site/blog is matched with social channel
  engagement points (acquired by google)

                                         @kmullett // #AnalyticsIndy
ANALYTICS // TRACK YOUR LINKS


 setup a bit.ly URL shortener account
 (i know of over 30 other url-shorteners, but bit.ly is trusted
    & widely used)
                                                   @kmullett // #AnalyticsIndy
ANALYTICS // TRACK CONTENT SHARES


 are those sharing buttons working?

  what   caused the most shares
  did it bring any traffic back


                                      @kmullett // #AnalyticsIndy
ANALYTICS // TRACK EMAIL CAMPAIGNS


 how is the quality of this email list?

  open      rates and click through


                                          @kmullett // #AnalyticsIndy
ANALYTICS // SO WHY GOOGLE ANALYTICS?

               in 2005 Google purchases Urchin
                  Urchin was a top player in analytics
                  simpler interface than most server analytics
                  ties in with AdWords for campaign tracking
                  it is free
                  Google is taking over the world


                                              @kmullett // #AnalyticsIndy
ANALYTICS // WHY WOULD CIRRUS ABS CARE?
 Cirrus ABS needed a vehicle for proving
 the value of our process and solutions and
 how they differed from others
 • online marketing on the rise, traditional marketing
   declining
 • importance of search engine optimization
   traffic/visibility
 • visitor centric sites with paths to conversion


                                                @kmullett // #AnalyticsIndy
ANALYTICS // BUT THE NUMBERS DON’T MATCH


 each software developer decides what metrics
  should be included and the criteria that make
  them up

                                       @kmullett // #AnalyticsIndy
ANALYTICS // CUSTOMIZING YOUR DASHBOARD


 get the information you need quickly
 1.   browse to the report you want to add
 2.   select the “add to dashboard” button
 3.   select the “view dashboard” link
 4.   repeat for other reports you would like to add
                                                 @kmullett // #AnalyticsIndy
ANALYTICS // REPORTS TO SHARE OR KEEP

 exporting one time reports
 1.   navigate to the report you want to create
      example: “content” > “top content”
 2.   select the “export” drop down tab
 3.   select the appropriate format
         PDF (vector output for quality visual reference, ease of sharing)
         XML (extensible markup language)
         CSV (comma separated value, Excel)
         TSV (tabbed separated value, Excel)
 4.   save (different per browser)


                                                                      @kmullett // #AnalyticsIndy
ANALYTICS // SCHEDULED ATTENTION
 now let’s create an automated report
 1.   navigate to the report you want to create
         example: “content” » “top content”
 2.   click the “email” button
 3.   click the “schedule” tab
 4.   input emails and/or check “send to me”
 5.   fill in the remaining fields
 6.   select the desired format
 7.   select daily, weekly, monthly, quarterly
 8.   optionally select to include
      a “date comparison”
 9.   click “schedule”


                                                  @kmullett // #AnalyticsIndy
ANALYTICS // DOOMED TO REPEAT THE PAST?

 comparing a specified date range to the past
 1.   select a month (from the main dashboard)
 2.   check “compare to past” and select a previous month
 3.   click “apply”


                                                      @kmullett // #AnalyticsIndy
ANALYTICS // ANNOTATING KEY EVENTS


 a favorite feature of Google Analytics is annotation
 1.   select a date range (from the main dashboard)
 2.   click the dot that corresponds to a date of a known event
 3.   type in the annotation and save

                                                         @kmullett // #AnalyticsIndy
ANALYTICS // COMPARE METRICS


 let’s compare some metrics for better insight
 1.   click the “visits” drop down tab
 2.   click the “compare two metrics”
         hover over points on the graph for more information
         select other metrics to compare

                                                                @kmullett // #AnalyticsIndy
ANALYTICS // INBOUND SOCIAL


 advanced segments help tell the story (regular expression)
 facebook.com|fb.me|twitter.com|t.co|tinyurl|hootsuite.co
   m|ow.ly|bit.ly|ht.ly|linkedin.com|stumbleupon.com|su.
   pr|tumblr.com|slidesha.re|youtube.com|youtu.be|ning.
   com|dailybooth.com|flickr.com|flic.kr

                                                @kmullett // #AnalyticsIndy
ANALYTICS // BOUNCE RATES DEFINED
 what is a bounce rate?
    landed on and left from a given page (any page) on your site
    allowed their session to timeout (GA’s session timeout is 30
     minutes)
      upon returning from eating lunch a new session would start and the
        previous one would be counted as a bounce
      a lost internet connection may count as a new session when restored
        in some situations
    back button used to leave the site
    typed a new address into the address bar to leave
    closed the browser window or tab
    no further, currently defined, action took place
        they might have called but unless you have a special phone
         number…


                                                           @kmullett // #AnalyticsIndy
ANALYTICS // WHY IS BOUNCE IMPORTANT?
 bounce as an indicator
    possible inadequate paths to action (next steps)
        if they make it to “contact us” do they end up on “thank you”
    shows lost conversions or missed client acquisitions
        does the landing page match the marketing offer
    spotlights visit quality and page relevancy to visitors
        wasted efforts attracting visitors for the wrong keyword phrases


                                                           @kmullett // #AnalyticsIndy
ANALYTICS // EXCEPTIONS TO BOUNCE RULE
 certain sites/visits are likely to have higher bounce
   rates
    blogs and news, where the visitor is looking at a specific article
    informational searches (as opposed to navigational or transactional)
        follow a search result for specific information
    sites with timely information on the homepage
        event calendars and clubs

 according to Avinash Kaushik, a respected GA’s expert, an
   average
 bounce rate is 40-60%. “It is really had to get a bounce rate under 20%,
   anything
 over 35% is cause for concern, 50% (above) is worrying.” Avinash Kaushik


                                                              @kmullett // #AnalyticsIndy
ANALYTICS // TARGETED KEYWORD OR NOT?
 let's see a keyword example for a given metric
 1.   click “traffic sources" in the left nav
 2.   select “keywords"
 3.   select "non-paid”


 reasons for high keyword bounce rate
    incorrect keyword target for your site
    the landing page doesn’t fit the visitors needs
    unclear SEFurl's, meta descriptions, or page titles
    found exactly what they needed and required no further
     action
                                              @kmullett // #AnalyticsIndy
ANALYTICS // DEEPER KEYWORD RESEARCH
 where are people searching from
 1.    click a "keyword" link
 2.     select “dimension: source" to see traffic by search engines
           now we can investigate high bounces by term and search
            engine


                                                        @kmullett // #AnalyticsIndy
ANALYTICS // MONITORING ON-SITE SEARCH
 site search setup information
     if you have a search box on your site
     must know the parameters of each type
     edit via the Google Analytics profile

 tracking how visitors search on your site
 1.   click “content” > “site search” in the left nav
 2.   click “usage” (is it trending up or down after a recent change)
 3.   click “search terms” (what are they looking for)
 4.   click “start pages” (where they get lost most often)


                                                                @kmullett // #AnalyticsIndy
ANALYTICS // CREATING GOALS
 first time goal creation
 1.   click “goals" in the left nav
 2.   select “set up goals and funnels"
 3.   select “add goal”
 4.   name the goal “contact us”
 5.   select the “url destination” radio button
 6.   go to your contact us page and copy
      the url, now paste that url into the “goal url” box
 7.   click “save goal”


 note: additional goals setup from “analytics settings” » “edit” » “+ add
     goal”

                                                            @kmullett // #AnalyticsIndy
ANALYTICS // VISUALIZING GOALS


              adding a funnel to the goal
              1.   click “yes, create a funnel for this goal”
              2.   enter the first url and name it
              3.   click “add goal funnel step”
              4.   repeat step 2 and 3 until the funnel is
                   complete

                                                @kmullett // #AnalyticsIndy
ANALYTICS // DEPTH OF VISIT
  how many pages do they visit?
  1.   click “Visitors" in the left nav
  2.   select “Visitor Loyalty"
  3.   select “Depth of Visit”


                                          @kmullett // #AnalyticsIndy
ANALYTICS // BRAND AWARENESS ANYONE?


 comparing new vs returning visitors
 1.   click “Visitors" in the left nav
 2.   select “New vs. Returning“


                                         @kmullett // #AnalyticsIndy
ANALYTICS // TRACKING LOCATION AWARENESS
 how did that awareness campaign work for us?
 1.   click “visitors" from the left navigation
 2.   select “map overlay”
 3.   click the "United States“
 4.   click "Indiana" (on map or words)
 5.   click "Indianapolis” (on map or words)
 6.   make sure your date range matches
      the promo dates


                                                  @kmullett // #AnalyticsIndy
ANALYTICS // TRACKING LOCATION AWARENESS
 awareness campaign by visitor type
        now let’s select “none: visitor type“ this shows us how
         many “new visitors“ our promo provided in this region
      each column gives us a little insight how the promo worked
      monitoring this through the duration of the campaign would show
       when you peak and start to hit diminishing returns
      this could be added to your dashboard, exported to a report, or
       emailed through the duration of the campaign


                                                       @kmullett // #AnalyticsIndy
ANALYTICS // TRACKING LOCATION AWARENESS
 awareness campaign by source
        go back to state level & select “none: source"
      (direct traffic vs SE traffic) was the promo effective for URL awareness
      if a large percentage come from search engines then they had to look for
       you
      if shown as "(direct)", meaning they typed the URL into the browser they
       remembered your domain name from the promo


                                                             @kmullett // #AnalyticsIndy
ANALYTICS // REFERRING THE MOST TRAFFIC
 which referring sites send you the most traffic
 1.   select a date range if desired
 2.   click “traffic sources” in left nav
 3.   click “referring sites”


                                                   @kmullett // #AnalyticsIndy
ANALYTICS // REFERRING THE BEST TRAFFIC
 which referring sites send you the best traffic
        review: visits, pages/visit, time on site, % new visits, and
         bounce rate
        change to “visitor type” to see new visitors to the site
        change to “region” to see where the visits come from
         (keeping in mind that ISP don’t always report correctly)
        note how the bounce rate climbs the farther away they are
         (if the site is location sensitive)
        If your paying for banner advertisement, or any other type of
         paid traffic...you’re looking for quality of conversion not simply
         traffic


                                                                    @kmullett // #AnalyticsIndy
ANALYTICS // WE NEED EVIDENCE


 More than a desire to be right, we want to do right.
  That requires evidence. We can change opinions
  if we have good data.


                                         @kmullett // #AnalyticsIndy
ANALYTICS // METRICS FOR SITE IMPROVEMENT


  use analytics to improve sites, marketing, and conversion
   change opinion into to data (hippo vs your users)
   measure media and marketing effectiveness

   allocate budgets to campaigns with returns or conversions

   testing, testing, testing… measure changes (onsite or offsite)


                                                        @kmullett // #AnalyticsIndy
2 DAY CONFERENCE
HTTP://WWW.BLOGINDIANA.COM/2011


       Powered by Cirrus ABS and Element Three


                                                 1.877.817.4442

Google Analytics: Measurement Matters

  • 1.
    MEASURING THE RIGHTTHINGS MATTERS June 22nd, 2011 Powered by Cirrus ABS and Element Three DISCOVERELEMENTTHREE.COM & CIRRUSABS.COM
  • 2.
    Measuring the RightThings Matters Powered by Cirrus ABS and Element Three kevinmullett.com twitter.com/kmullett facebook.com/kevinmullett linkedin.com/in/kevinmullett just google “kevin mullett” director of product development
  • 3.
    ANALYTICS // FACINGTHE REALITY OF ANALYTICS time + knowledge  keeping up and interpreting can be a full time job  tool selection, configuration, interpretation, & reporting  someone will know more about a specific uses  goal is to get you thinking critically about marketing measurement  always changing @kmullett // #AnalyticsIndy
  • 4.
    ANALYTICS // HIPPOHUNTING hippo hunting with a bonus expert tag to fill  turning opinion into data * hippo = highest paid persons opinion @kmullett // #AnalyticsIndy
  • 5.
    ANALYTICS // DATATRUMPS OPINION Analytics will provide you with powerful data (ammo) capable of bringing down the largest hippos and experts when opinion starts to creep in to a conversation. @kmullett // #AnalyticsIndy
  • 6.
    ANALYTICS // WHYANALYTICS MATTER? what’s really working?  SEO  social media  offline methods  other @kmullett // #AnalyticsIndy
  • 7.
    ANALYTICS // AREWE CONNECTING THE DOTS? we need to know…  whichmarketing methods, promotions, social channels, and advertising work  where to allocate marketing dollars based on ROI  where do visitors really come from  offline and online tracking of marketing @kmullett // #AnalyticsIndy
  • 8.
    ANALYTICS // WHATCAN ANALYTICS CAN TELL US? what might not be working?  human traffic/visitors  search bots/spiders  general performance and platform information @kmullett // #AnalyticsIndy
  • 9.
    ANALYTICS // ARETHERE ISSUES? how is the performance of…  keyword phrases we are found for  our audience message (demographics)  social activity changes, message, growth  our site (browsers, resolution, platforms)  pages and specifically calls to action - does the copy, call to actions, or imagery need changed  over all site issues (errors, bounce rate) @kmullett // #AnalyticsIndy
  • 10.
    ANALYTICS // HOWGRANULAR ? trends, cause, effect, abnormalities…did it work? @kmullett // #AnalyticsIndy
  • 11.
    ANALYTICS // THEDIFFERENT CHOICES  server level statistics (by host; AW Stats, WebTrends, Urchin)  CMS (specific to each content management system)  third party (external to site services; Google Analytics, Chartbeat, Clicky, Woopra, crazyegg) @kmullett // #AnalyticsIndy
  • 12.
    ANALYTICS // PLENTYOF OTHERS  aggregators (stats from multiple sources and services; postrank)  niche’ (measure specific services, like social networks, or metrics; ClickTale, Facebook Insights, Buzz-Charts, Twitalyzer) @kmullett // #AnalyticsIndy
  • 13.
    ANALYTICS // NOGOOD IF NEVER SEEN The best analytics package won't help if never reviewed, deciphered, and acted upon. Set up automated reports or schedule reminders. @kmullett // #AnalyticsIndy
  • 14.
    ANALYTICS // POSTRANKSITES + SOCIAL data from site/blog is matched with social channel engagement points (acquired by google) @kmullett // #AnalyticsIndy
  • 15.
    ANALYTICS // TRACKYOUR LINKS setup a bit.ly URL shortener account (i know of over 30 other url-shorteners, but bit.ly is trusted & widely used) @kmullett // #AnalyticsIndy
  • 16.
    ANALYTICS // TRACKCONTENT SHARES are those sharing buttons working?  what caused the most shares  did it bring any traffic back @kmullett // #AnalyticsIndy
  • 17.
    ANALYTICS // TRACKEMAIL CAMPAIGNS how is the quality of this email list?  open rates and click through @kmullett // #AnalyticsIndy
  • 18.
    ANALYTICS // SOWHY GOOGLE ANALYTICS? in 2005 Google purchases Urchin  Urchin was a top player in analytics  simpler interface than most server analytics  ties in with AdWords for campaign tracking  it is free  Google is taking over the world @kmullett // #AnalyticsIndy
  • 19.
    ANALYTICS // WHYWOULD CIRRUS ABS CARE? Cirrus ABS needed a vehicle for proving the value of our process and solutions and how they differed from others • online marketing on the rise, traditional marketing declining • importance of search engine optimization traffic/visibility • visitor centric sites with paths to conversion @kmullett // #AnalyticsIndy
  • 20.
    ANALYTICS // BUTTHE NUMBERS DON’T MATCH each software developer decides what metrics should be included and the criteria that make them up @kmullett // #AnalyticsIndy
  • 21.
    ANALYTICS // CUSTOMIZINGYOUR DASHBOARD get the information you need quickly 1. browse to the report you want to add 2. select the “add to dashboard” button 3. select the “view dashboard” link 4. repeat for other reports you would like to add @kmullett // #AnalyticsIndy
  • 22.
    ANALYTICS // REPORTSTO SHARE OR KEEP exporting one time reports 1. navigate to the report you want to create example: “content” > “top content” 2. select the “export” drop down tab 3. select the appropriate format  PDF (vector output for quality visual reference, ease of sharing)  XML (extensible markup language)  CSV (comma separated value, Excel)  TSV (tabbed separated value, Excel) 4. save (different per browser) @kmullett // #AnalyticsIndy
  • 23.
    ANALYTICS // SCHEDULEDATTENTION now let’s create an automated report 1. navigate to the report you want to create  example: “content” » “top content” 2. click the “email” button 3. click the “schedule” tab 4. input emails and/or check “send to me” 5. fill in the remaining fields 6. select the desired format 7. select daily, weekly, monthly, quarterly 8. optionally select to include a “date comparison” 9. click “schedule” @kmullett // #AnalyticsIndy
  • 24.
    ANALYTICS // DOOMEDTO REPEAT THE PAST? comparing a specified date range to the past 1. select a month (from the main dashboard) 2. check “compare to past” and select a previous month 3. click “apply” @kmullett // #AnalyticsIndy
  • 25.
    ANALYTICS // ANNOTATINGKEY EVENTS a favorite feature of Google Analytics is annotation 1. select a date range (from the main dashboard) 2. click the dot that corresponds to a date of a known event 3. type in the annotation and save @kmullett // #AnalyticsIndy
  • 26.
    ANALYTICS // COMPAREMETRICS let’s compare some metrics for better insight 1. click the “visits” drop down tab 2. click the “compare two metrics”  hover over points on the graph for more information  select other metrics to compare @kmullett // #AnalyticsIndy
  • 27.
    ANALYTICS // INBOUNDSOCIAL advanced segments help tell the story (regular expression) facebook.com|fb.me|twitter.com|t.co|tinyurl|hootsuite.co m|ow.ly|bit.ly|ht.ly|linkedin.com|stumbleupon.com|su. pr|tumblr.com|slidesha.re|youtube.com|youtu.be|ning. com|dailybooth.com|flickr.com|flic.kr @kmullett // #AnalyticsIndy
  • 28.
    ANALYTICS // BOUNCERATES DEFINED what is a bounce rate?  landed on and left from a given page (any page) on your site  allowed their session to timeout (GA’s session timeout is 30 minutes)  upon returning from eating lunch a new session would start and the previous one would be counted as a bounce  a lost internet connection may count as a new session when restored in some situations  back button used to leave the site  typed a new address into the address bar to leave  closed the browser window or tab  no further, currently defined, action took place  they might have called but unless you have a special phone number… @kmullett // #AnalyticsIndy
  • 29.
    ANALYTICS // WHYIS BOUNCE IMPORTANT? bounce as an indicator  possible inadequate paths to action (next steps)  if they make it to “contact us” do they end up on “thank you”  shows lost conversions or missed client acquisitions  does the landing page match the marketing offer  spotlights visit quality and page relevancy to visitors  wasted efforts attracting visitors for the wrong keyword phrases @kmullett // #AnalyticsIndy
  • 30.
    ANALYTICS // EXCEPTIONSTO BOUNCE RULE certain sites/visits are likely to have higher bounce rates  blogs and news, where the visitor is looking at a specific article  informational searches (as opposed to navigational or transactional)  follow a search result for specific information  sites with timely information on the homepage  event calendars and clubs according to Avinash Kaushik, a respected GA’s expert, an average bounce rate is 40-60%. “It is really had to get a bounce rate under 20%, anything over 35% is cause for concern, 50% (above) is worrying.” Avinash Kaushik @kmullett // #AnalyticsIndy
  • 31.
    ANALYTICS // TARGETEDKEYWORD OR NOT? let's see a keyword example for a given metric 1. click “traffic sources" in the left nav 2. select “keywords" 3. select "non-paid” reasons for high keyword bounce rate  incorrect keyword target for your site  the landing page doesn’t fit the visitors needs  unclear SEFurl's, meta descriptions, or page titles  found exactly what they needed and required no further action @kmullett // #AnalyticsIndy
  • 32.
    ANALYTICS // DEEPERKEYWORD RESEARCH where are people searching from 1. click a "keyword" link 2. select “dimension: source" to see traffic by search engines  now we can investigate high bounces by term and search engine @kmullett // #AnalyticsIndy
  • 33.
    ANALYTICS // MONITORINGON-SITE SEARCH site search setup information  if you have a search box on your site  must know the parameters of each type  edit via the Google Analytics profile tracking how visitors search on your site 1. click “content” > “site search” in the left nav 2. click “usage” (is it trending up or down after a recent change) 3. click “search terms” (what are they looking for) 4. click “start pages” (where they get lost most often) @kmullett // #AnalyticsIndy
  • 34.
    ANALYTICS // CREATINGGOALS first time goal creation 1. click “goals" in the left nav 2. select “set up goals and funnels" 3. select “add goal” 4. name the goal “contact us” 5. select the “url destination” radio button 6. go to your contact us page and copy the url, now paste that url into the “goal url” box 7. click “save goal” note: additional goals setup from “analytics settings” » “edit” » “+ add goal” @kmullett // #AnalyticsIndy
  • 35.
    ANALYTICS // VISUALIZINGGOALS adding a funnel to the goal 1. click “yes, create a funnel for this goal” 2. enter the first url and name it 3. click “add goal funnel step” 4. repeat step 2 and 3 until the funnel is complete @kmullett // #AnalyticsIndy
  • 36.
    ANALYTICS // DEPTHOF VISIT how many pages do they visit? 1. click “Visitors" in the left nav 2. select “Visitor Loyalty" 3. select “Depth of Visit” @kmullett // #AnalyticsIndy
  • 37.
    ANALYTICS // BRANDAWARENESS ANYONE? comparing new vs returning visitors 1. click “Visitors" in the left nav 2. select “New vs. Returning“ @kmullett // #AnalyticsIndy
  • 38.
    ANALYTICS // TRACKINGLOCATION AWARENESS how did that awareness campaign work for us? 1. click “visitors" from the left navigation 2. select “map overlay” 3. click the "United States“ 4. click "Indiana" (on map or words) 5. click "Indianapolis” (on map or words) 6. make sure your date range matches the promo dates @kmullett // #AnalyticsIndy
  • 39.
    ANALYTICS // TRACKINGLOCATION AWARENESS awareness campaign by visitor type  now let’s select “none: visitor type“ this shows us how many “new visitors“ our promo provided in this region  each column gives us a little insight how the promo worked  monitoring this through the duration of the campaign would show when you peak and start to hit diminishing returns  this could be added to your dashboard, exported to a report, or emailed through the duration of the campaign @kmullett // #AnalyticsIndy
  • 40.
    ANALYTICS // TRACKINGLOCATION AWARENESS awareness campaign by source  go back to state level & select “none: source"  (direct traffic vs SE traffic) was the promo effective for URL awareness  if a large percentage come from search engines then they had to look for you  if shown as "(direct)", meaning they typed the URL into the browser they remembered your domain name from the promo @kmullett // #AnalyticsIndy
  • 41.
    ANALYTICS // REFERRINGTHE MOST TRAFFIC which referring sites send you the most traffic 1. select a date range if desired 2. click “traffic sources” in left nav 3. click “referring sites” @kmullett // #AnalyticsIndy
  • 42.
    ANALYTICS // REFERRINGTHE BEST TRAFFIC which referring sites send you the best traffic  review: visits, pages/visit, time on site, % new visits, and bounce rate  change to “visitor type” to see new visitors to the site  change to “region” to see where the visits come from (keeping in mind that ISP don’t always report correctly)  note how the bounce rate climbs the farther away they are (if the site is location sensitive)  If your paying for banner advertisement, or any other type of paid traffic...you’re looking for quality of conversion not simply traffic @kmullett // #AnalyticsIndy
  • 43.
    ANALYTICS // WENEED EVIDENCE More than a desire to be right, we want to do right. That requires evidence. We can change opinions if we have good data. @kmullett // #AnalyticsIndy
  • 44.
    ANALYTICS // METRICSFOR SITE IMPROVEMENT use analytics to improve sites, marketing, and conversion  change opinion into to data (hippo vs your users)  measure media and marketing effectiveness  allocate budgets to campaigns with returns or conversions  testing, testing, testing… measure changes (onsite or offsite) @kmullett // #AnalyticsIndy
  • 45.
    2 DAY CONFERENCE HTTP://WWW.BLOGINDIANA.COM/2011 Powered by Cirrus ABS and Element Three 1.877.817.4442