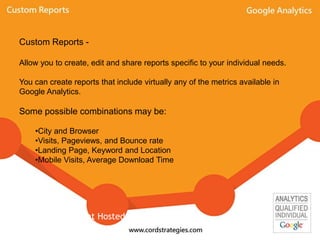
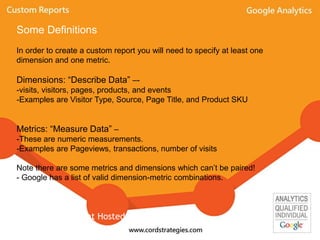
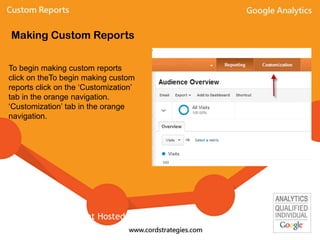
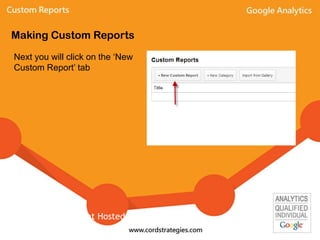
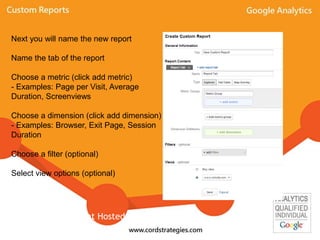
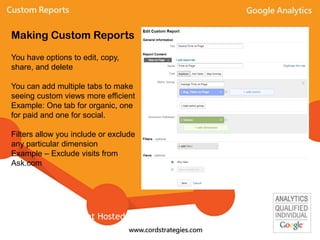
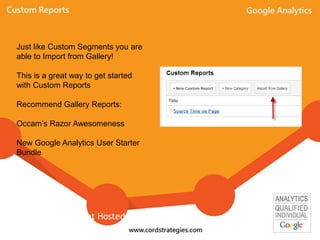
Google Analytics Custom
Reports
By: Errett Cord
Email: ecord@ecord.us
Twitter: @errettcord
Custom Reports -
Allow you to create, edit and share reports specific to your individual needs.
You can create reports that include virtually any of the metrics available in
Google Analytics.
Some possible combinations may be:
•City and Browser
•Visits, Pageviews, and Bounce rate
•Landing Page, Keyword and Location
•Mobile Visits, Average Download Time
Event Hosted By: Local-Ventures
Some Definitions
In order to create a custom report you will need to specify at least one
dimension and one metric.
Dimensions: “Describe Data” –-
-visits, visitors, pages, products, and events
-Examples are Visitor Type, Source, Page Title, and Product SKU
Metrics: “Measure Data” –
-These are numeric measurements.
-Examples are Pageviews, transactions, number of visits
Note there are some metrics and dimensions which can’t be paired!
- Google has a list of valid dimension-metric combinations.
Event Hosted By: Local-Ventures
To begin making custom reports
click on theTo begin making custom
reports click on the ‘Customization’
tab in the orange navigation.
‘Customization’ tab in the orange
navigation.
Making Custom Reports
Event Hosted By: Local-Ventures
Making Custom Reports
Next you will click on the ‘New
Custom Report’ tab
Event Hosted By: Local-Ventures
Next you will name the new report
Name the tab of the report
Choose a metric (click add metric)
- Examples: Page per Visit, Average
Duration, Screenviews
Choose a dimension (click add dimension)
- Examples: Browser, Exit Page, Session
Duration
Choose a filter (optional)
Select view options (optional)
Event Hosted By: Local-Ventures
You have options to edit, copy,
share, and delete
You can add multiple tabs to make
seeing custom views more efficient
Example: One tab for organic, one
for paid and one for social.
Filters allow you include or exclude
any particular dimension
Example – Exclude visits from
Ask.com
Making Custom Reports
Event Hosted By: Local-Ventures
Just like Custom Segments you are
able to Import from Gallery!
This is a great way to get started
with Custom Reports
Recommend Gallery Reports:
Occam’s Razor Awesomeness
New Google Analytics User Starter
Bundle
Event Hosted By: Local-Ventures
To get familiar with creating custom reports and advanced segments first import
some from the gallery then click edit to see how they were set up.
Then add any new dimensions and metrics you like!
You can always delete custom reports and advanced segments and start over!
Making Custom Reports
Event Hosted By: Local-Ventures

Google Analytics Custom Reports

  • 1.
    Google Analytics Custom Reports By:Errett Cord Email: ecord@ecord.us Twitter: @errettcord
  • 2.
    Custom Reports - Allowyou to create, edit and share reports specific to your individual needs. You can create reports that include virtually any of the metrics available in Google Analytics. Some possible combinations may be: •City and Browser •Visits, Pageviews, and Bounce rate •Landing Page, Keyword and Location •Mobile Visits, Average Download Time Event Hosted By: Local-Ventures
  • 3.
    Some Definitions In orderto create a custom report you will need to specify at least one dimension and one metric. Dimensions: “Describe Data” –- -visits, visitors, pages, products, and events -Examples are Visitor Type, Source, Page Title, and Product SKU Metrics: “Measure Data” – -These are numeric measurements. -Examples are Pageviews, transactions, number of visits Note there are some metrics and dimensions which can’t be paired! - Google has a list of valid dimension-metric combinations. Event Hosted By: Local-Ventures
  • 4.
    To begin makingcustom reports click on theTo begin making custom reports click on the ‘Customization’ tab in the orange navigation. ‘Customization’ tab in the orange navigation. Making Custom Reports Event Hosted By: Local-Ventures
  • 5.
    Making Custom Reports Nextyou will click on the ‘New Custom Report’ tab Event Hosted By: Local-Ventures
  • 6.
    Next you willname the new report Name the tab of the report Choose a metric (click add metric) - Examples: Page per Visit, Average Duration, Screenviews Choose a dimension (click add dimension) - Examples: Browser, Exit Page, Session Duration Choose a filter (optional) Select view options (optional) Event Hosted By: Local-Ventures
  • 7.
    You have optionsto edit, copy, share, and delete You can add multiple tabs to make seeing custom views more efficient Example: One tab for organic, one for paid and one for social. Filters allow you include or exclude any particular dimension Example – Exclude visits from Ask.com Making Custom Reports Event Hosted By: Local-Ventures
  • 8.
    Just like CustomSegments you are able to Import from Gallery! This is a great way to get started with Custom Reports Recommend Gallery Reports: Occam’s Razor Awesomeness New Google Analytics User Starter Bundle Event Hosted By: Local-Ventures
  • 9.
    To get familiarwith creating custom reports and advanced segments first import some from the gallery then click edit to see how they were set up. Then add any new dimensions and metrics you like! You can always delete custom reports and advanced segments and start over! Making Custom Reports Event Hosted By: Local-Ventures