Download as PDF, PPTX
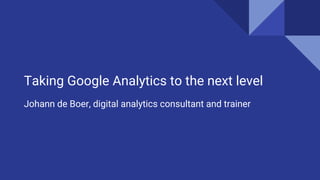
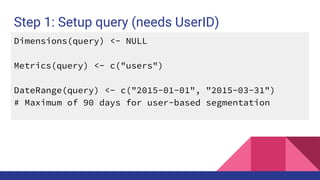
![API Response
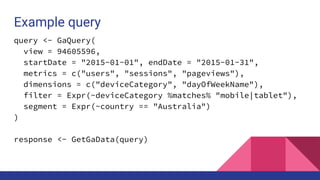
{
"kind": "analytics#gaData",
"id": string,
"selfLink": string,
"containsSampledData": boolean,
"query": {
...
},
"itemsPerPage": integer,
"totalResults": integer,
"previousLink": string,
"nextLink": string,
"profileInfo": {
...
},
"columnHeaders": [
{
"name": string,
"columnType": string,
"dataType": string
}, ...
],
"rows": [
[string, ...], ...
],
"sampleSize": string,
"sampleSpace": string,
"totalsForAllResults": [{
metricName: string,
...
}]
}](https://image.slidesharecdn.com/ganalyticspresentation1-160307005619/85/Interactively-querying-Google-Analytics-reports-from-R-using-ganalytics-10-320.jpg)
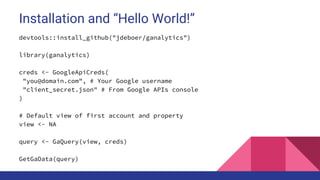
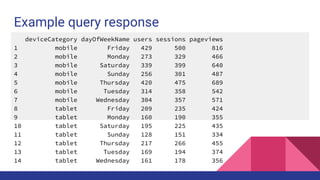
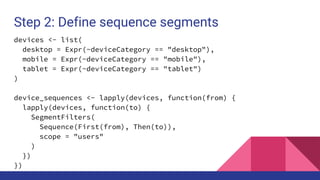
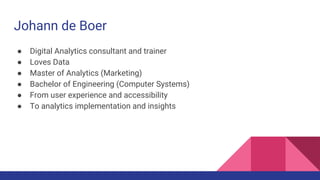
![Step 3: Get data for each segment
data <- lapply(seq_along(device_sequences), function(from_index){
from_name <- names(device_sequences)[from_index]
from_seq <- device_sequences[[from_index]]
lapply(seq_along(from_seq), function(to_index){
to_name <- names(from_seq)[to_index]
Segment(query) <- from_seq[[to_index]]
df <- GetGaData(query)
df <- cbind(from = from_name, to = to_name, df)
})
})
data <- unlist(data, recursive = FALSE)
data <- do.call(rbind, data)](https://image.slidesharecdn.com/ganalyticspresentation1-160307005619/85/Interactively-querying-Google-Analytics-reports-from-R-using-ganalytics-38-320.jpg)
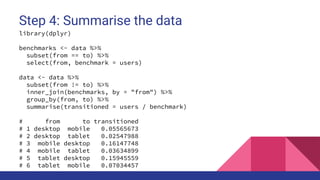
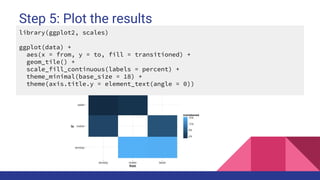

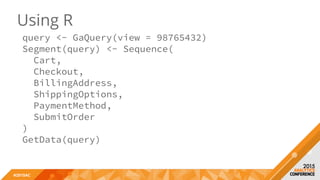
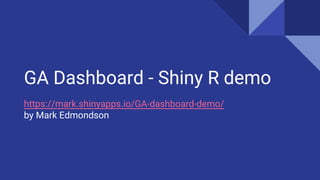

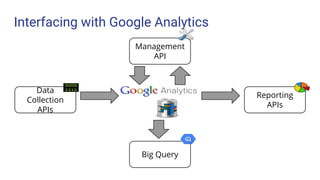
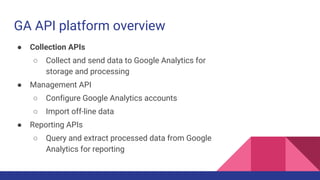
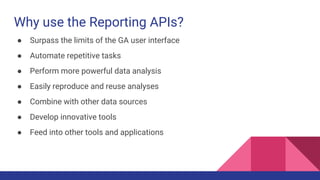
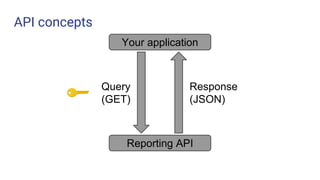
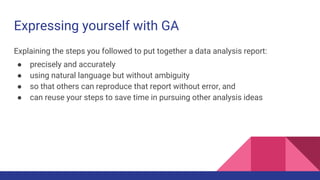
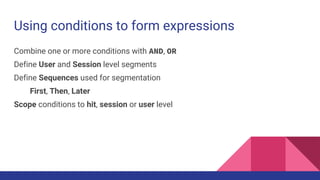
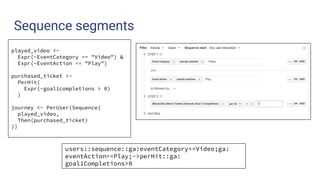
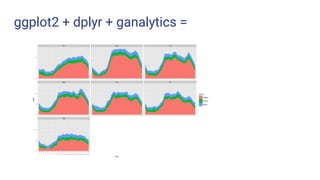
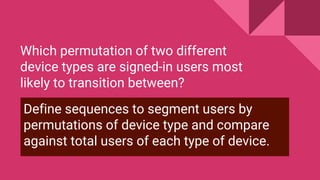
The document provides an overview of a presentation by Johann de Boer focused on using R for advanced Google Analytics data analysis, encouraging analysts to transition from Excel to R. It covers various aspects of Google Analytics APIs, including collection, management, and reporting, and how to perform data manipulation, automate tasks, and create visualizations using R. There are also practical examples and a demonstration of the 'ganalytics' package, which facilitates interaction with Google Analytics data in R.


![[DSC Europe 25] Tamas Srancsik - How To Teach Your AI Football? An Argument f...](https://cdn.slidesharecdn.com/ss_thumbnails/bcjh1m9xtbosv20ucftb-tamas-srancsik-how-to-teach-your-ai-football-260121115910-08b53e9e-thumbnail.jpg?width=640&height=640&fit=bounds)


![[DSC Europe 25] Mikhail Rozhkov - AI Product Canvas: From Business Goals to T...](https://cdn.slidesharecdn.com/ss_thumbnails/d53doddtpgfqivmzqel6-mikhail-rozhkov-ai-product-canvas-v1-260121115910-9dd517a7-thumbnail.jpg?width=640&height=640&fit=bounds)


![[DSC Europe 25] Paula Garcia Esteban -Building the Future: The Role of Data S...](https://cdn.slidesharecdn.com/ss_thumbnails/9ld1r1bsqpwve8qfvphy-paula-garcia-esteban-building-the-future-260122103838-4171f5cb-thumbnail.jpg?width=640&height=640&fit=bounds)
![[DSC Europe 25] Tali Fulman - Guild Meetings, Then What? Building Data Commun...](https://cdn.slidesharecdn.com/ss_thumbnails/fgohhi33rwmhqdowdj5k-tali-fulman-guild-meetings-then-what-building-data-communities-that-actually-ch-260120105855-528492c3-thumbnail.jpg?width=640&height=640&fit=bounds)


![[DSC Europe 25] Josip Saban - Career building for data professionals.pptx](https://cdn.slidesharecdn.com/ss_thumbnails/zroflcttkm1vmli0txea-josip-saban-career-building-for-data-professionals-260123083019-587cdb8c-thumbnail.jpg?width=640&height=640&fit=bounds)


