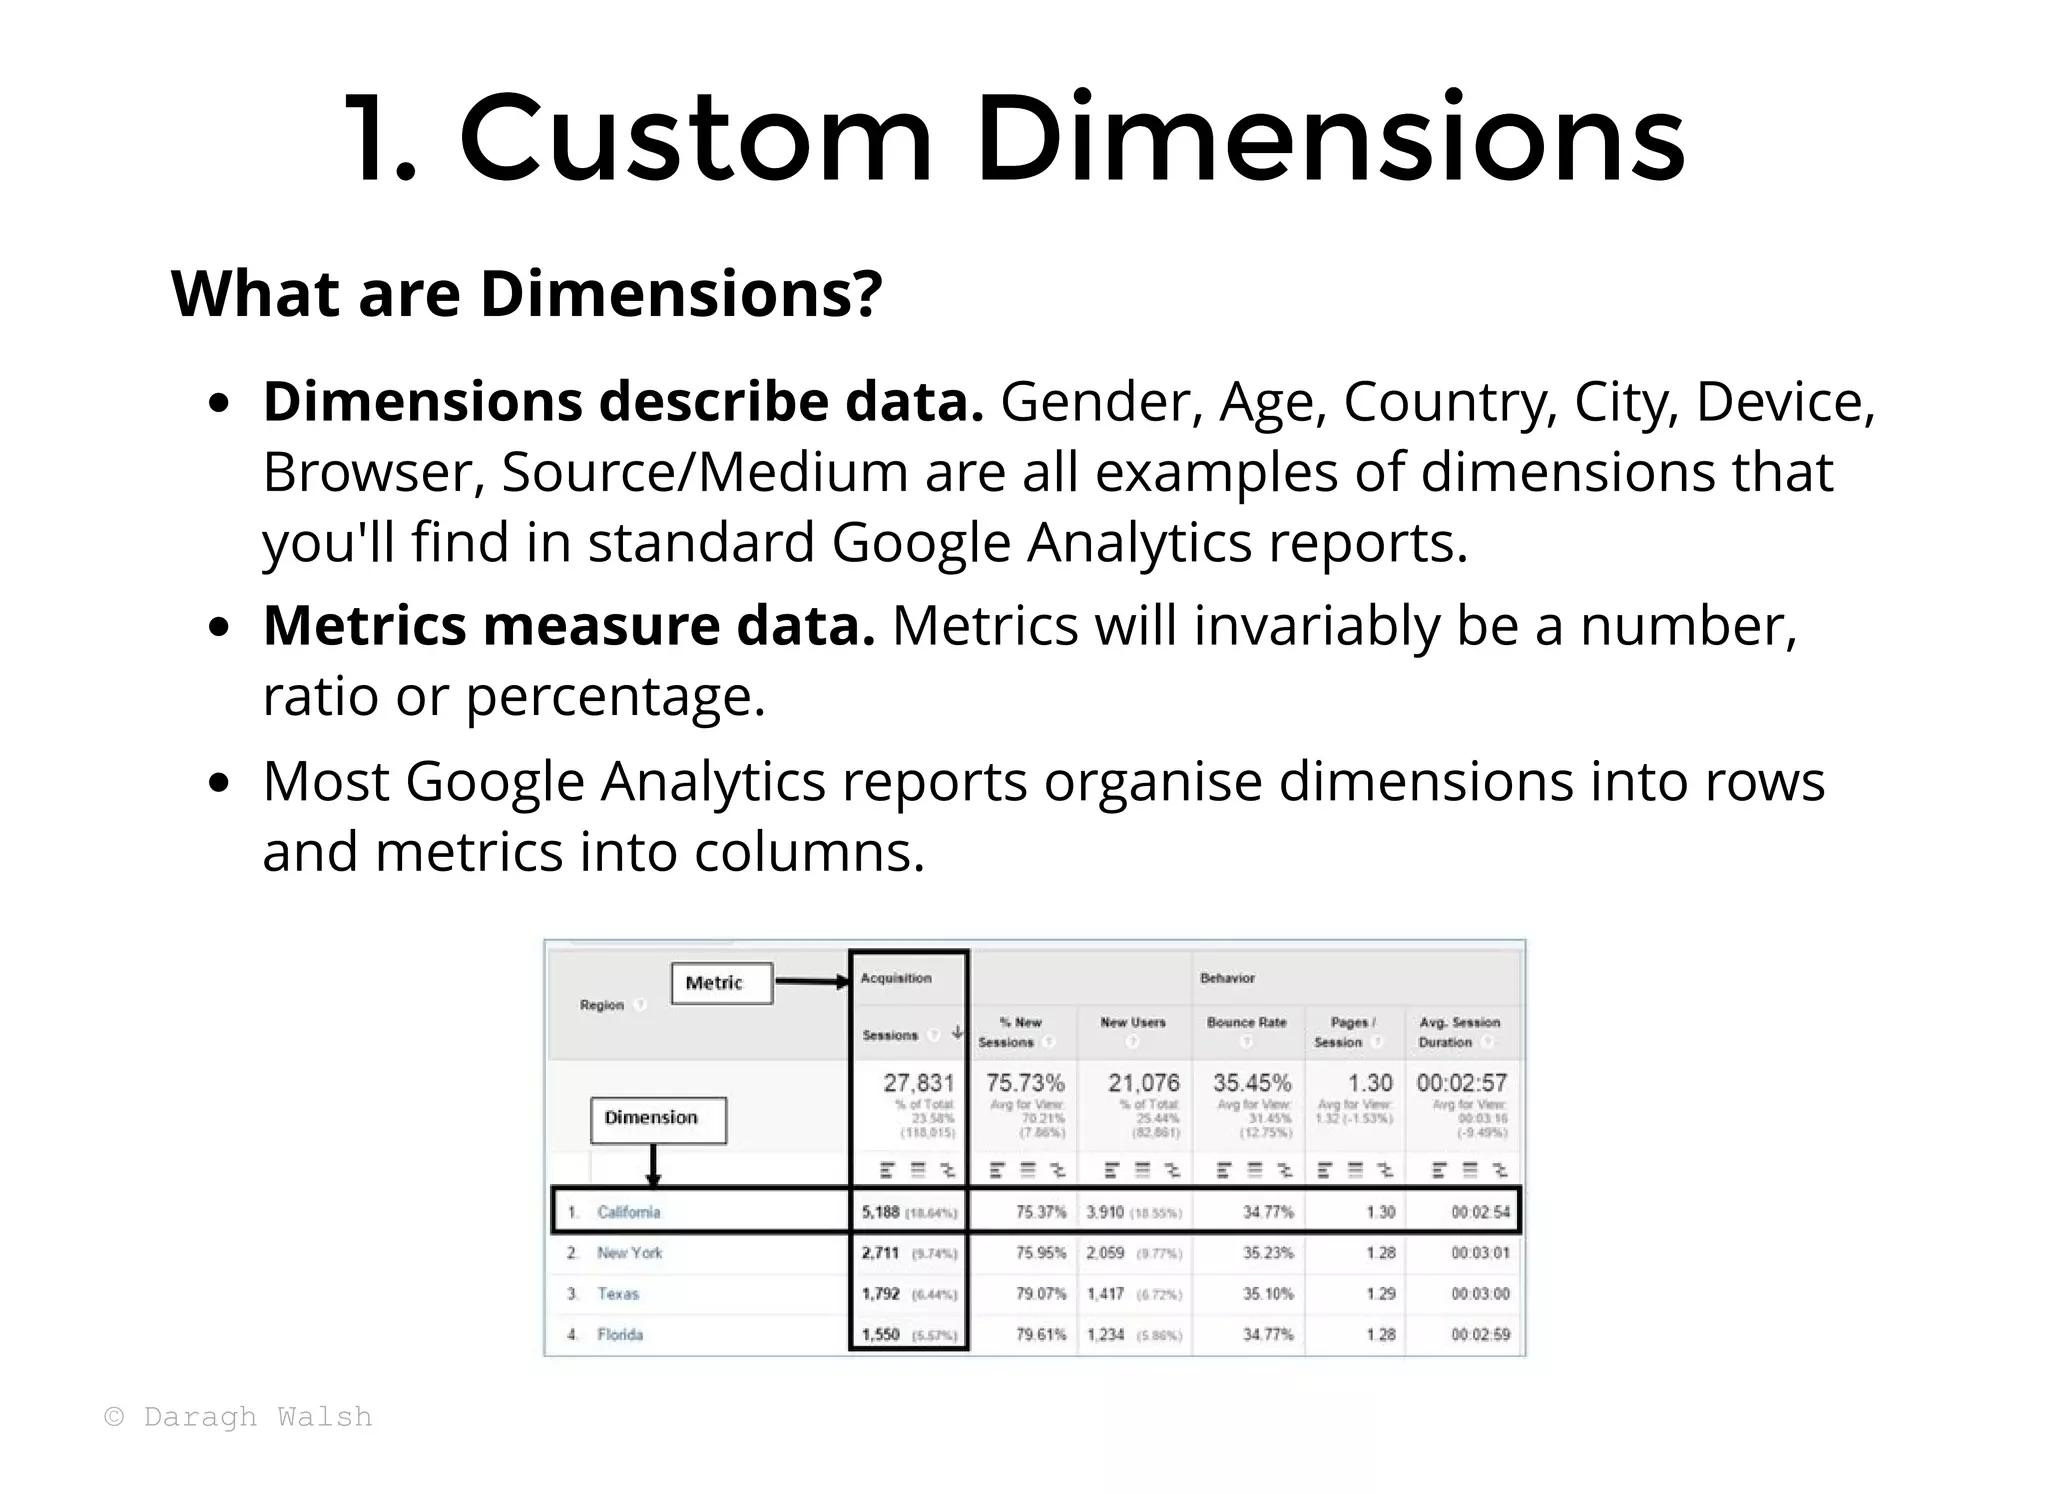
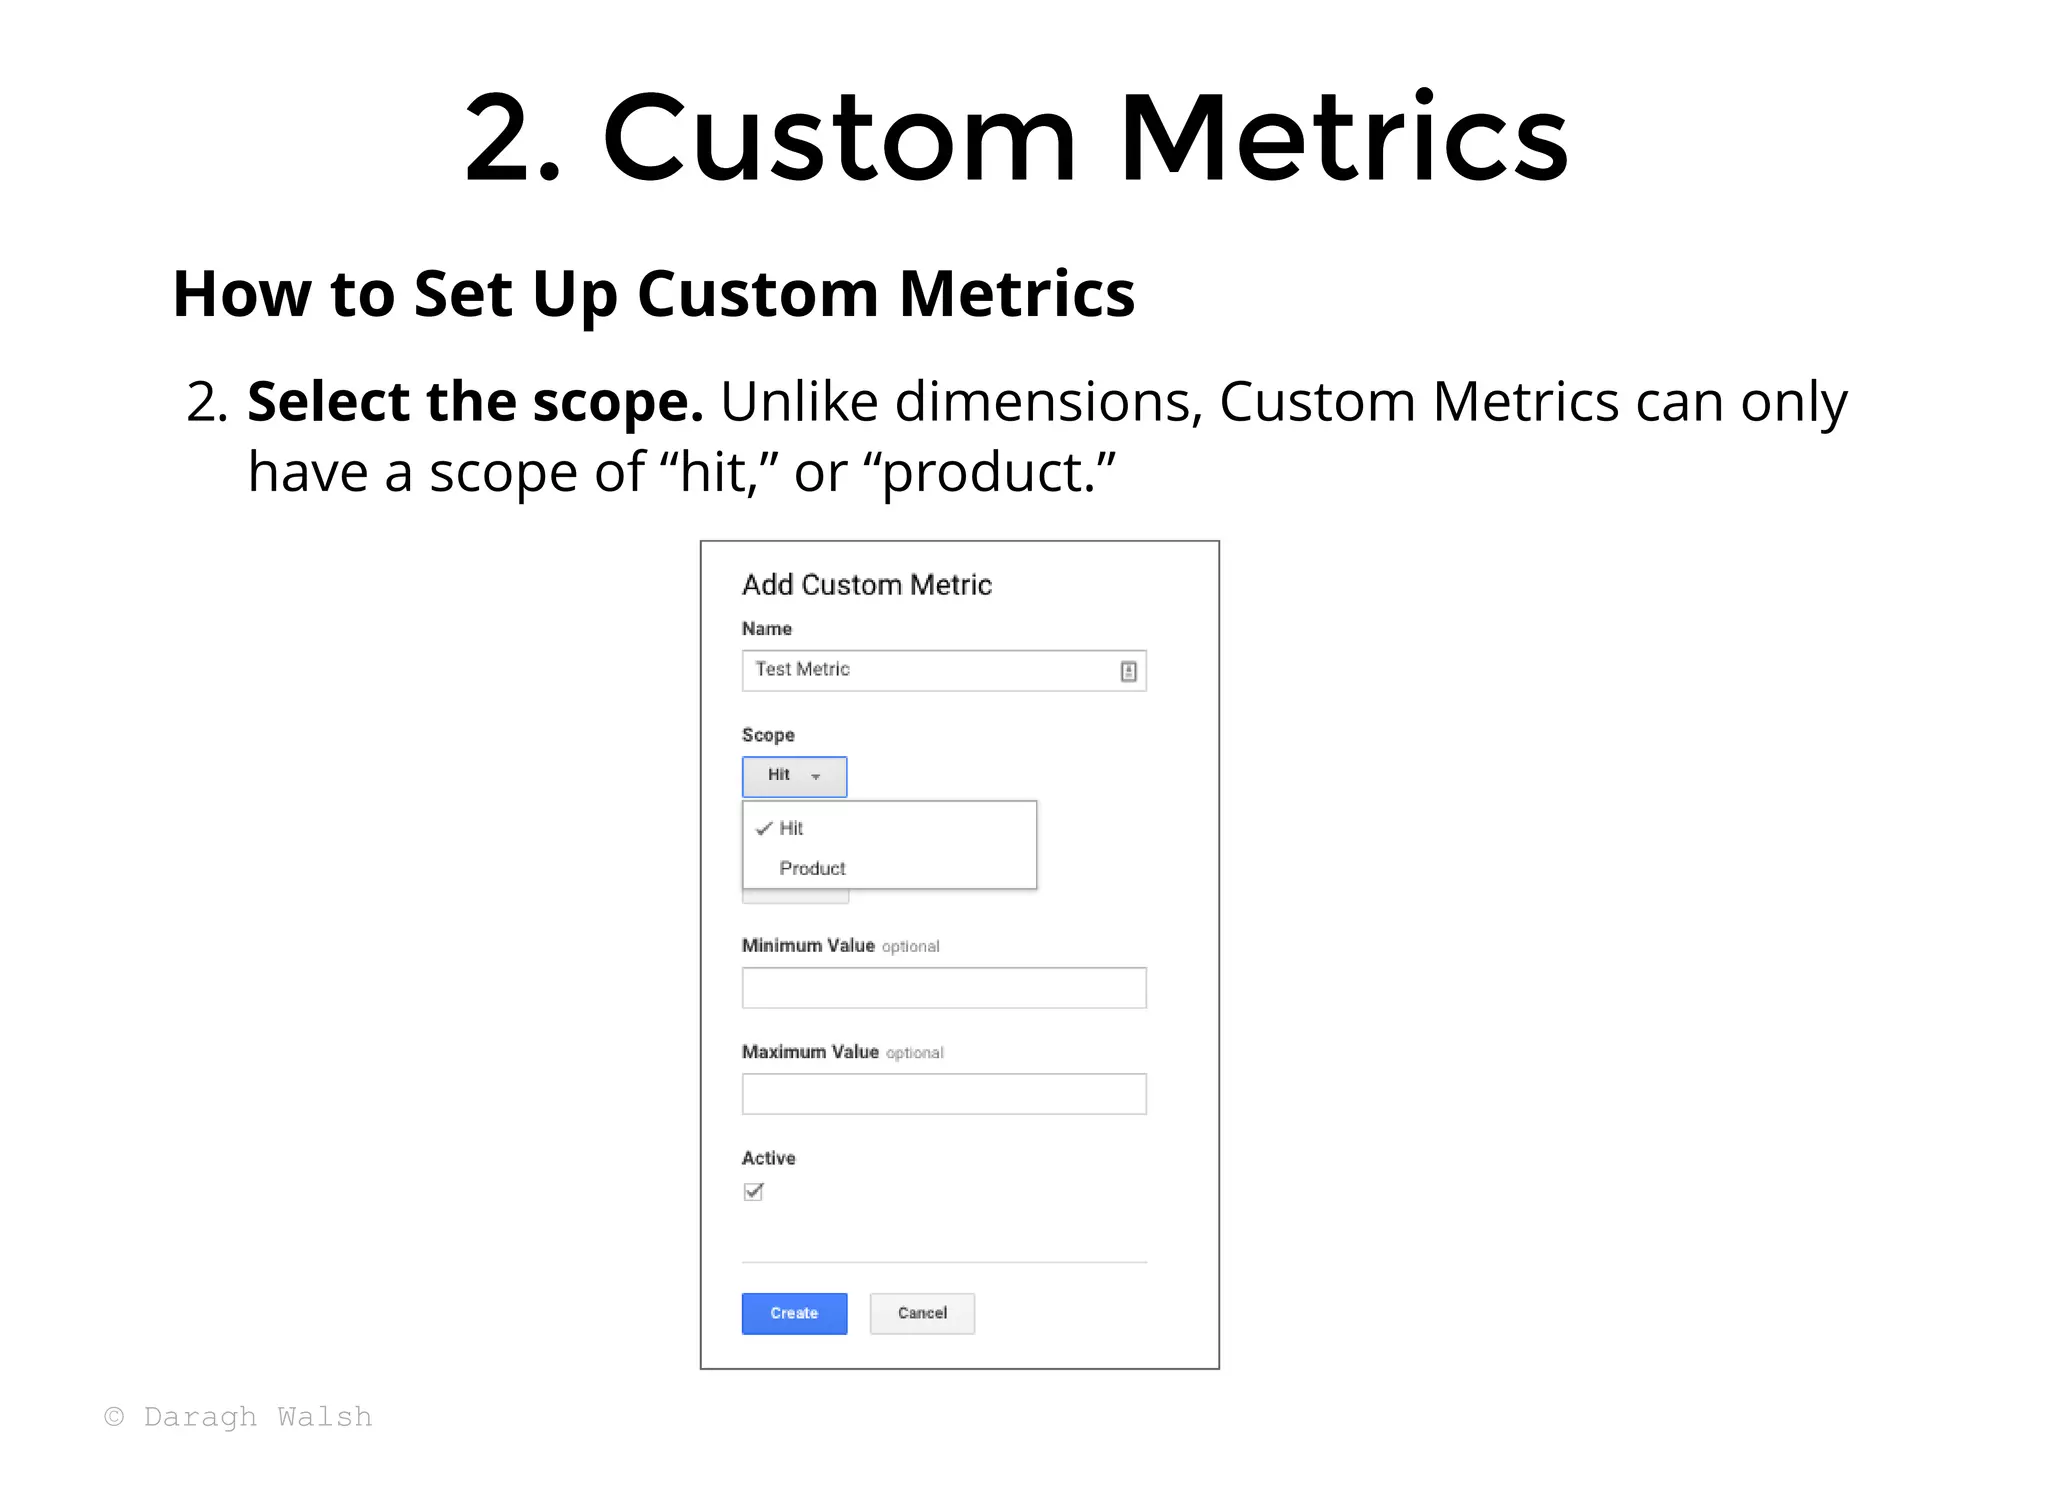
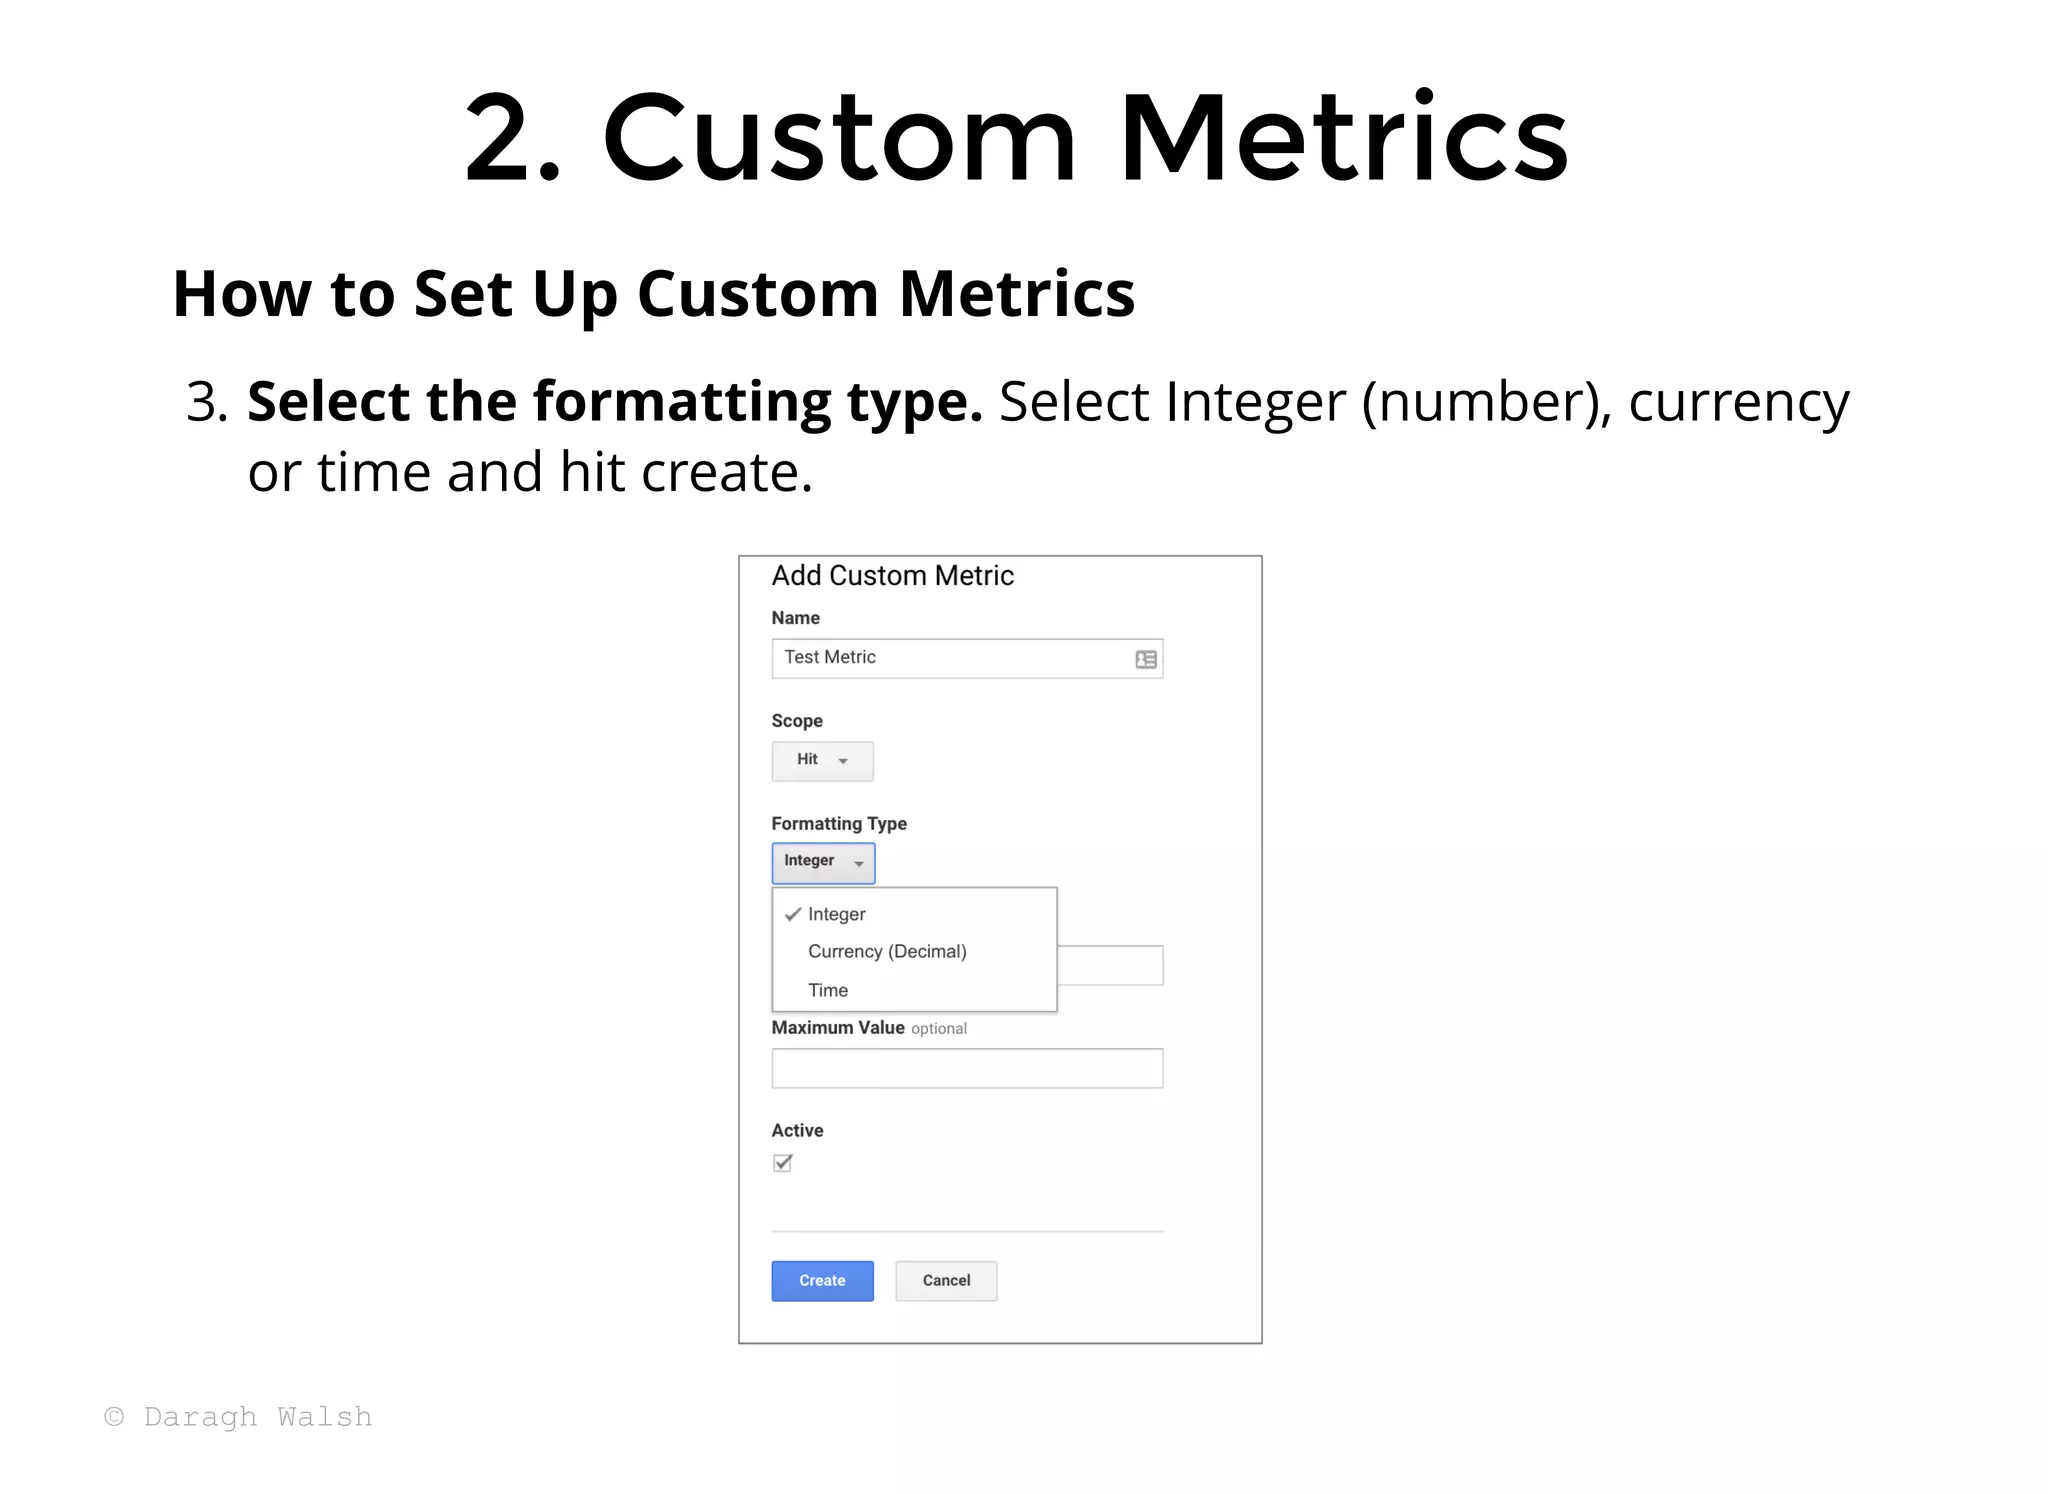
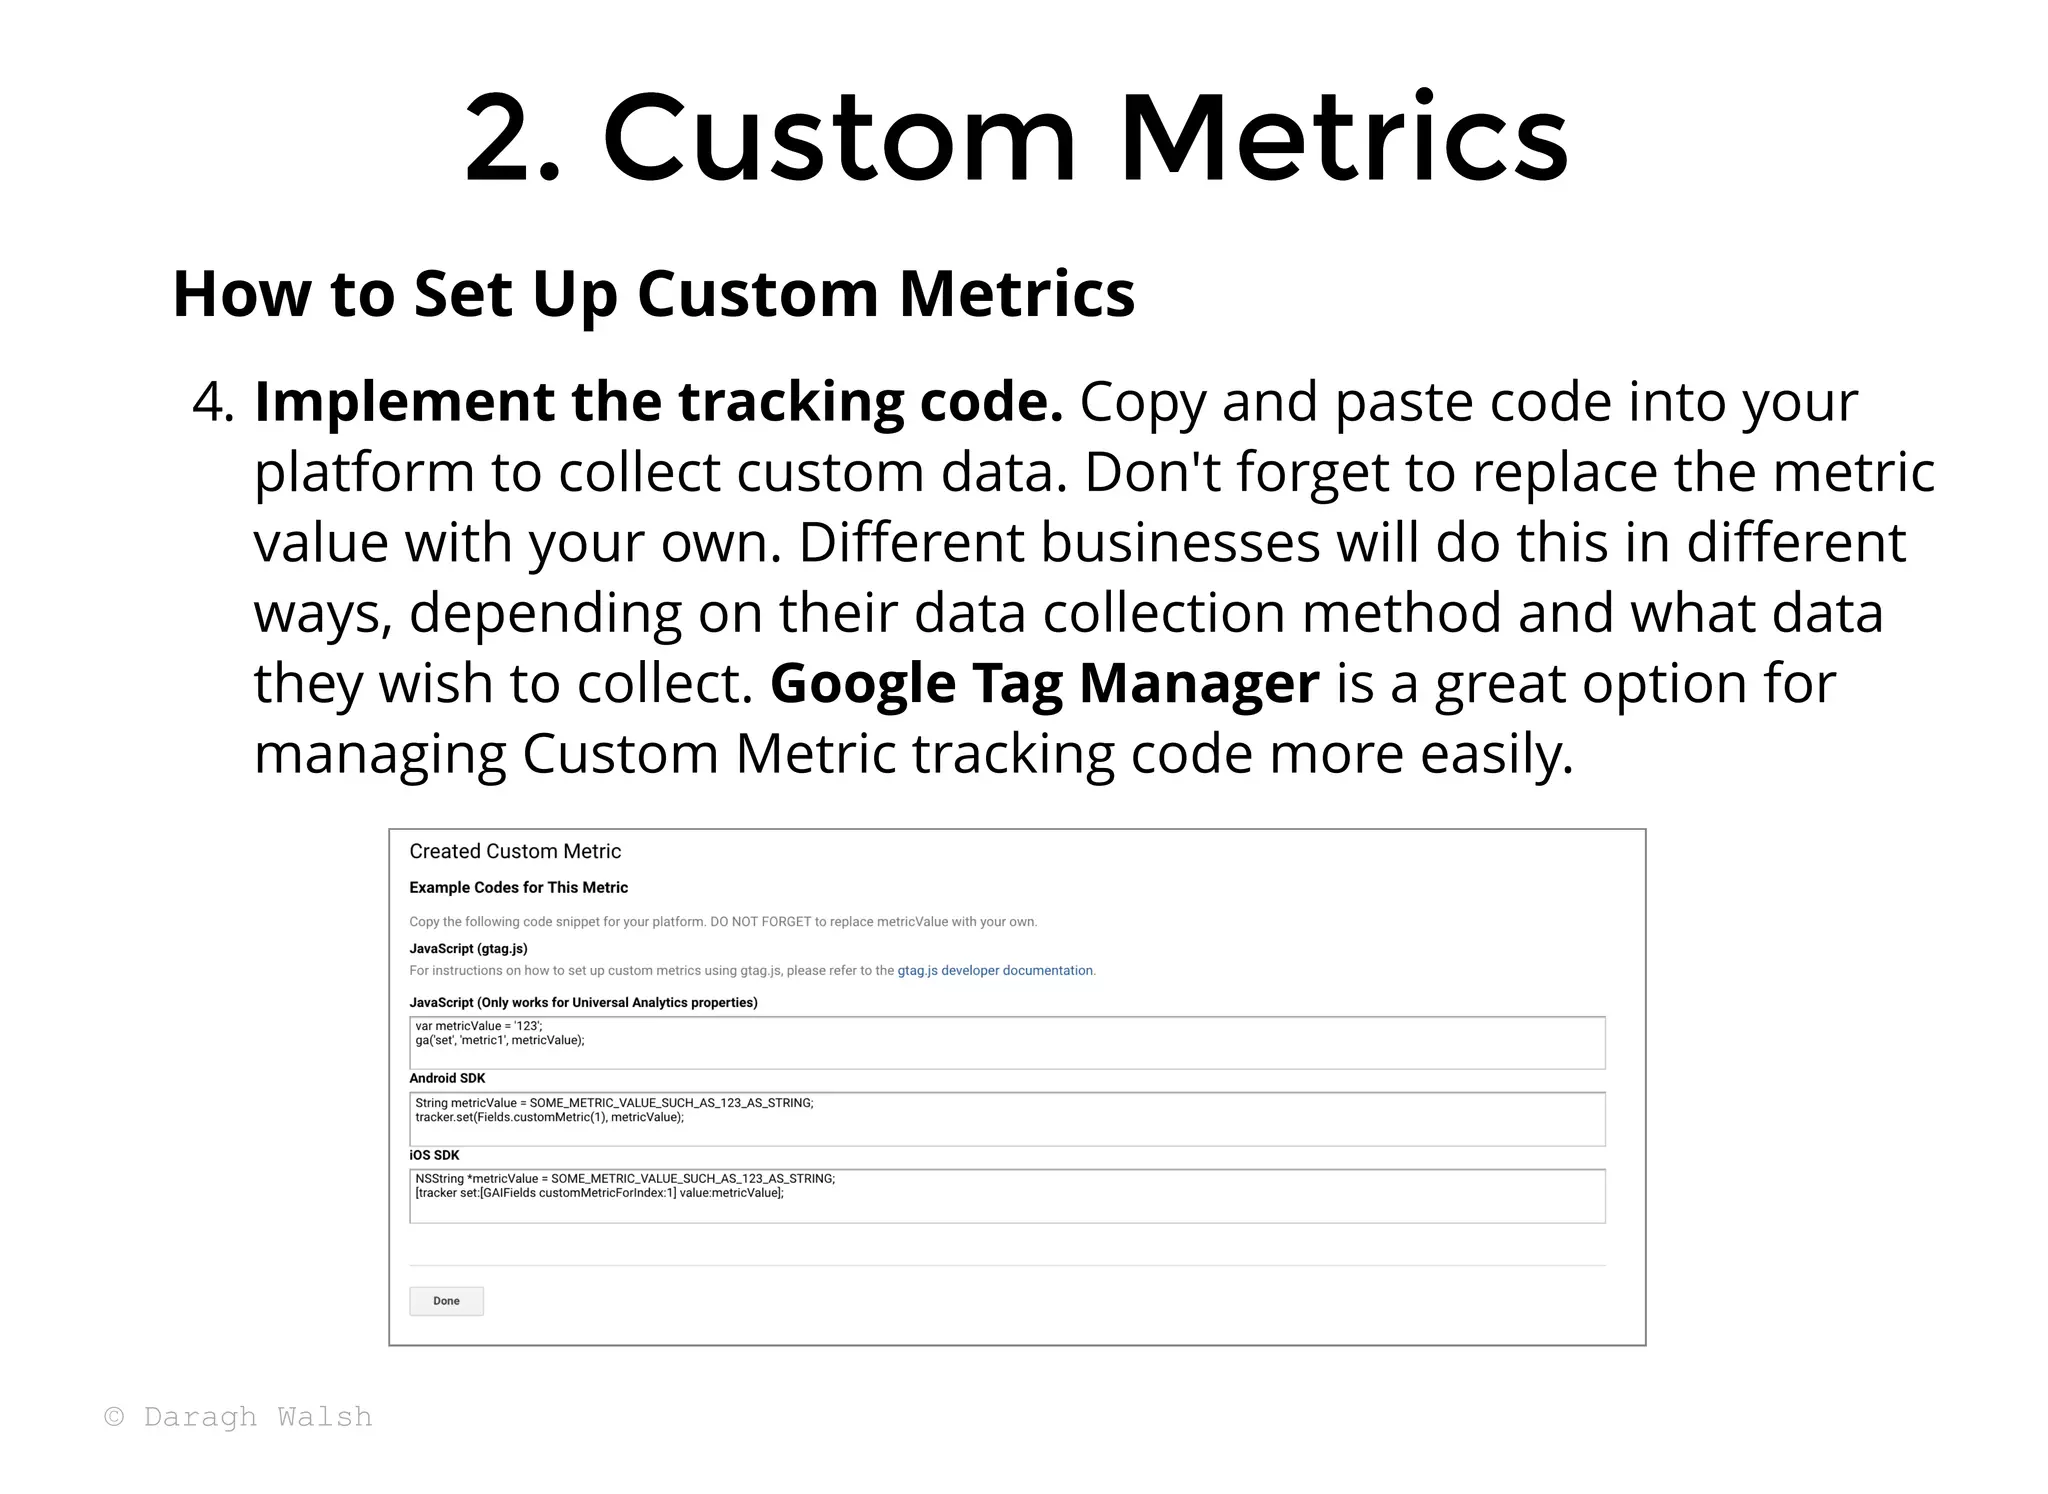
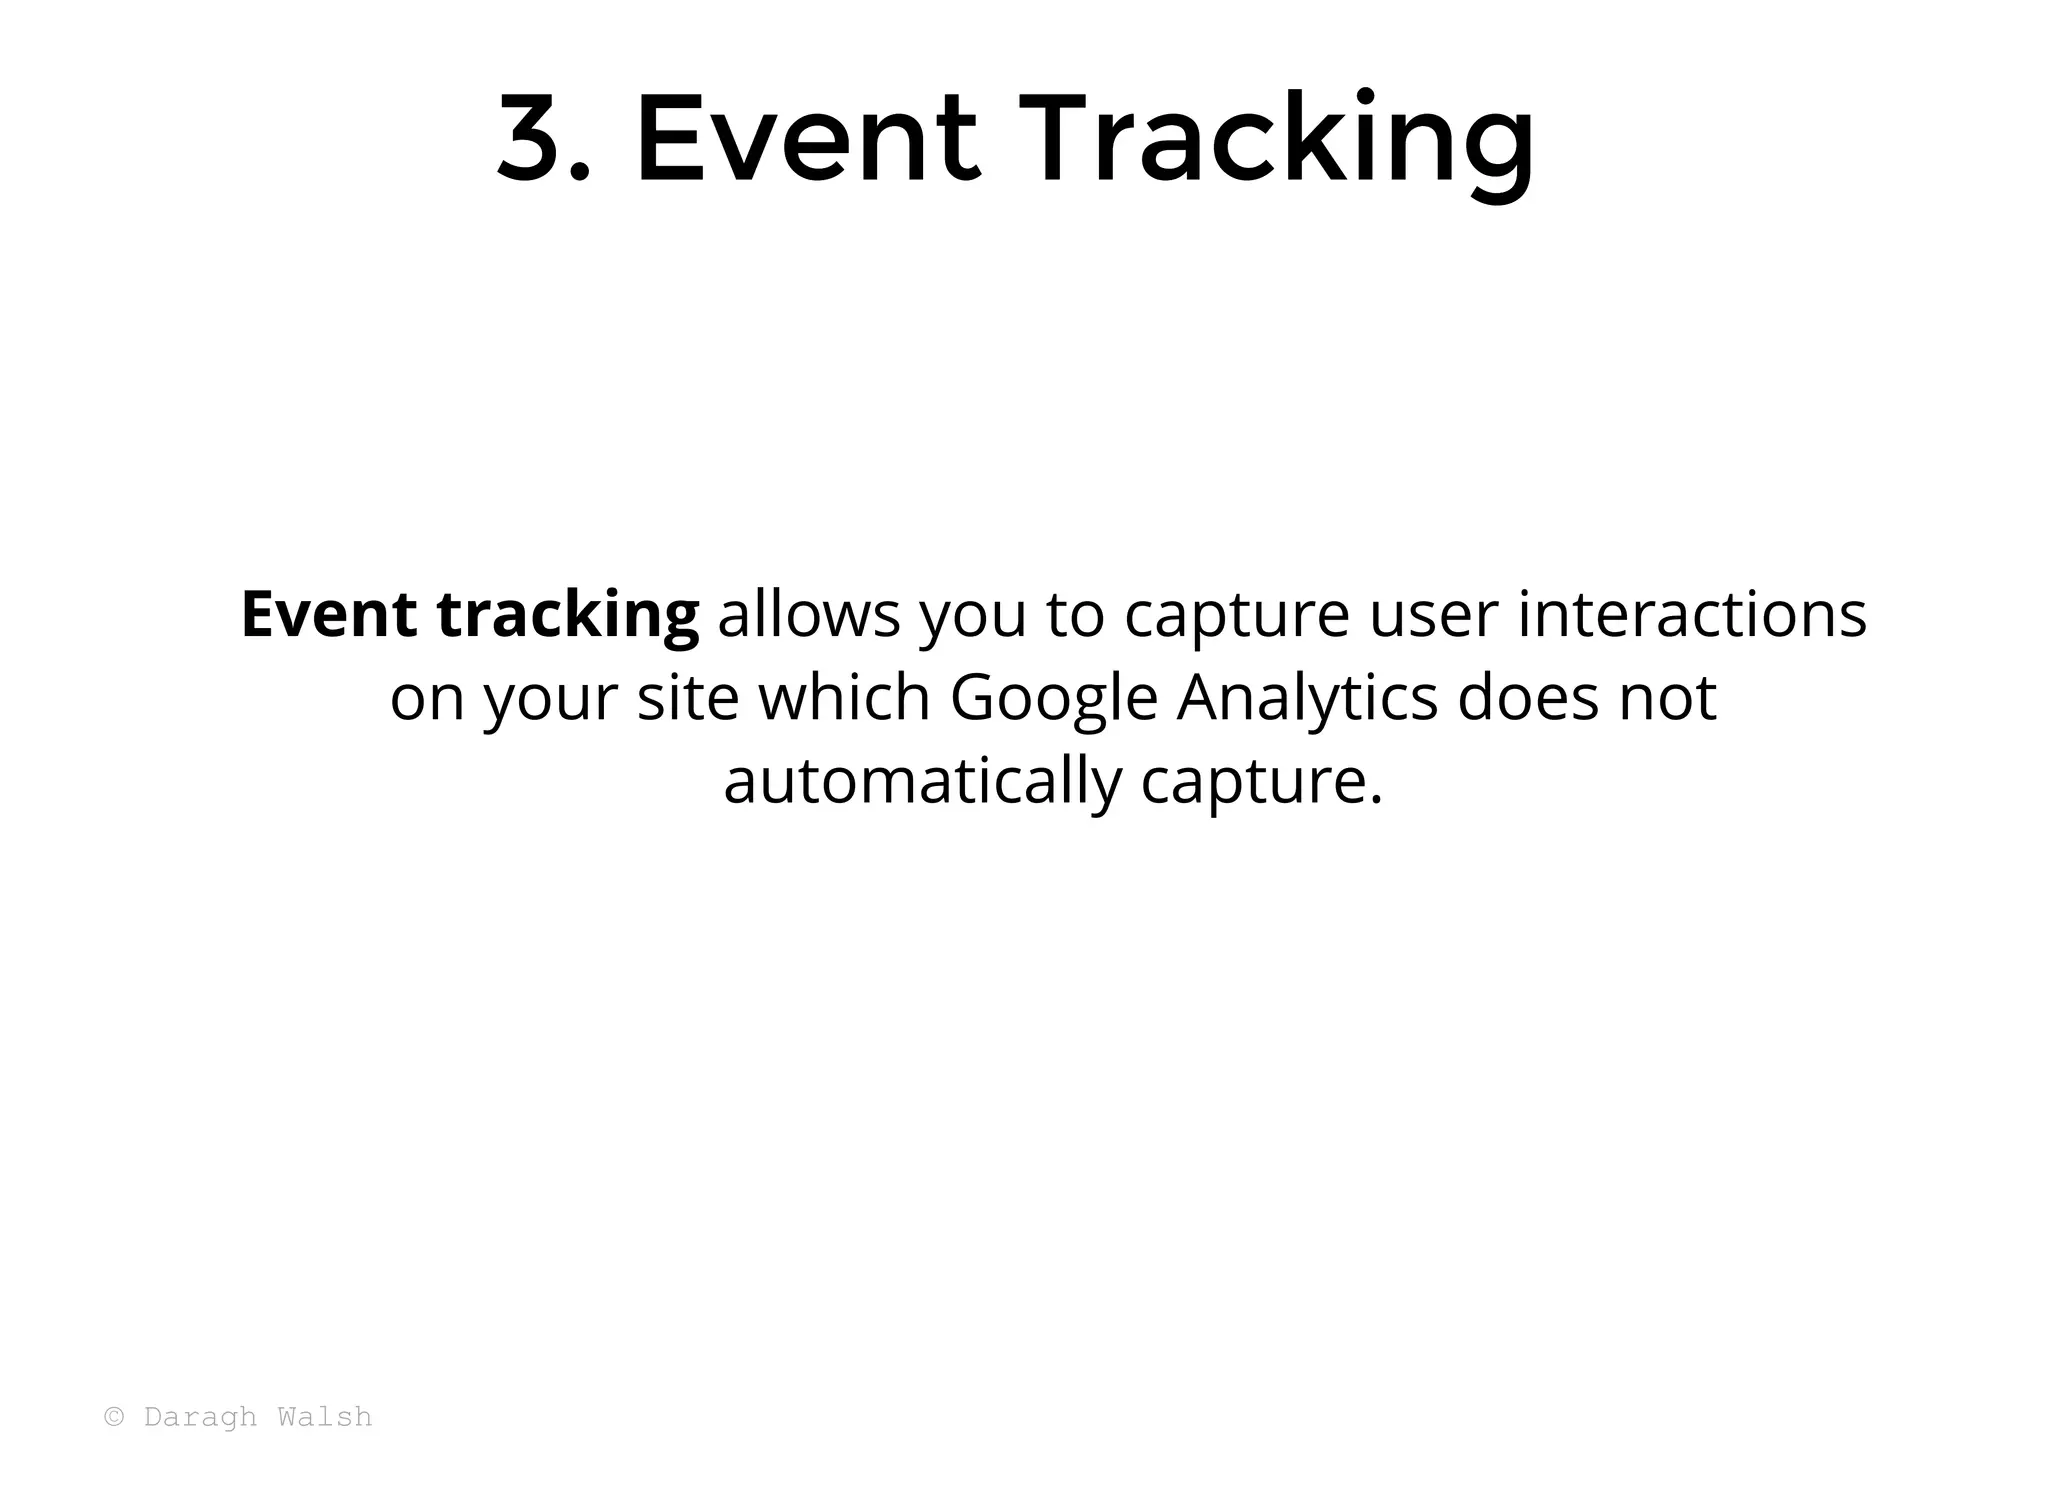
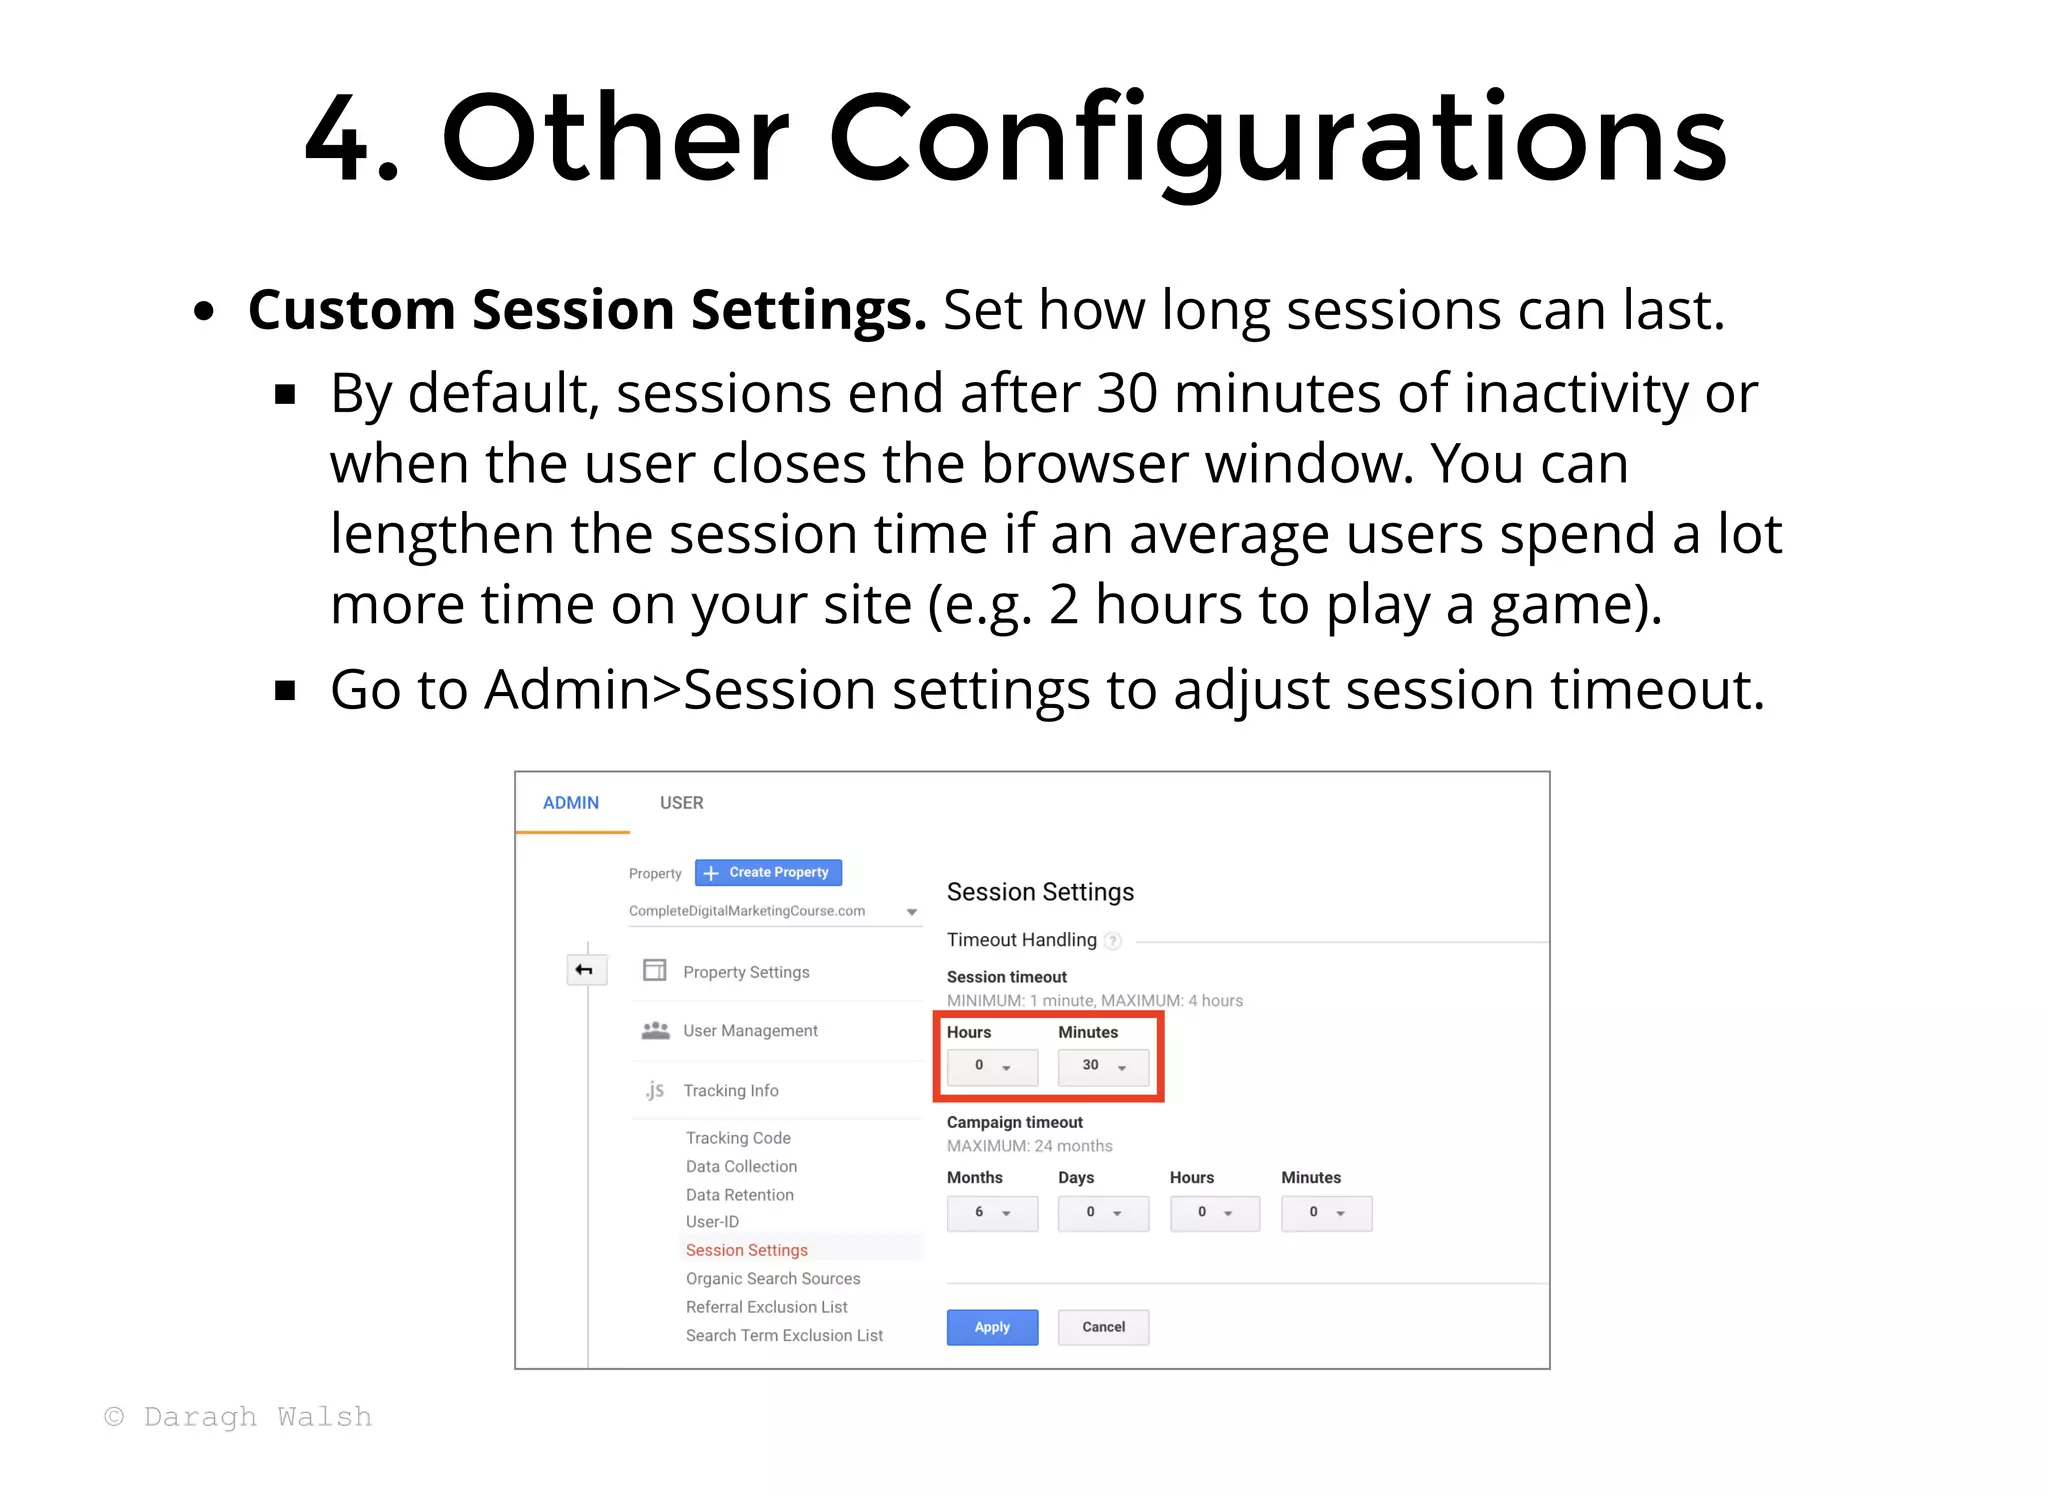
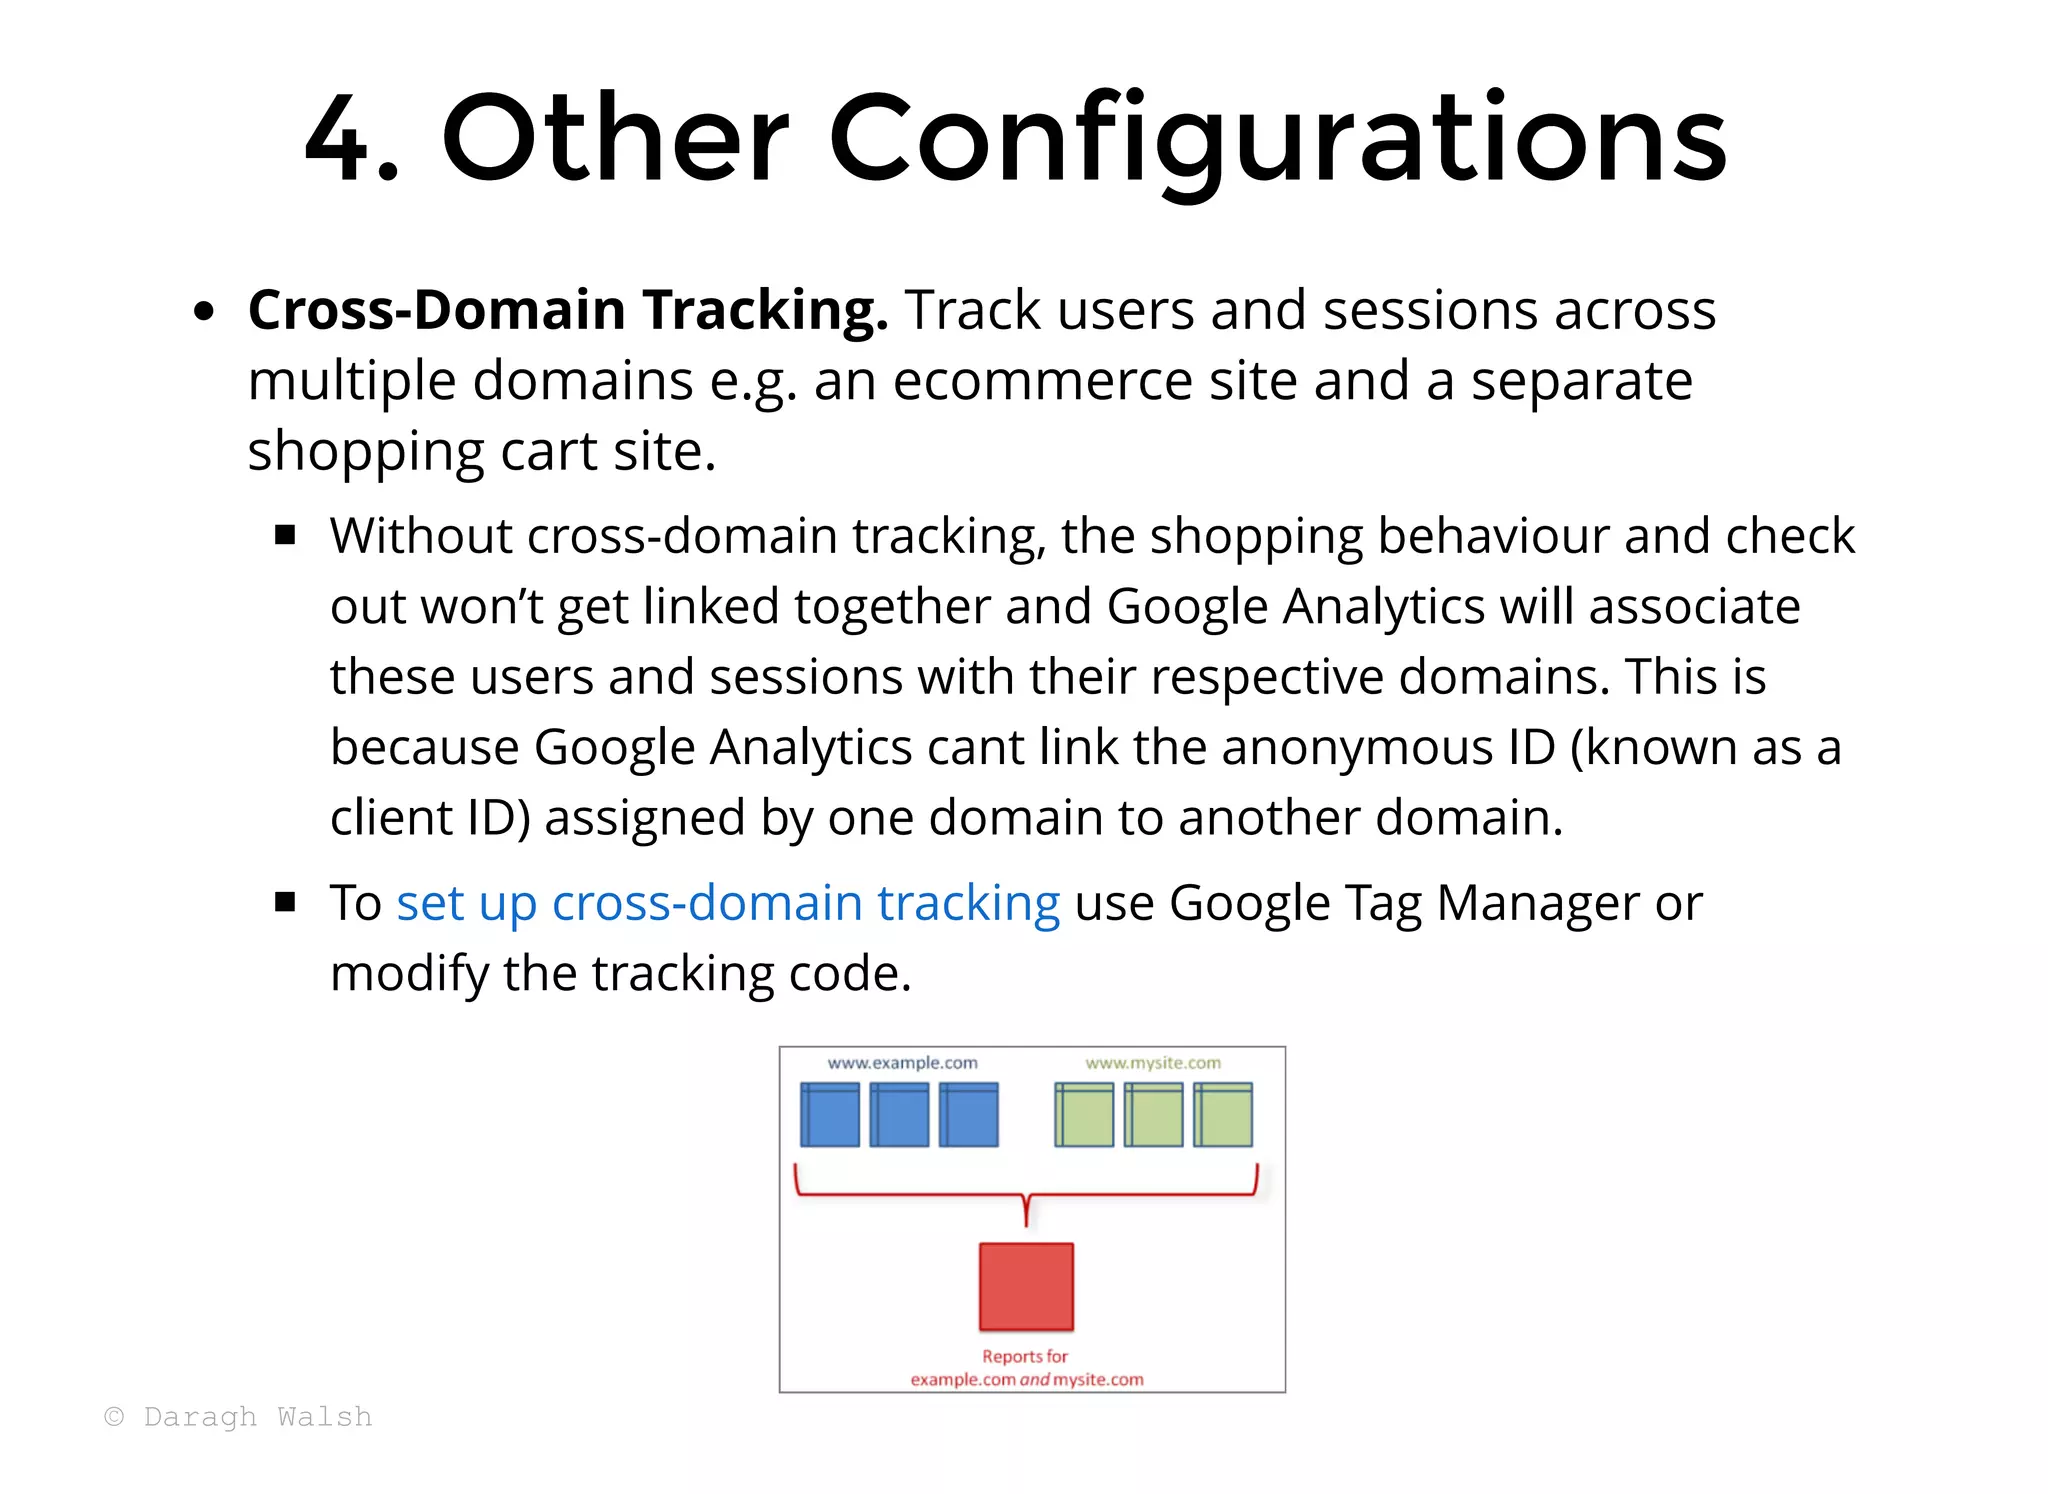
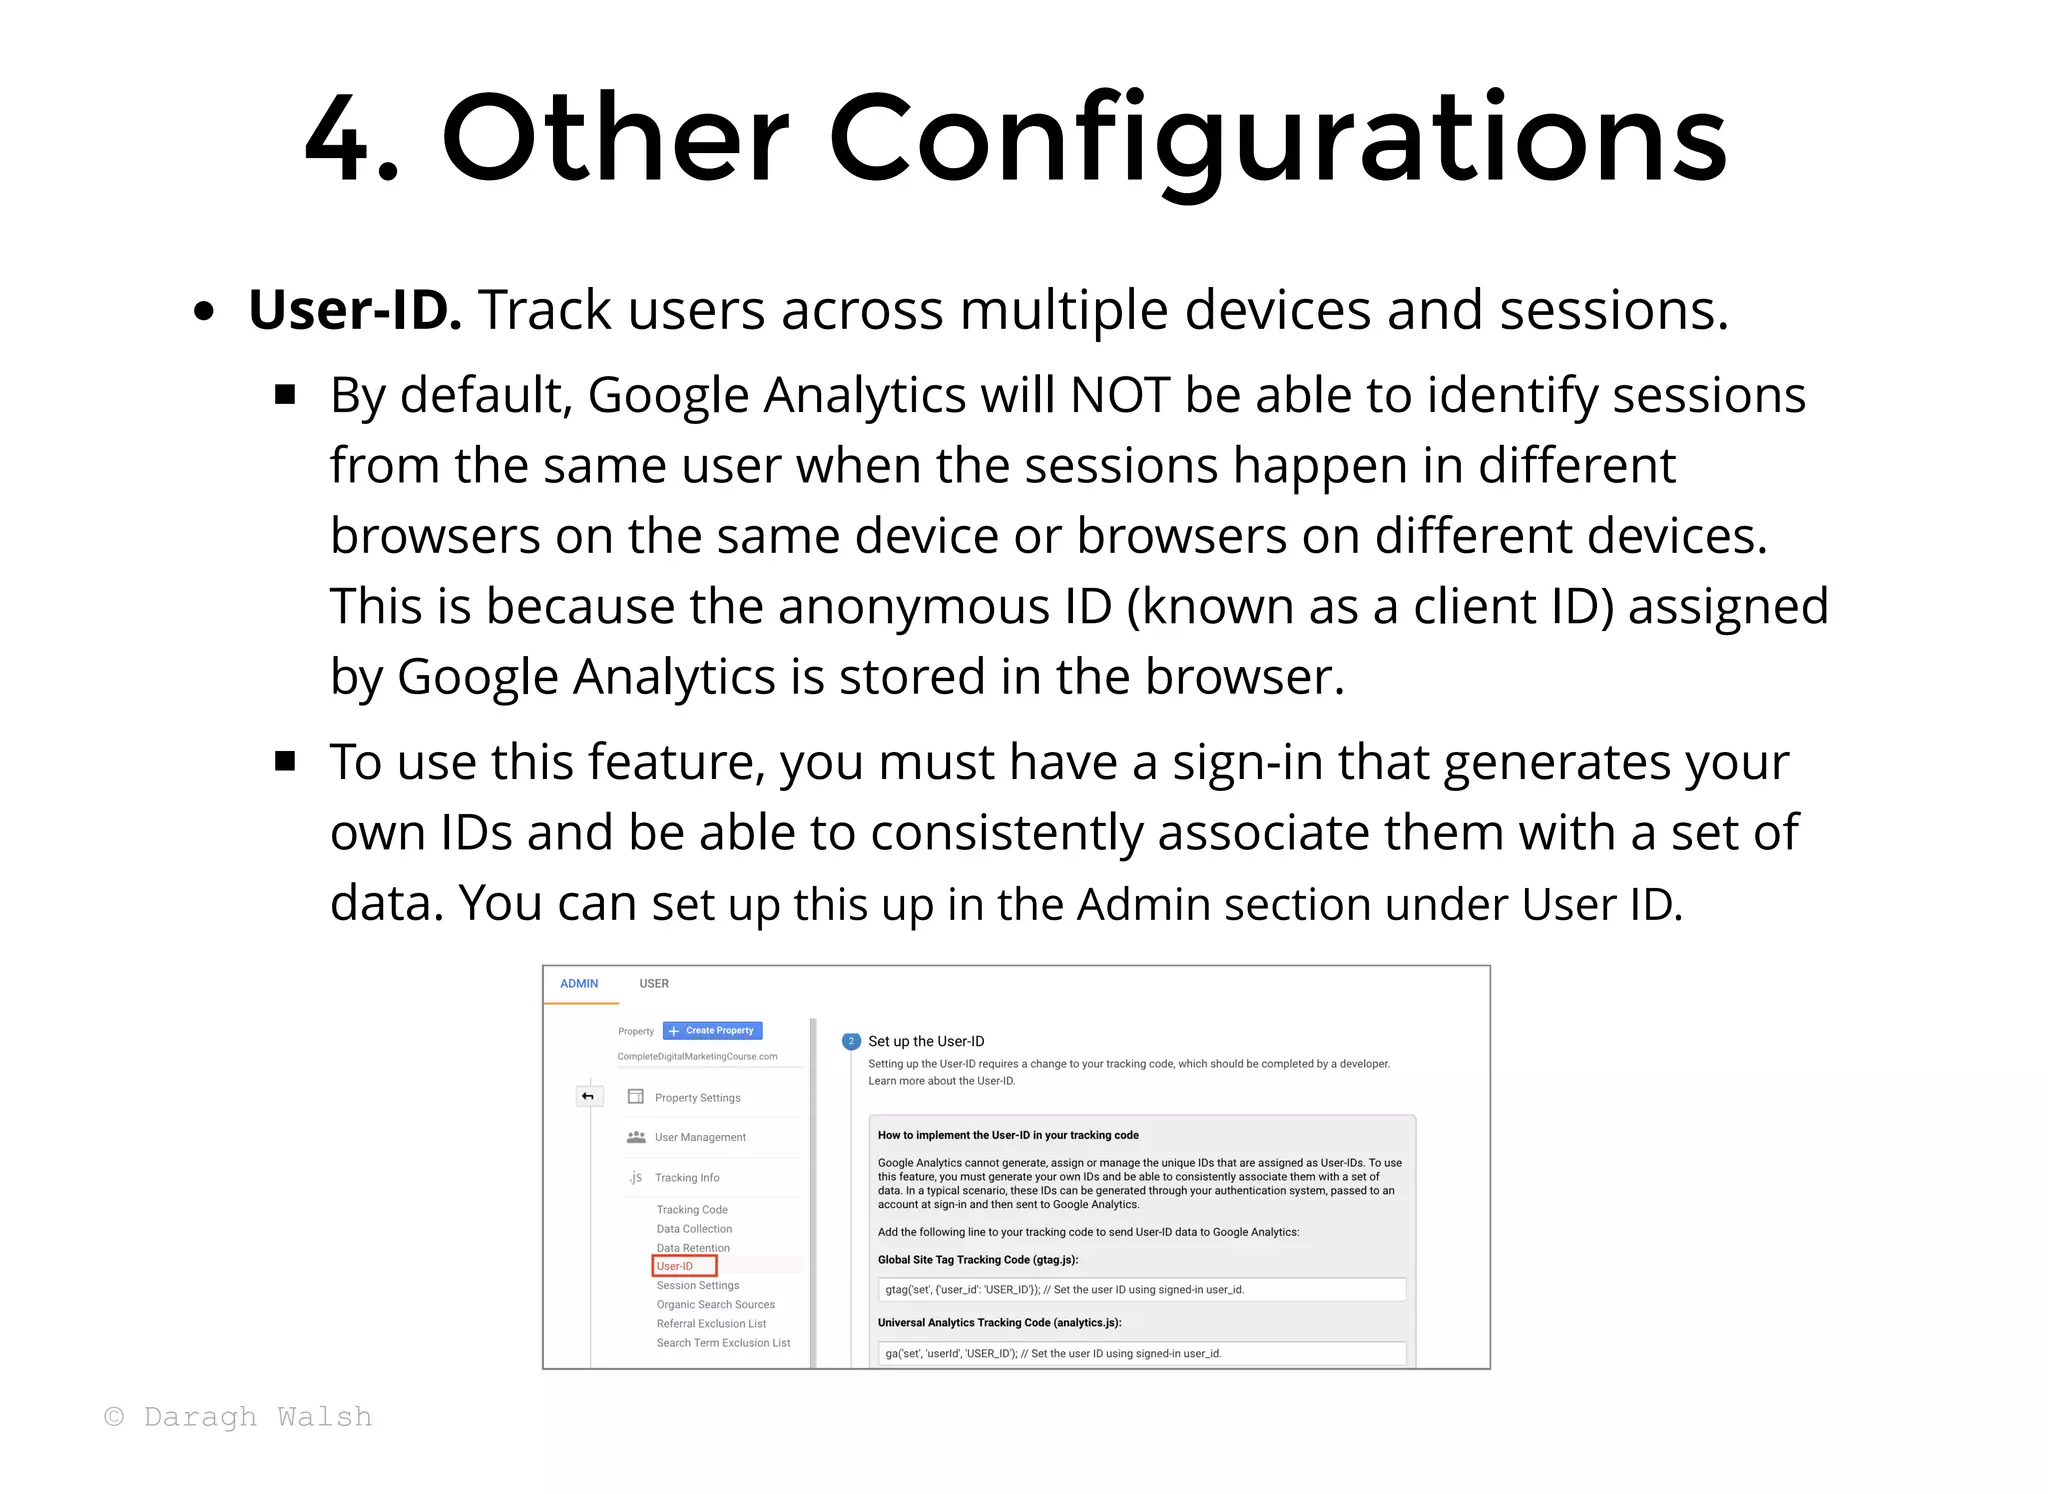
This document provides an overview of advanced Google Analytics configurations including custom dimensions, custom metrics, event tracking, and other useful configurations. It discusses how to set up and implement each of these tools to track custom data, analyze user behavior, and gain insights specific to your business needs. Examples are given for different types of custom dimensions, metrics, and events that could be tracked.
Evolution or Extinction:Survive and Thrive with New Google Analytics Features4Ps Marketing
Find out more about the latest features in Google Analytics with Matt Stannard, Head of Analytics and Technology at 4Ps Marketing. Matt recently was invited to speak at the ‘Evolve with Google’ conference in the USA, where his session was the highest rated speaker slot of the entire conference.
Google analytics for marketers beyond the basicsCharlie Kalech
Learn what lies beyond the default installation of Google Analytics.
Easily configure Custom Reports
Definitions, Samples & Instructions for Custom Dashboards, Widgets, Segments, Filters, Dimensions and Metrics.
Track on-site actions like Clicking Offsite or Playing a Video.
Compare Your Site to Others in Your Industry
This document provides an overview of a training on Google Analytics for beginners. The training covers 12 topics: 1) Why Google Analytics, 2) How Google Analytics Works, 3) Setting Up Google Analytics, 4) Creating Additional Reporting Views, 5) Adding Filters, 6) Setting Up Goals, 7) Navigating Google Analytics, 8) Using Analysis Tools, 9) Analyzing Key Reports, 10) Setting Up Dashboards, 11) Tracking Marketing Campaigns, and 12) Linking Analytics with Google Ads. Upon completing the training, students will have a professional understanding of Google Analytics and know how to use it as a tool to grow their business.
Google Data Studio is a free tool from Google that allows users to create reports with data visualizations to share with clients. It is part of Google Analytics 360. Users can access Google Data Studio at https://datastudio.google.com and create data connections to visualize data from sources like Google Analytics, Google Ads, and more. Reports can be made interactive with filters and controls to tell data stories through various chart types and annotations.
Google Optimize for testing and personalizationOWOX BI
More information here » https://www.owox.com/c/1g4
Understanding your customers is not a straightforward task. It may require a great deal of time and resources to discover which website experience drives better engagement and better conversion rate. Not all changes lead to better results, and you might have to ask developers to implement the hypotheses on your website. Google Optimize is a new testing and personalization solution designed by Google to help you build optimal website experiences considering your specific audiences. It’s integrated with Google Analytics and other Google products, so you can test your hypotheses using the existing data and the familiar metrics. And you won’t have to involve developers.
✔Why, and how to personalize websites;
✔How to start using Google Optimize;
✔How to set up an experiment in Google Optimize;
✔What types of experiments are available in Google Optimize;
✔How to create test variants using the visual editor, without developers;
✔How to manage experiments and determine the winning options;
✔What’s the difference between Google Optimize and Google Optimize 360.
The webinar will be useful to:
Analysts, marketing specialists, project managers, and to anyone looking for a helpful tool to test ideas for improving the websites.
Checkout Google Analytics' Custom Reports feature. It’s an incredibly powerful tool that allows great flexibility to slice and dice your website analytics data in very interesting ways, based on your unique business goals and needs.
This document provides an overview of web analytics and Google Analytics. It defines web analytics, discusses ways to analyze data both traditionally and through the web analytics paradigm. It also covers setting up goals and funnels in Google Analytics, using segments, alerts and enhanced ecommerce tracking. A key section discusses attribution modeling and how to set up a custom attribution model based on an understanding of your business and customer journey.
Google analytics account setup optimization DAVID RAUDALES
This document provides a checklist to help users customize and optimize their Google Analytics account. It includes beginner, intermediate, and advanced steps. The beginner steps focus on setting up the account properly, including defining website objectives, creating views, and installing the tracking code. The intermediate steps delve into customizing the account further, such as identifying key performance indicators and creating additional views. The advanced steps are designed for certified users. The goal is to turn Google Analytics into a customized reporting tool that provides actionable insights.
Google tag manager fundamentals question and answer (june 23 and july 24, 2015)Mahendra Patel
This document contains questions and answers about configuring and using Google Tag Manager. It covers topics like how Tag Manager can help manage website tags, when tags should fire, setting up triggers, using built-in and custom variables, and setting up tags for Google Analytics tracking and Google Ads conversions/remarketing. The assessments contain multiple choice questions testing understanding of Tag Manager fundamentals, implementing the data layer, and using Tag Manager for analytics and advertising integrations like dynamic remarketing.
These slides are used for the Google Analytics course developed by Frank Jones with OptSus Marketing. The course has been taught in-person, online, and through NCSU Professional Development.
This document provides a 7 step guide to getting started with Google Analytics. It begins by explaining how to install the tracking code on a website. It then discusses important metrics and terminology to understand like visits, pageviews, bounce rate, etc. Further steps cover setting up goals, linking Google Analytics to Google Adwords, analyzing content and traffic sources, creating dashboards, and custom reporting. The overall purpose is to help users understand how to properly set up Google Analytics and utilize its key features to measure website traffic and the effectiveness of online marketing efforts.
Universal Analytics Out of Beta - BrightonSEO 2014darafitzgerald
After about 18 months in beta, Universal Analytics is now fully available with complete feature parity compared to Classic GA. This presentation runs through the current state of play with Universal, the key benefits to us as marketers and practical examples of how to start making the most of the new tracking library.
Web analytics is the measurement and analysis of internet data to understand and optimize website usage. It involves both on-site analytics, which measure visitor behavior on a website, and off-site analytics, which analyze a website's potential audience and online visibility regardless of ownership. Key performance indicators are metrics used to evaluate success, such as visits, pageviews, and conversion rates. Google Analytics is a commonly used tool that uses first-party cookies and JavaScript code to collect visitor data and provide reports on acquisition, behavior, and conversions.
The document provides instructions for setting up filters, advanced segments, goals, and event tracking in Google Analytics. It discusses how to exclude specific IP addresses from reports using filters. It also describes how to create custom advanced segments to compare traffic from different devices. The document outlines the process for setting up conversion goals and funnels. Additionally, it explains how to use event tracking to monitor actions on pages like video plays or file downloads. Lastly, the document provides steps for tracking outbound links to other websites.
1. The document provides an overview of setting up and using Google Analytics. It discusses setting up views, filters, and accounts. It also covers how to track campaigns, set up goals, and link Google Analytics to Google Ads.
2. Basic reports in Google Analytics like audience, acquisition, and behavior reports are explained. The acquisition reports can show which marketing channels bring in users and the behavior reports show how users engage on the site.
3. Goals in Google Analytics are used to track conversions. Configuring goals allows analytics to generate conversion metrics like the number of conversions and conversion rate.
Google Analytics with an Intro to Google Tag Manager for Austin WordPress MeetupRich Plakas
Google Analytics with an Intro to Google Tag Manager for Austin WordPress Meetup.
This was an intermediate session where we took a deeper look into Google Analytics. We also introduced Google Tag Manager as a better way to run tracking code on a website.
How to use Adobe Analytics features for data analysis & personalization.pdfTech Modena
How to use Adobe Analytics features for data analysis & personalization
With Adobe Analytics features, businesses can conduct thorough data analysis, uncovering valuable insights that enable effective personalization strategies for delivering tailored and engaging experiences to their audience.
Organizations gather a lot of data to understand customers, improve products, and enhance experiences. But analyzing this data for useful insights can be a challenge. That’s where Adobe Analytics comes in.
Adobe Analytics, part of Adobe Experience Cloud, helps businesses make sense of data from various digital channels. It provides real-time insights, enabling effective marketing campaigns and better customer experiences. Integrated with other Adobe platforms, it enhances audience targeting and marketing activities.
Amidst the noise of data, our experts discuss how Adobe Analytics tackles challenges, making data-driven decisions easier and personalizing experiences for every user.
What is Adobe Analytics?
Adobe Analytics, once known as Omniture SiteCatalyst, is a top-notch tool for analyzing data across various channels. It’s a key component of the Adobe Marketing Cloud, offering plugins for assessing campaign performance not just on websites but also on mobile apps and video platforms.
Adobe Analytics empowers marketers by offering valuable insights to make informed decisions. By leveraging this data, marketers aim to increase revenues, boost conversions, and reduce advertising costs. Success with Adobe Analytics, like any data analytics platform, relies on accurately interpreting marketing metrics derived from available data.
Types of Data Captured by Adobe Analytics
Adobe Analytics gathers data from websites, mobile apps, and other sources to create reports. They call this data metrics or key performance indicators (KPIs), showing quantitative info about your website’s performance. The main tracked metric categories are:
Traffic metrics: Details about your visitors, revealing public attention through marketing, PR, and services.
Conversion metrics: Info on user actions to measure website engagement.
Calculated metrics: Custom metrics you create by combining existing ones.
Video metrics: Stats like total views, time spent, and completion rates.
Social metrics: Data to track your brand’s presence on social media.
To protect privacy, Adobe only collects non-personally identifiable information (PII), like a visitor’s zip code, avoiding sensitive data to ensure individual identity remains safe.
Benefits of Adobe Analytics
Quick Web Insights: Adobe Analytics helps you get speedy results by collecting web data in real-time. It’s like having a super-fast tool to understand what’s happening on your website.
Smart Marketing Know-How: We’re not just about analytics; we cover all the new digital stuff. With Adobe Analytics, you can see everything about your customers in one go, getting smart insights in no time.
Better Choices with Attribution: Figure out what’s
This document provides a beginner's guide to Google Analytics. It discusses initial setup steps like ensuring proper access permissions and linking Webmaster Tools. It also covers implementing the tracking code across websites and maintaining data accuracy through profiles and filters. Additional sections explain custom segmentation, conversion goals, automated reporting, ecommerce tracking, and newer features like multi-channel funnels and visitor flow. The guide aims to help digital marketers measure ROI more efficiently using Google Analytics.
This document provides an overview of Google Analytics presented by Adam Kutner. It begins with introductions and background on Kutner. Then it outlines the topics to be covered, including Google Analytics basics, quick setup, segments, campaign tagging, dashboards, remarketing, demographics, filtering bad traffic, and additional resources. Emphasis is placed on setting up analytics correctly, using segments and dashboards to gain insights, properly tagging campaigns, leveraging remarketing and demographics, and identifying and filtering bad traffic in analytics. Real-world examples and resources are provided throughout.
Google Analytics 4 (GA4) is replacing Universal Analytics with a new data model focused on engagement. Key changes include:
- Combining app and website data with no property views;
- Using an event-based model instead of sessions for new metrics like scrolls and clicks;
- Automatically tracking certain interactions for privacy.
Reporting is also updated with new engagement metrics and exploration tools. OGMC is setting up working groups, migrating sites, and helping explain changes to ensure a smooth transition.
This presentation covers methods to set up Google Analytics on your website. It also includes basic terminologies / jargons / concepts that are used throughout Google Analytics
The document discusses integrating Google Analytics Premium data with Google BigQuery. BigQuery is a big data analytics service that allows users to analyze large datasets quickly. The integration allows clients to access their Google Analytics session and hit level data within BigQuery for more complex querying of unsampled data. This provides benefits like leveraging Google's computing power to get insights from big data faster without hardware costs. Users can also join external data, perform complex queries, and integrate with data warehouses.
Your smarter data analytics strategy - Social Media Strategies Summit (SMSS) ...Clark Boyd
This document provides an overview of developing an effective analytics strategy, covering key topics such as:
- Understanding why an analytics strategy is important for gaining insights from data
- Defining the right questions to ask of your data to address business objectives
- Implementing the right metrics and processes to optimize performance based on data
- Ensuring the right technology, data, people and culture are in place to execute the strategy
- Tips for reporting data to different stakeholders and developing the right analytics team
The presentation emphasizes that an analytics strategy should start by defining business goals and questions, and focus on using data insights to drive tangible improvements rather than just reporting metrics. Both qualitative and quantitative data are important to
This document provides an agenda for a Google Analytics training session. The agenda includes topics such as getting started with Google Analytics, navigating the interface, audience, acquisition, behavior, and conversion reports. It also covers account administration, advanced tracking implementations, measuring content, importing and extracting data, and common applications of Google Analytics. The training emphasizes using Google Analytics for analysis rather than just reporting, and how to tell data-driven stories to different audiences. It provides best practices for setting up views and segments, understanding users, tracking campaigns and visitor engagement, and setting up conversion goals.
Power Digital - GA4 & BigQuery - CBUS WAW - Scott Zakrajsek.pdfTim Wilson
Scott Zakrajsek's presentation at Columbus Web Analytics Wednesday in November 2023—a brief overview of Google Analytics 4, how and why it integrates with Google BigQuery, and some of the basics of getting that data back out of BigQuery using SQL.
This document provides an introduction to Google Analytics for web developers. It discusses how Google Analytics can be used to track and understand visitor traffic, flows, and engagement on a website. It also describes how the Google Analytics tracking code works to collect anonymous visitor data and send it to Google's servers. Finally, it covers some key aspects of setting up and using Google Analytics, including dimensions, metrics, event tracking, and cross-device attribution.
Google Analytics Conference and Product ReleasesBen Brooks
The document summarizes the agenda and key topics from the 2013 Google Analytics Partner Conference. It discusses expanding access to analytics through tools that more easily capture data, attribute conversions across devices and channels, and provide deeper analysis through features like content grouping, segmentation, and demographic data. New opportunities mentioned include using multichannel attribution modeling, automatic link tracking, and the updated mobile SDK to improve analytics across devices and platforms.
This presentation includes basic of PCOS their pathology and treatment and also Ayurveda correlation of PCOS and Ayurvedic line of treatment mentioned in classics.
Exploiting Artificial Intelligence for Empowering Researchers and Faculty, In...Dr. Vinod Kumar Kanvaria
Exploiting Artificial Intelligence for Empowering Researchers and Faculty,
International FDP on Fundamentals of Research in Social Sciences
at Integral University, Lucknow, 06.06.2024
By Dr. Vinod Kumar Kanvaria
Executive Directors Chat Leveraging AI for Diversity, Equity, and InclusionTechSoup
Let’s explore the intersection of technology and equity in the final session of our DEI series. Discover how AI tools, like ChatGPT, can be used to support and enhance your nonprofit's DEI initiatives. Participants will gain insights into practical AI applications and get tips for leveraging technology to advance their DEI goals.
Introduction to AI for Nonprofits with Tapp NetworkTechSoup
Dive into the world of AI! Experts Jon Hill and Tareq Monaur will guide you through AI's role in enhancing nonprofit websites and basic marketing strategies, making it easy to understand and apply.
How to Manage Your Lost Opportunities in Odoo 17 CRMCeline George
Odoo 17 CRM allows us to track why we lose sales opportunities with "Lost Reasons." This helps analyze our sales process and identify areas for improvement. Here's how to configure lost reasons in Odoo 17 CRM
বাংলাদেশের অর্থনৈতিক সমীক্ষা ২০২৪ [Bangladesh Economic Review 2024 Bangla.pdf] কম্পিউটার , ট্যাব ও স্মার্ট ফোন ভার্সন সহ সম্পূর্ণ বাংলা ই-বুক বা pdf বই " সুচিপত্র ...বুকমার্ক মেনু 🔖 ও হাইপার লিংক মেনু 📝👆 যুক্ত ..
আমাদের সবার জন্য খুব খুব গুরুত্বপূর্ণ একটি বই ..বিসিএস, ব্যাংক, ইউনিভার্সিটি ভর্তি ও যে কোন প্রতিযোগিতা মূলক পরীক্ষার জন্য এর খুব ইম্পরট্যান্ট একটি বিষয় ...তাছাড়া বাংলাদেশের সাম্প্রতিক যে কোন ডাটা বা তথ্য এই বইতে পাবেন ...
তাই একজন নাগরিক হিসাবে এই তথ্য গুলো আপনার জানা প্রয়োজন ...।
বিসিএস ও ব্যাংক এর লিখিত পরীক্ষা ...+এছাড়া মাধ্যমিক ও উচ্চমাধ্যমিকের স্টুডেন্টদের জন্য অনেক কাজে আসবে ...
हिंदी वर्णमाला पीपीटी, hindi alphabet PPT presentation, hindi varnamala PPT, Hindi Varnamala pdf, हिंदी स्वर, हिंदी व्यंजन, sikhiye hindi varnmala, dr. mulla adam ali, hindi language and literature, hindi alphabet with drawing, hindi alphabet pdf, hindi varnamala for childrens, hindi language, hindi varnamala practice for kids, https://www.drmullaadamali.com
How to Add Chatter in the odoo 17 ERP ModuleCeline George
In Odoo, the chatter is like a chat tool that helps you work together on records. You can leave notes and track things, making it easier to talk with your team and partners. Inside chatter, all communication history, activity, and changes will be displayed.
This slide is special for master students (MIBS & MIFB) in UUM. Also useful for readers who are interested in the topic of contemporary Islamic banking.
The simplified electron and muon model, Oscillating Spacetime: The Foundation...RitikBhardwaj56
Discover the Simplified Electron and Muon Model: A New Wave-Based Approach to Understanding Particles delves into a groundbreaking theory that presents electrons and muons as rotating soliton waves within oscillating spacetime. Geared towards students, researchers, and science buffs, this book breaks down complex ideas into simple explanations. It covers topics such as electron waves, temporal dynamics, and the implications of this model on particle physics. With clear illustrations and easy-to-follow explanations, readers will gain a new outlook on the universe's fundamental nature.
7. Author. If you run a multi-author blog, you could create a custom
dimension to capture "Author" data from your website. Then, create a
custom report with Author as the primary dimension to measure
differences between authors. To grow your business, ask the author
with the most pageviews to write more.
Example Custom Dimensions
1. Custom Dimensions
Other Examples: Shipping Methods, Logged In Users, Member Types (Free, Paid,
Basic, Gold, Platinum) etc.
16. Custom metrics enable you to unlock some really great reports
like this:
Example Custom Metrics
2. Custom Metrics
2. Custom Metrics
Examples: With the above custom metrics in place, we can see the impact
of discounting / sales / promotions etc on any product brand.
41. 5. Segments
5. Segments
Converters vs. Non-Converters. Compare the behavior of visitors
who converted versus those who didn’t. Are there any differences in
the age, gender, or interests? Understand the factors that are helping
to drive conversions and optimize marketing to encourage
conversions.
High-Value Customers. Isolate those big spenders to understand
who they are, how they behave and what makes them different. Target
them in future acquisition campaigns and optimize your site and
retention campaigns to encourage average customers to start
behaving like high-value customers.
One-Time Buyers vs. Multi-Buyers. What separates the one-time
buyers from the multi-buyers? Do they have a tendency to buy
products from specific categories? Make changes to encourage one-
time buyers to start behaving like multi-buyers customers.
Examples Segments