This document provides guidance on developing user requirements for software projects. It discusses the importance of requirements modeling and describes various models that can be used, including use cases, actor maps, data models, and state diagrams. The models are categorized based on the type of information they represent and relate to each other. Following good practices for requirements modeling, such as defining project scope and engaging stakeholders, helps ensure requirements are correct, complete, clear and consistent.
![Good Practices for Developing User
Requirements©
Ellen Gottesdiener, EBG Consulting
Defining user requirements – the needs of the stakeholders who directly interact
with the system – is arguably one of the most difficult challenges in building
complex systems. When it comes to defining user requirements for software, it is
essential to use models to document and analyze the requirements. This article
provides a requirements model roadmap that helps software development teams
understand the effective use of requirements models. It also describes good
practices for creating and using these models.
Many software developers have a love-hate relationship with requirements. They
love having a list of things they need to engineer into the product they are building,
but they hate it when the requirements are unclear, inaccurate, self-contradictory,
or incomplete. They are right to be concerned.
The price is high for teams that fail to define requirements or that do it poorly. Ill-
defined requirements result in requirements defects, and the consequences of these
defects are ugly [1- 6]:
• Expensive rework and cost overruns.
• A poor quality product.
• Late delivery.
• Dissatisfied customers.
• Exhausted and demoralized team members.
To reduce the risk of software project failure and the costs associated with defective
requirements, project teams must address requirements early in software
development and they must define requirements properly.
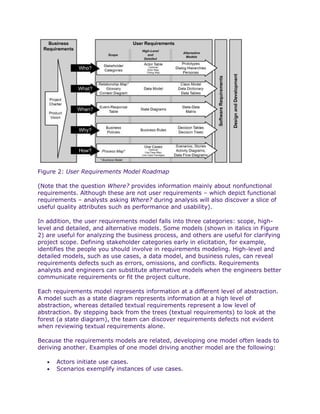
A Short Review of Requirements
Before we get to the nitty-gritty of building requirements models, let us look at
some basic requirements concepts. User requirements – the focus of this article –
are one of three types of requirements (see Figure 1). The other two types are
those related to the mission or business and those that describe the software itself.](https://image.slidesharecdn.com/goodpracticesfordevelopinguserrequirements-100112150647-phpapp01/85/Good-Practices-For-Developing-User-Requirements-1-320.jpg)
![Good Practices for Developing User
Requirements©
Ellen Gottesdiener, EBG Consulting
Defining user requirements – the needs of the stakeholders who directly interact
with the system – is arguably one of the most difficult challenges in building
complex systems. When it comes to defining user requirements for software, it is
essential to use models to document and analyze the requirements. This article
provides a requirements model roadmap that helps software development teams
understand the effective use of requirements models. It also describes good
practices for creating and using these models.
Many software developers have a love-hate relationship with requirements. They
love having a list of things they need to engineer into the product they are building,
but they hate it when the requirements are unclear, inaccurate, self-contradictory,
or incomplete. They are right to be concerned.
The price is high for teams that fail to define requirements or that do it poorly. Ill-
defined requirements result in requirements defects, and the consequences of these
defects are ugly [1- 6]:
• Expensive rework and cost overruns.
• A poor quality product.
• Late delivery.
• Dissatisfied customers.
• Exhausted and demoralized team members.
To reduce the risk of software project failure and the costs associated with defective
requirements, project teams must address requirements early in software
development and they must define requirements properly.
A Short Review of Requirements
Before we get to the nitty-gritty of building requirements models, let us look at
some basic requirements concepts. User requirements – the focus of this article –
are one of three types of requirements (see Figure 1). The other two types are
those related to the mission or business and those that describe the software itself.](https://image.slidesharecdn.com/goodpracticesfordevelopinguserrequirements-100112150647-phpapp01/75/Good-Practices-For-Developing-User-Requirements-1-2048.jpg)
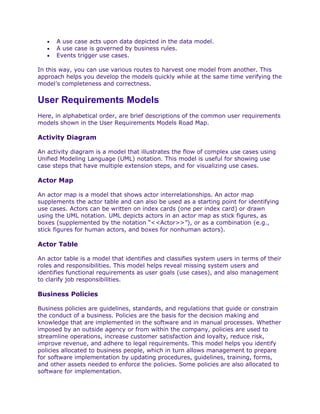
![Figure 1: Requirements Levels
Business requirements are statements of the business rationale for the project.
These requirements grow out of the vision for the product which, in turn, is driven
by mission (or business) goals and objectives. The product’s vision statement
articulates a long-term view of what the product will accomplish for its users. It
should include a statement of scope to clarify which capabilities are and are not to
be provided by the product.
User requirements define the software requirements from the user’s point of view,
describing the tasks users need to accomplish with the product and the quality
requirements of the software from the user’s point of view. Users can be broadly
defined to include not only the people who access the system but also
inanimate users such as hardware devices, databases, and other systems. In the
systems produced by most government organizations, user requirements are
articulated in their concept of operations document.
Software requirements are detailed descriptions of all the functional and
nonfunctional requirements the software must fulfill to meet business and user
needs. Nonfunctional requirements include software design constraints, external
interfaces, and quality attributes such as performance, security, installation ability,
availability, safety, reusability, and more [7]. Software requirements, which are](https://image.slidesharecdn.com/goodpracticesfordevelopinguserrequirements-100112150647-phpapp01/85/Good-Practices-For-Developing-User-Requirements-2-320.jpg)
![documented in a software requirements specification, establish an agreement
between technical specialists and business managers on what the product must do.
The key activities in requirements development are the
following: elicitation, analysis,specification, and validation [8]. In elicitation, you
identify the sources of requirements and solicit requirements from those sources.
Requirements elicitation relies on appropriate stakeholder involvement, one of the
most critical elements for project success [9]. The goal of requirements analysis is
to sufficiently understand and define the requirements so that stakeholders can
prioritize and allocate them to software. Specification involves differentiating and
documenting functional and nonfunctional requirements and checking that the
requirements are documented unambiguously and completely. Validation examines
the requirements to ensure that they satisfy user’s needs.
Elicitation and analysis are crucial early activities that require intense stakeholder
involvement. To analyze the requirements you are eliciting, a key good practice is
to createrequirements models (also referred to as analysis models): user
requirements represented by text (such as tables, lists, or matrices), diagrams, or a
combination of text and graphical material [7]. These models facilitate
communications about requirements with your stakeholders.
As you elicit requirements from stakeholders and represent them using
requirements models, you should verify your models to ensure they are internally
consistent. You also need to prioritize your requirements: With active user
involvement, you analyze the trade-offs among requirements to establish their
relative importance [8].
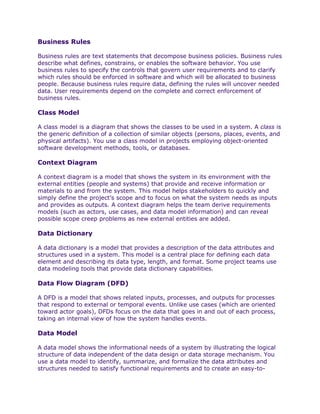
The User Requirements Model Roadmap
Now let us take a closer look at user requirements models. The beauty of the
Requirements Model Road Map (Figure 2) is that it shows the relationships between
the three types of requirements (business, user, and software) and categorizes the
models you can use to represent each type. Each model is designed to answer one
of the 5Ws + 1H questions:Who? What? When? Why? How? [7].](https://image.slidesharecdn.com/goodpracticesfordevelopinguserrequirements-100112150647-phpapp01/85/Good-Practices-For-Developing-User-Requirements-3-320.jpg)

![Use Case Package
The use case package is a logical, cohesive group of use cases that represents
higher level system functionality. You create a use case package by combining use
case maps or grouping use cases. Most systems will have multiple packages. You
can use a UML file folder notation to show each package, and you can name each
package according to its functionality.
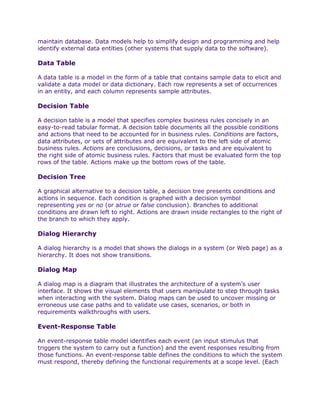
Good Practices for Modeling User Requirements
Following good requirements modeling practices (see Good Practices for Modeling
User Requirements, Table 1) is the key to successful development of user
requirements. These practices accelerate modeling, engage stakeholders, and give
you high-quality requirements – ones that are correct, complete, clear, consistent,
and relevant.
Table 1: Summary: Good Practices for Modeling User Requirements
The first good practice is to represent and agree on the project’s scope early in
requirements elicitation. Why? It has to do with scope creep – the unrestrained
expansion of requirements as the project proceeds. Scope creep is one of the
greatest risks in software development [6]. A clear definition of product scope
narrows the project’s focus to enable better planning, better use of time, and better
use of resources. Moreover, scope-level models establish a common language that
team members can use to communicate about the requirements and help to
articulate the boundary between what is in and what is not in scope for the product.
Another good practice, as mentioned earlier, is to document your product using
multiple user requirements models. Each model describes one aspect of a problem
the product will address. Thus, no single model can describe all the requirements.
Furthermore, elements of one model often link to elements of another, so one
model can be used to uncover related or missing elements in another model.
It is also good to use both text and graphics to represent user needs. Multiple
representations tap into different modes of human thinking. Some people think](https://image.slidesharecdn.com/goodpracticesfordevelopinguserrequirements-100112150647-phpapp01/85/Good-Practices-For-Developing-User-Requirements-10-320.jpg)
![more precisely with words, and others understand concepts more quickly via
diagrams. Using both types of representations leverages these different thinking
modes. In addition, mixing text and graphics makes requirements development
more interesting and engaging. It provides variety and permits stakeholders to
understand their requirements from more than one angle.
You should also select models that fit the domain of your product. That is because
some models are better suited to communicate requirements for certain domains.
For example,When models (such as an event-response table and a state machine
diagram) are well suited to dynamic domains – those that respond to continually
changing events to store data and act on it based on its state at a point.
Another well-known good practice is to develop your requirements iteratively. Each
iteration is a self-contained mini-project in which you undertake a set of activities –
elicitation, analysis, specification, and validation – resulting in a subset of
requirements. The rationale for this practice is that user requirements seldom
remain unchanged for a long period. On teams using agile methods, each iteration
also incorporates the work needed to deliver the working software that satisfies
those requirements. In some domains, requirements change faster than the system
or subsystem can be developed. In addition, the cost of implementing changes
increases dramatically as the project proceeds. Developing requirements in an
evolving manner is essential in reducing these risks.
You can also use requirements models to identify requirements defects. The
interconnections among the models help to expose any inconsistencies in related
models. This self-checking accelerates the team’s ability to uncover missing,
erroneous, vague, or conflicting requirements.
When you are creating graphical models, it is crucial to create simple, readable
diagrams. The benefit of diagrams is that they give you a way to quickly
communicate complex, controversial, or unclear requirements. Thus, you should
avoid complex, hard-to-read diagrams. Draw diagrams manually to begin with or
use an easy-to-learn drawing tool. Keep them simple and easy to read. Focus on
maintaining accuracy and exposing unclear or incorrect requirements – not beauty
or completeness.
The final good practice I want to mention applies whether or not you are using
modeling: I always tell my clients to conduct short retrospectives at the end of each
requirements iteration. A retrospective is a special meeting in which the team
explores what works, what does not work, what can be learned from the just
completed iteration, and what ways to adapt their processes and techniques before
starting another iteration [10, 11]. Retrospectives allow for early learning and
correction and may be your team’s most powerful tool for process improvement.](https://image.slidesharecdn.com/goodpracticesfordevelopinguserrequirements-100112150647-phpapp01/85/Good-Practices-For-Developing-User-Requirements-11-320.jpg)


