Download to read offline


![Aadil Ahmad, Mohd. Parvez / International Journal of Engineering Research and Applications
(IJERA) ISSN: 2248-9622 www.ijera.com
Vol. 3, Issue 4, Jul-Aug 2013, pp.
1201 | P a g e
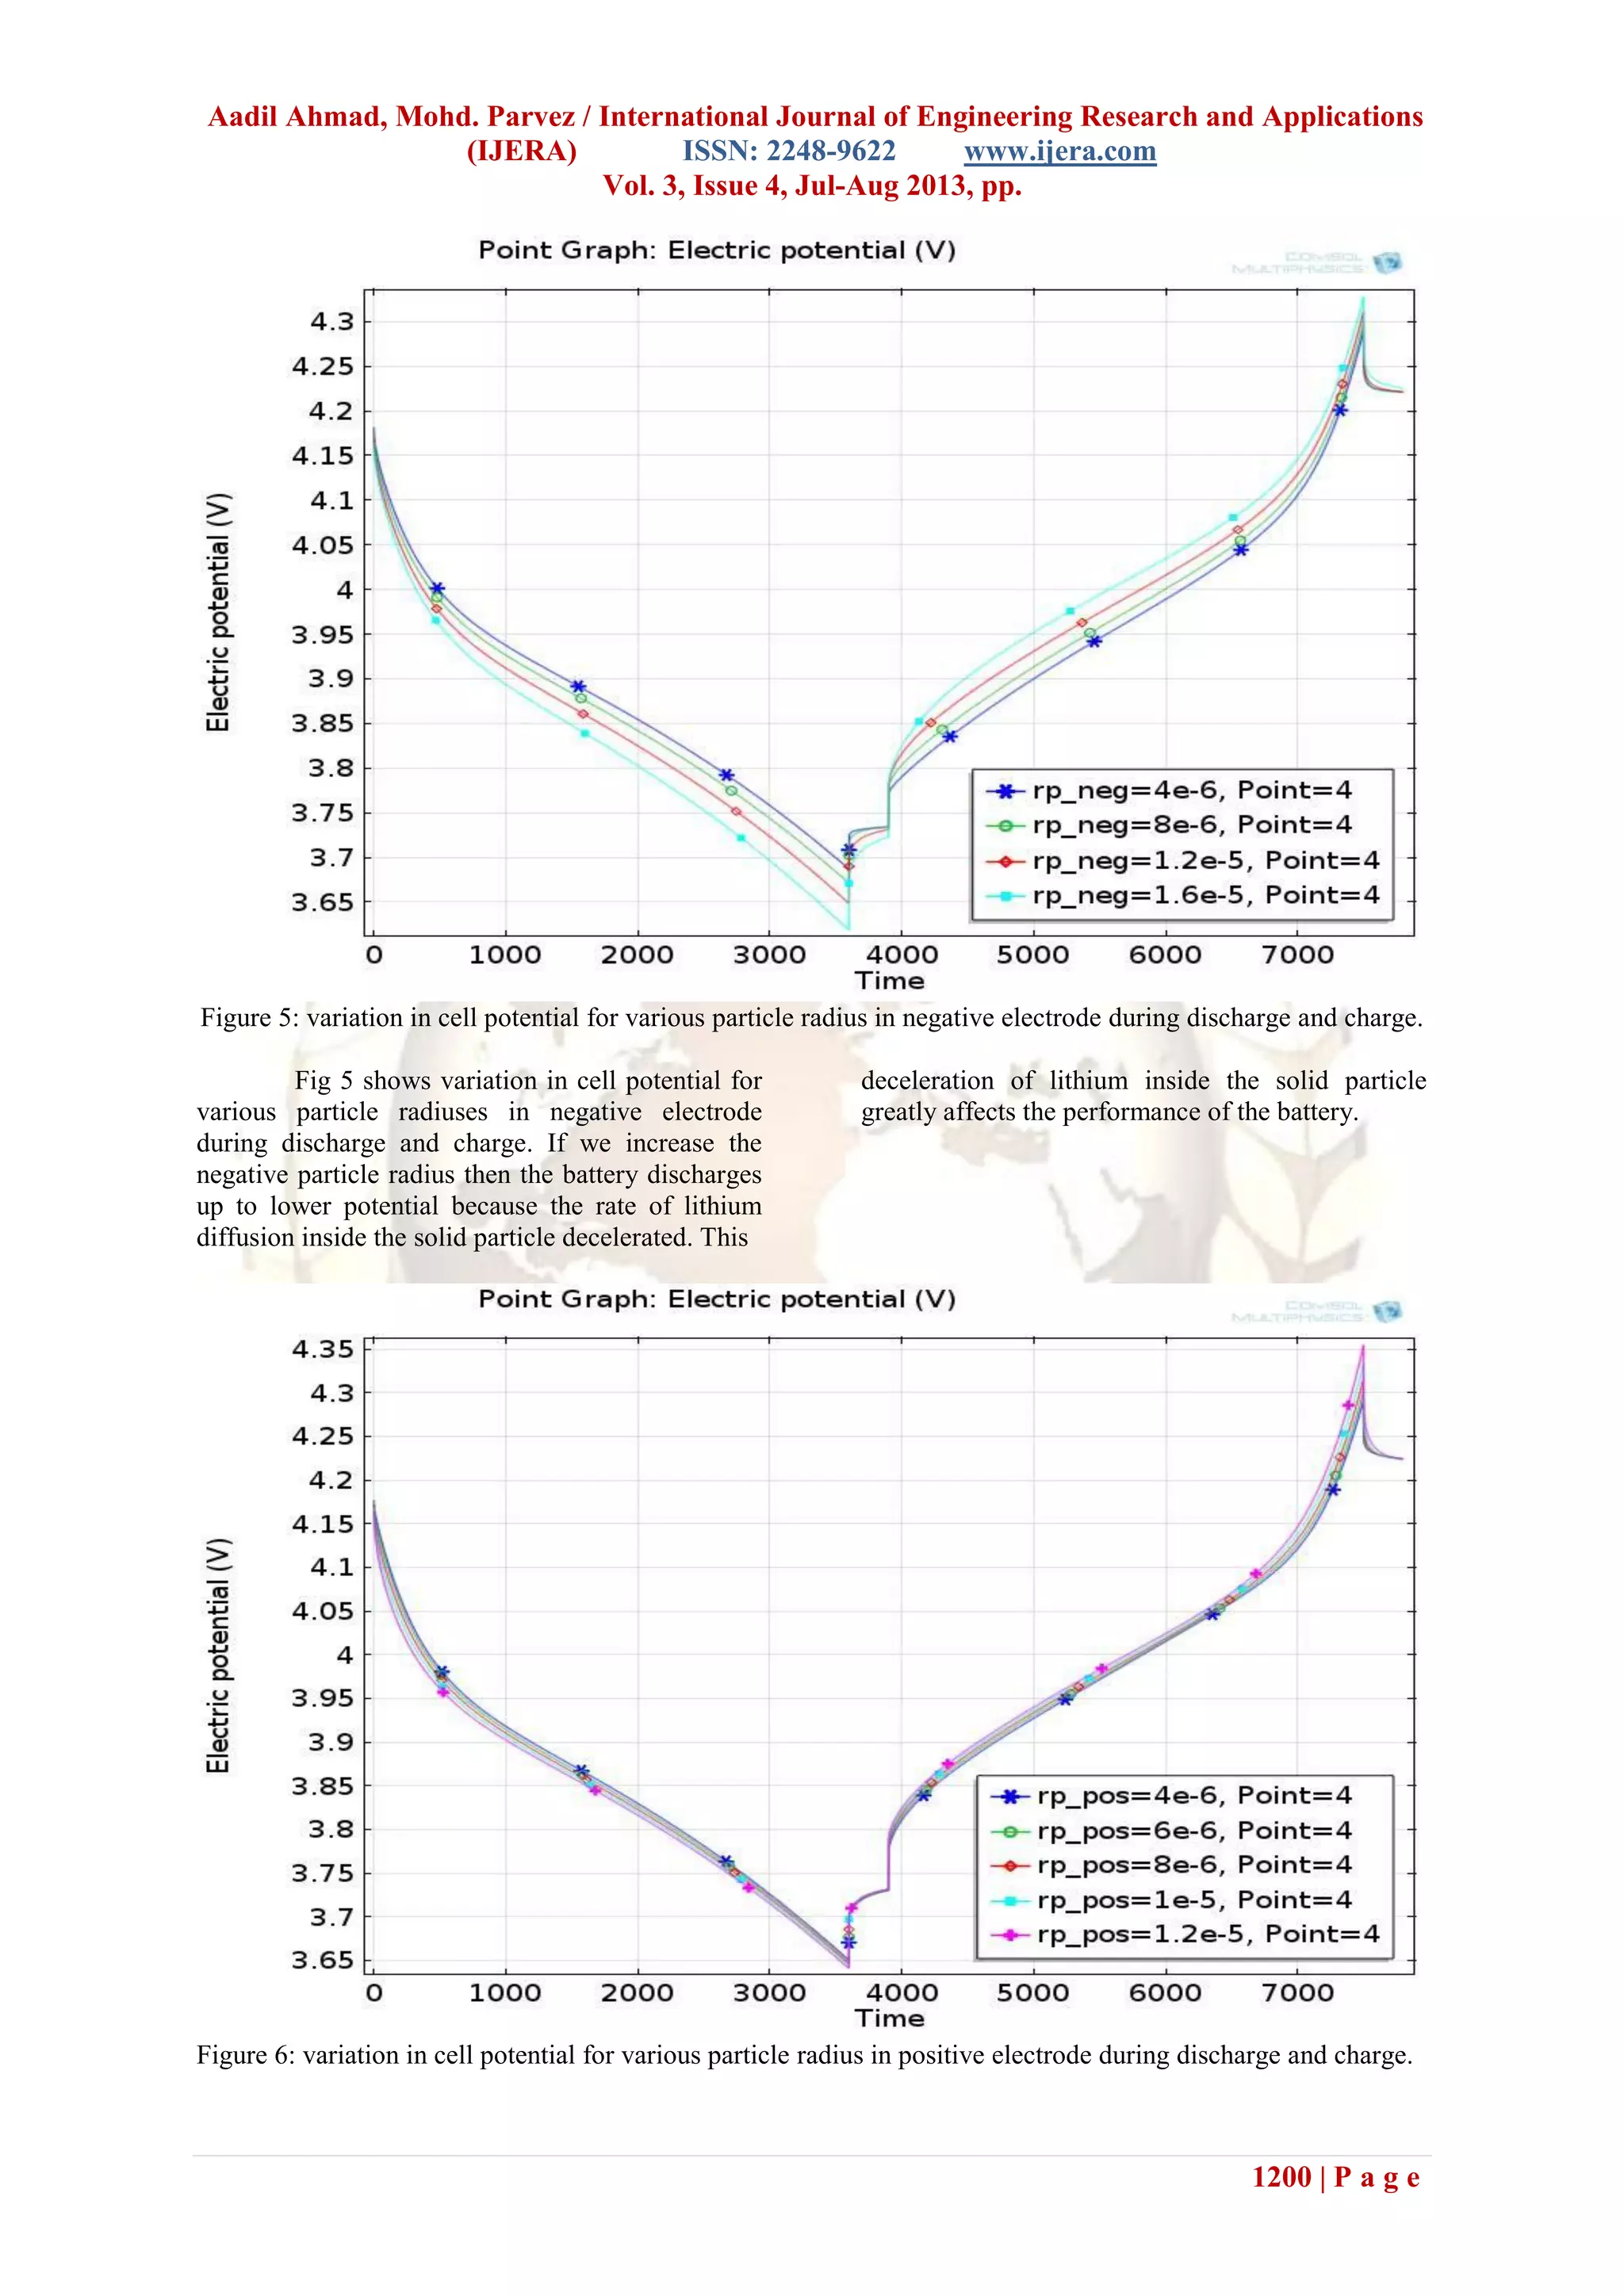
Fig 6 shows variation in cell potential for
various particle radiuses in positive electrode during
discharge and charge. If we increase the positive
particle radius then the battery discharges up to
lower potential because the rate of lithium diffusion
inside the solid particle decelerated. This
deceleration of lithium inside the solid particle
greatly affects the performance of the battery. But if
we see the graph of battery capacity for positive and
negative electrode then the variation for positive
electrode radius shows small variation in battery
performance.
V. Conclusion and future scope
VI. Conclusion
The result obtained by the plotting the
graph between battery potential with time for
discharging and charging are different. These graph
shows the battery capacity variation more when we
change the negative radius particle of lithium ion
and or negative porosity . While the graph obtained
by changing the positive electrode or positive
porosity is less.
So these graph shows that if we increase
the positive lithium ion radius or porosity then it
performance does not vary more.
VII. Future scope
These result obtained by the plotting the
graph between battery potential with respect to time
by the comsol multyphysics software. Here the only
two parameter that can vary lithium ion particle
radius and porosity and keeping other thing constant
. These result are obtained by software and need
practical scope. I have done this by software if i
acquire financial aid then I can validate these result
experimentally. Using experimental setup we can
also investigate the effect of varying electrode
thickness, electrode and electrolyte material,
conductivity additives and binders over the
performance and behavior of lithium ion battery
Reference
[1] I. M. Development, “Micro-Macroscopic
Coupled Modeling of Batteries and Fuel
Cells,” vol. 145, no. 10, pp. 3407–3417,
1998.
[2] S. Santhanagopalan, Q. Guo, and R. E.
White, “Parameter Estimation and Model
Discrimination for a Lithium-Ion Cell,”
Journal of The Electrochemical Society,
vol. 154, no. 3, p. A198, 2007.
[3] G.-H. Kim, K. Smith, K.-J. Lee, S.
Santhanagopalan, and A. Pesaran, “Multi-
Domain Modeling of Lithium -Ion
Batteries Encompassing Multi-Physics in
Varied Length Scales,” Journal of The
Electrochemical Society, vol. 158, no. 8, p.
A955, 2011.
[4] N. Taniguchi, K. Hatoh, J. Niikura, T.
Gamo, M. Doyle, and J. Newman,
“Comparison of Modeling Predictions with
Experimental Data from Plastic Lithium
Ion Cells,” vol. 143, no. 6, pp. 1890–1903,
1996.
[5] L. Cai and R. E. White, “Mathematical
modeling of a lithium ion battery with
thermal effects in COMSOL Inc.
Multiphysics (MP) software,” Journal of
Power Sources, vol. 196, no. 14, pp. 5985–
5989, Jul. 2011.
[6] J. Yan, B.-J. Xia, Y.-C. Su, X.-Z. Zhou, J.
Zhang, and X.-G. Zhang,
“Phenomenologically modeling the
formation and evolution of the solid
electrolyte interface on the graphite
electrode for lithium-ion batteries,”
Electrochimica Acta, vol. 53, no. 24, pp.
7069–7078, Oct. 2008.
[7] S. Biallozor, “Modeling Side Reactions in
Composite LiMn2O4 Electrodes,” vol. 145,
no. 3, pp. 990–998, 1998.
. [8] G. G. Botte, V. R. Subramanian, and R. E.
White, “Mathematical modeling of
secondary lithium batteries,”
Electrochimica Acta, vol. 45, no. 15–16,
pp. 2595–2609, May 2000.
[9] M. Doyle, T. F. Fuller, and J. Newman,
“Modeling of Galvanostatic Charge and
Discharge of the Lithium / Polymer /
Insertion Cell,” vol. 140, no. 6, pp. 1526–
1533, 1993.
[10] T. F. Fuller, M. Doyle, and J. Newman,
“TECHNICAL PAPERS
ELECTROCHEMICAL SCIENCE AND
TECHNOLOGY Simulation and
Optimization of the Dual Lithium Ion
Insertion Cell,” vol. 141, no. 1, 1994.](https://image.slidesharecdn.com/go3411961201-130718234928-phpapp02/75/Go3411961201-6-2048.jpg)

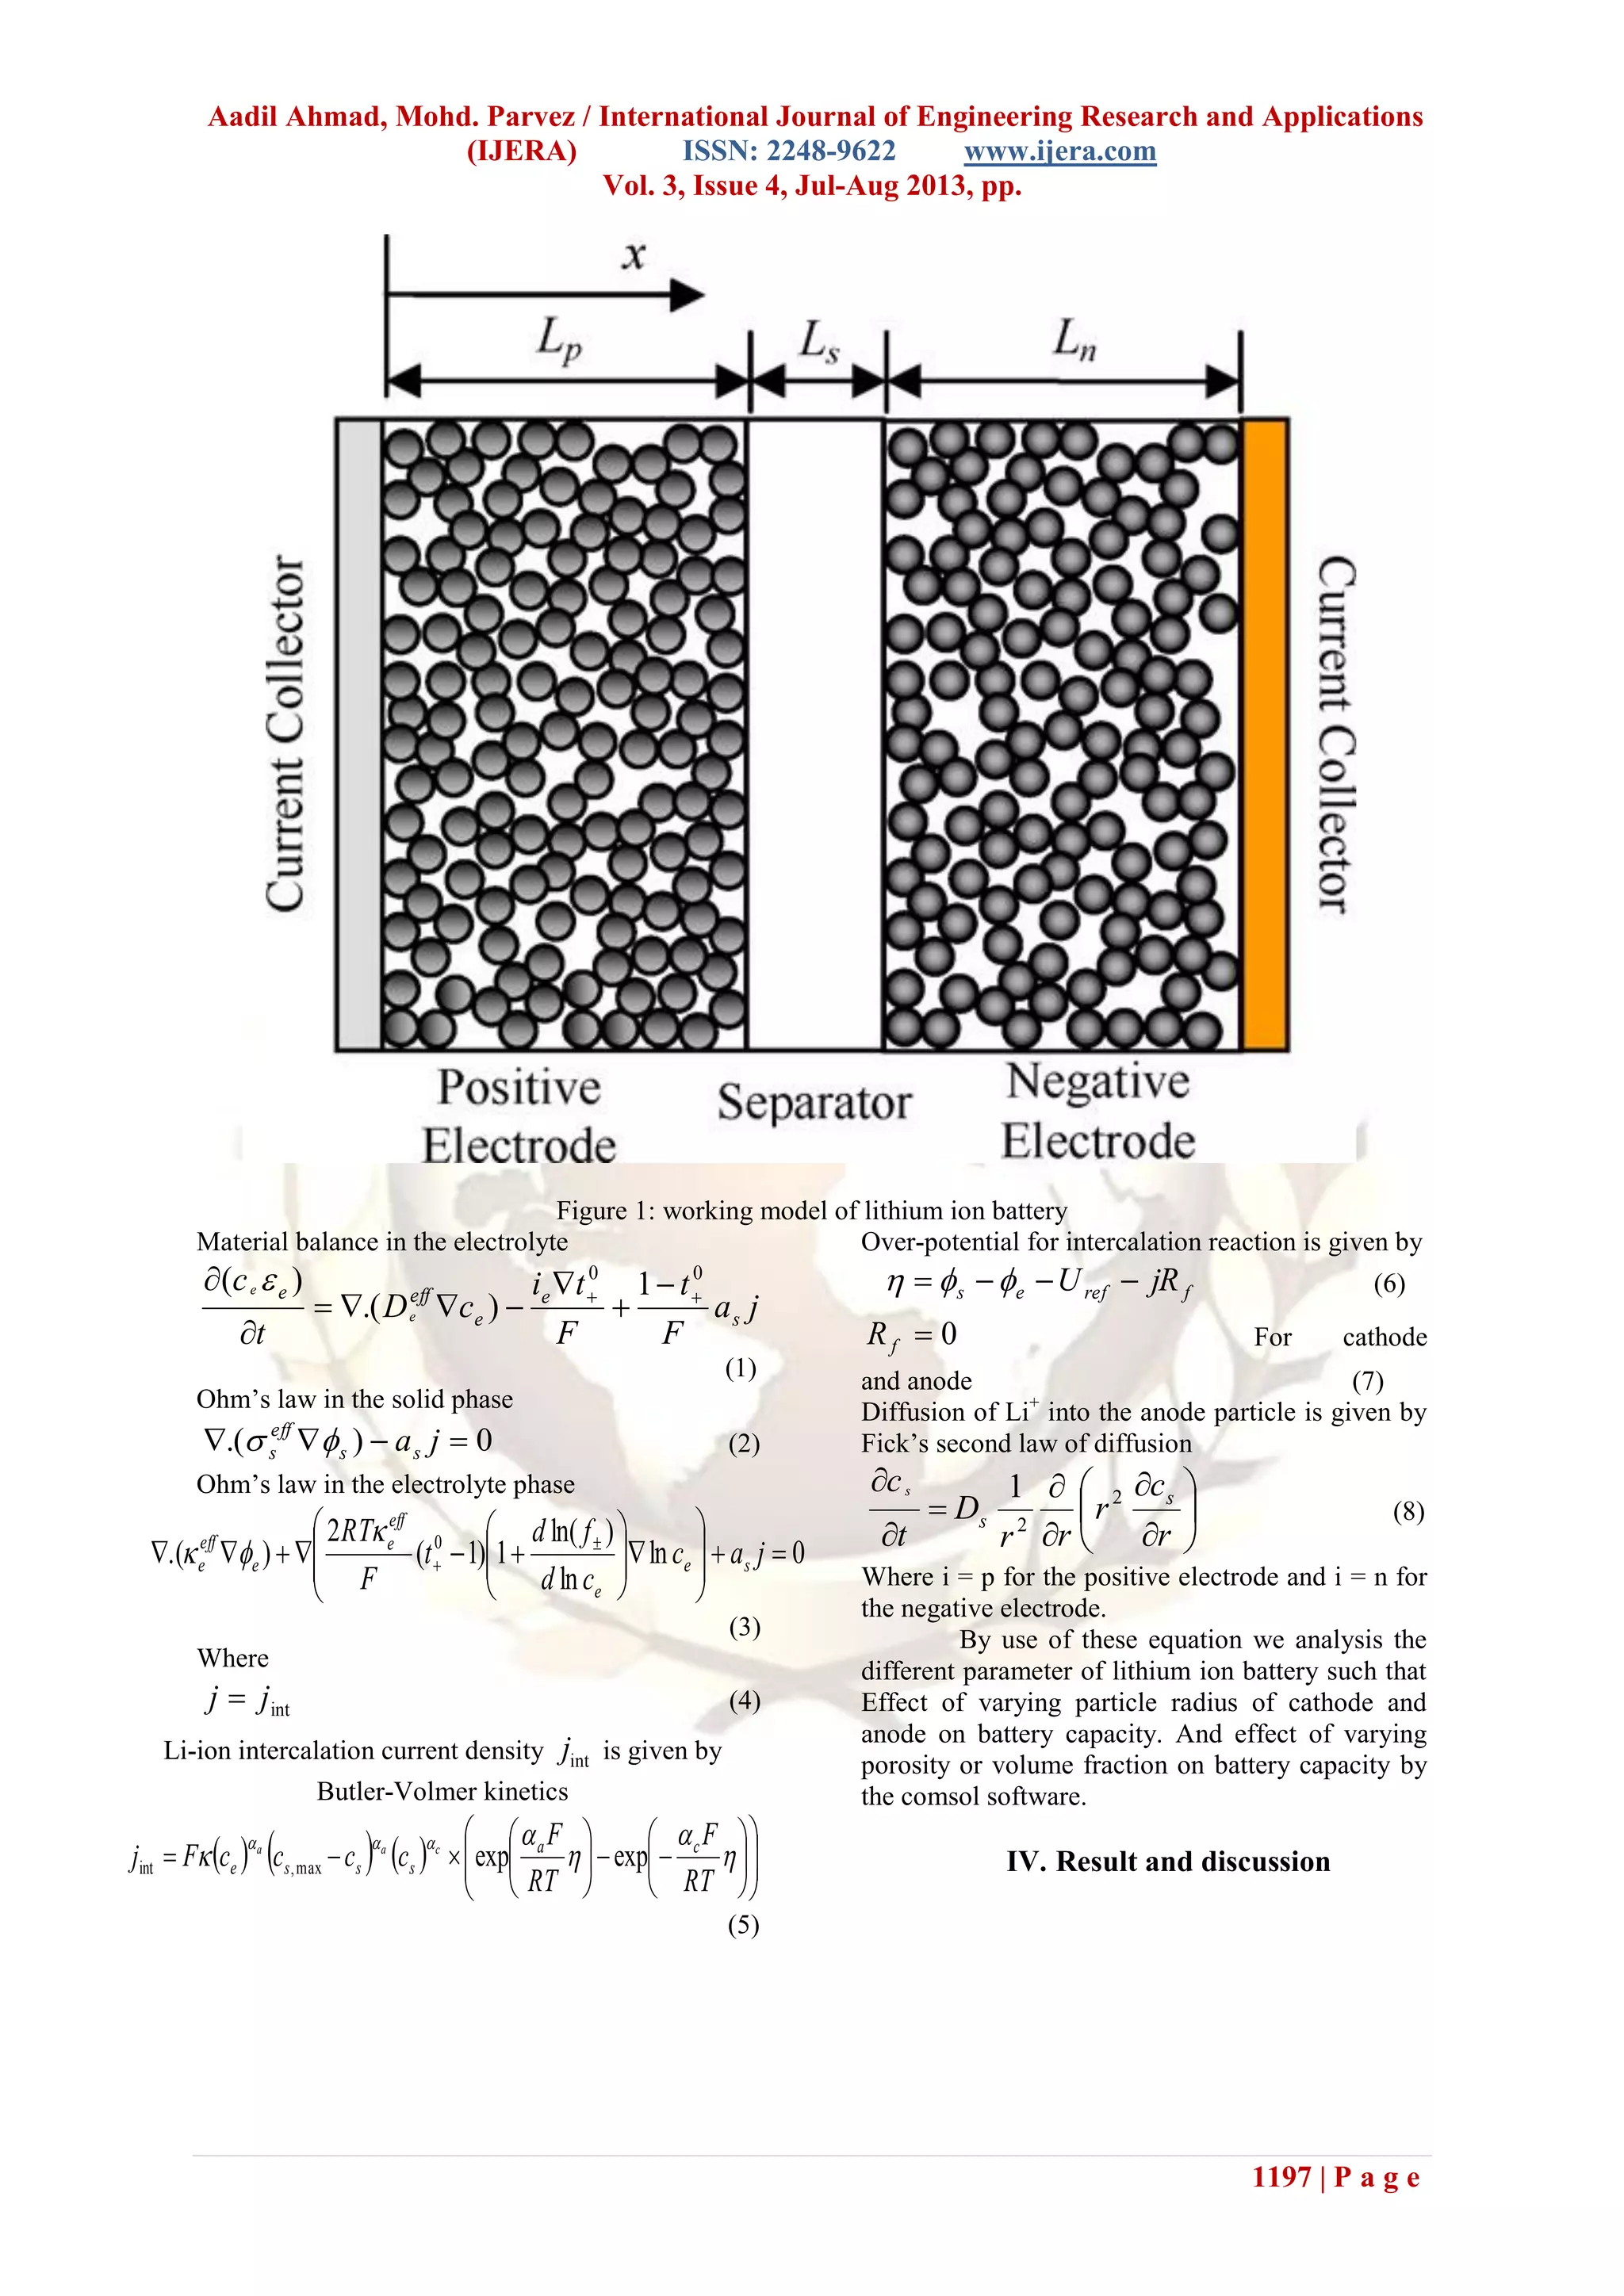
This study investigates how design parameters like porosity and particle radius of lithium-ion battery electrodes affect battery capacity and performance. The results indicate that increasing the negative electrode's porosity and particle radius significantly impacts battery discharge behavior, while changes in the positive electrode exhibit minimal effects. Future work aims to experimentally validate these findings and explore additional factors influencing battery performance.


