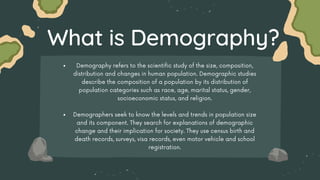
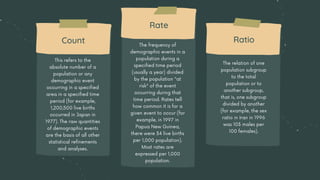
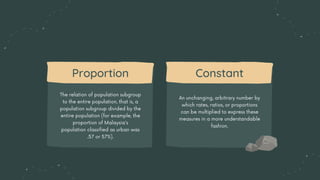
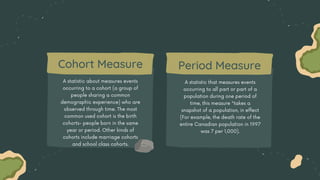
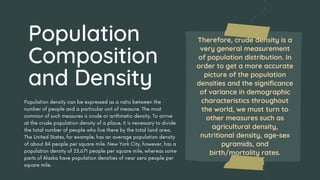
Global
Demography
The Changes in Society
Lesson Outline
Population Ecology Demogra
phy
The tools of
Demography
Population
Composition
and Density
Fertility
Mortality Migration
Population and Ecology are closely related to
each other. The growth of population can be a
burden to the environment, depleting its
resources and threatening human and animal
life.
What is
Population?
Demography refers to the scientific study of the size, composition,
distribution and changes in human population. Demographic studies
describe the composition of a population by its distribution of
population categories such as race, age, marital status, gender,
socioeconomic status, and religion.
Demographers seek to know the levels and trends in population size
and its component. They search for explanations of demographic
change and their implication for society. They use census birth and
death records, surveys, visa records, even motor vehicle and school
registration.
What is Demography?
The Tools
of
Demogra-
phy
This refers to the
absolute number of a
population or any
demographic event
occurring in a specified
area in a specified time
period (for example,
1,200,500 live births
occurred in Japan in
1977). The raw quantities
of demographic events
are the basis of all other
statistical refinements
and analyses.
The frequency of
demographic events in a
population during a
specified time period
(usually a year) divided
by the population "at
risk" of the event
occurring during that
time period. Rates tell
how common it is for a
given event to occur (for
example, in 1997 in
Papua New Guinea,
there were 34 live births
per 1,000 population).
Most rates are
expressed per 1,000
population.
The relation of one
population subgroup
to the total
population or to
another subgroup,
that is, one subgroup
divided by another
(for example, the sex
ratio in Iran in 1996
was 103 males per
100 females).
Count
Rate
Ratio
The relation of population subgroup
to the entire population, that is, a
population subgroup divided by the
entire population (for example, the
proportion of Malaysia's
population classified as urban was
.57 or 57%).
Proportion
An unchanging, arbitrary number by
which rates, ratios, or proportions
can be multiplied to express these
measures in a more understandable
fashion.
Constant
A statistic about measures events
occurring to a cohort (a group of
people sharing a common
demographic experience) who are
observed through time. The most
common used cohort is the birth
cohorts- people born in the same
year or period. Other kinds of
cohorts include marriage cohorts
and school class cohorts.
A statistic that measures events
occurring to all part or part of a
population during one period of
time, this measure "takes a
snapshot of a population, in effect
(For example, the death rate of the
entire Canadian population in 1997
was 7 per 1,000).
Cohort Measure Period Measure
Population density can be expressed as a ratio between the
number of people and a particular unit of measure. The most
common of such measures is crude or arithmetic density. To arrive
at the crude population density of a place, it is necessary to divide
the total number of people who live there by the total land area.
The United States, for example, has an average population density
of about 84 people per square mile. New York City, however, has a
population density of 23,671 people per square mile, whereas some
parts of Alaska have population densities of near zero people per
square mile.
Therefore, crude density is a
very general measurement
of population distribution. In
order to get a more accurate
picture of the population
densities and the significance
of variance in demographic
characteristics throughout
the world, we must turn to
other measures such as
agricultural density,
nutritional density, age-sex
pyramids, and
birth/mortality rates.
Population
Composition
and Density
In terms of populations rather than individuals, fertility is usually
expressed using the proxy measure of birth rate, either crude or
standardised for age and sex. Worldwide, there are significant
differences between birth rates. A major study in the 1980s, carried out
by the Population Division of the Department of International Economic
and Social Affairs of the UN Secretariat, studied the relationship
between population age and sex distribution and crude fertility rates
for twenty one countries in the developing world. They concluded, the
higher the birthrate the more markedly the birthrate is depressed by
the age structure. All other things being equal, fertility should decline
more rapidly in the countries where it is currently lowest since the age
structure appears to favor such a course.
Fertility
The mean number of children ever born also ranged widely among the
twenty one countries. Differences in completed family size range from 8.6
children in Jordan to 5.2 children in Indonesia. 1 In the developed world,
though, there is a global tendency for family sizes on average to be
smaller than the replacement level. The "replacement level of fertility" is
the number that causes a country's population to slow down and eventually
stabilize. According to the CIA World Factbook's 2014 data the Total
Fertility Rate for women is below 2 children for North
America, Brazil, all the EU states except France, Russia, China, and
Australasia, while women in most of sub-Saharan Africa has between 3 and
7 children on average.
Fertility
The effect of mortality on population
structures is to reduce the component of
the population in which the mortality
occurs. Historically, the most dangerous
ages were infancy and old age (variously
reckoned according to circumstances). In
addition, some epidemics of infectious
diseases (e.g. Spanish 'flu) had their
highest mortality among young adults,
whose immune systems were presumably
insufficiently primed. It is expected that
the forecast bird 'flu epidemic will
behave similarly. War differentially
reduces the proportion of younger men.
The majority of infectious diseases of
early childhood have been reduced by
immunization, and improved nutrition and
hygiene have rendered childhood safer.
Mortality Antibiotics, welfare state, and improvements
in medical, surgical, and palliative care have
resulted in great increases in life expectancy
in the developed world, where life
expectancy is now in the middle to upper
70s or lower 80s, and rising every year. The
effect of this is to raise the population in the
upper age groups substantially. Women have
higher life expectancy than men wherever
they live. The tendency of people to retire to
particular resorts means that in some parts of
the South Coast of England the average
(arithmetic mean) age of the population is
only just below retirement age.
The down side of this is that the extended
lives are often lived in bad health, as the
treatments people receive may keep them
alive but do little to ameliorate the
underlying pain or disability brought on by
the diseases, and virtually nothing for the
various forms of senile dementia that are
increasingly
This has been less studied. In areas where natural
disasters or politico-military concerns lead to
entire populations being displaced the initial
population structure will be unchanged, though
post-migration the population will have altered to
reflect those who have survived the process,
typically showing increases in older children and
younger adults.
Opportunistic migration tends to occur mostly
among younger adults, and may be permanent or
temporary. Some studies have shown increased
fertility levels in migrants, so the effect of
migration on population structure is to deplete the
population emigrated from in the young adult
groups, to augment this group in the immigrated-
to population, and to increase the
fertility/birthrate in the new population.
Migration

Global-Demography.pdf

  • 1.
  • 2.
    Lesson Outline Population EcologyDemogra phy The tools of Demography Population Composition and Density Fertility Mortality Migration
  • 3.
    Population and Ecologyare closely related to each other. The growth of population can be a burden to the environment, depleting its resources and threatening human and animal life. What is Population?
  • 4.
    Demography refers tothe scientific study of the size, composition, distribution and changes in human population. Demographic studies describe the composition of a population by its distribution of population categories such as race, age, marital status, gender, socioeconomic status, and religion. Demographers seek to know the levels and trends in population size and its component. They search for explanations of demographic change and their implication for society. They use census birth and death records, surveys, visa records, even motor vehicle and school registration. What is Demography?
  • 5.
  • 6.
    This refers tothe absolute number of a population or any demographic event occurring in a specified area in a specified time period (for example, 1,200,500 live births occurred in Japan in 1977). The raw quantities of demographic events are the basis of all other statistical refinements and analyses. The frequency of demographic events in a population during a specified time period (usually a year) divided by the population "at risk" of the event occurring during that time period. Rates tell how common it is for a given event to occur (for example, in 1997 in Papua New Guinea, there were 34 live births per 1,000 population). Most rates are expressed per 1,000 population. The relation of one population subgroup to the total population or to another subgroup, that is, one subgroup divided by another (for example, the sex ratio in Iran in 1996 was 103 males per 100 females). Count Rate Ratio
  • 7.
    The relation ofpopulation subgroup to the entire population, that is, a population subgroup divided by the entire population (for example, the proportion of Malaysia's population classified as urban was .57 or 57%). Proportion An unchanging, arbitrary number by which rates, ratios, or proportions can be multiplied to express these measures in a more understandable fashion. Constant
  • 8.
    A statistic aboutmeasures events occurring to a cohort (a group of people sharing a common demographic experience) who are observed through time. The most common used cohort is the birth cohorts- people born in the same year or period. Other kinds of cohorts include marriage cohorts and school class cohorts. A statistic that measures events occurring to all part or part of a population during one period of time, this measure "takes a snapshot of a population, in effect (For example, the death rate of the entire Canadian population in 1997 was 7 per 1,000). Cohort Measure Period Measure
  • 9.
    Population density canbe expressed as a ratio between the number of people and a particular unit of measure. The most common of such measures is crude or arithmetic density. To arrive at the crude population density of a place, it is necessary to divide the total number of people who live there by the total land area. The United States, for example, has an average population density of about 84 people per square mile. New York City, however, has a population density of 23,671 people per square mile, whereas some parts of Alaska have population densities of near zero people per square mile. Therefore, crude density is a very general measurement of population distribution. In order to get a more accurate picture of the population densities and the significance of variance in demographic characteristics throughout the world, we must turn to other measures such as agricultural density, nutritional density, age-sex pyramids, and birth/mortality rates. Population Composition and Density
  • 10.
    In terms ofpopulations rather than individuals, fertility is usually expressed using the proxy measure of birth rate, either crude or standardised for age and sex. Worldwide, there are significant differences between birth rates. A major study in the 1980s, carried out by the Population Division of the Department of International Economic and Social Affairs of the UN Secretariat, studied the relationship between population age and sex distribution and crude fertility rates for twenty one countries in the developing world. They concluded, the higher the birthrate the more markedly the birthrate is depressed by the age structure. All other things being equal, fertility should decline more rapidly in the countries where it is currently lowest since the age structure appears to favor such a course. Fertility
  • 11.
    The mean numberof children ever born also ranged widely among the twenty one countries. Differences in completed family size range from 8.6 children in Jordan to 5.2 children in Indonesia. 1 In the developed world, though, there is a global tendency for family sizes on average to be smaller than the replacement level. The "replacement level of fertility" is the number that causes a country's population to slow down and eventually stabilize. According to the CIA World Factbook's 2014 data the Total Fertility Rate for women is below 2 children for North America, Brazil, all the EU states except France, Russia, China, and Australasia, while women in most of sub-Saharan Africa has between 3 and 7 children on average. Fertility
  • 12.
    The effect ofmortality on population structures is to reduce the component of the population in which the mortality occurs. Historically, the most dangerous ages were infancy and old age (variously reckoned according to circumstances). In addition, some epidemics of infectious diseases (e.g. Spanish 'flu) had their highest mortality among young adults, whose immune systems were presumably insufficiently primed. It is expected that the forecast bird 'flu epidemic will behave similarly. War differentially reduces the proportion of younger men. The majority of infectious diseases of early childhood have been reduced by immunization, and improved nutrition and hygiene have rendered childhood safer. Mortality Antibiotics, welfare state, and improvements in medical, surgical, and palliative care have resulted in great increases in life expectancy in the developed world, where life expectancy is now in the middle to upper 70s or lower 80s, and rising every year. The effect of this is to raise the population in the upper age groups substantially. Women have higher life expectancy than men wherever they live. The tendency of people to retire to particular resorts means that in some parts of the South Coast of England the average (arithmetic mean) age of the population is only just below retirement age. The down side of this is that the extended lives are often lived in bad health, as the treatments people receive may keep them alive but do little to ameliorate the underlying pain or disability brought on by the diseases, and virtually nothing for the various forms of senile dementia that are increasingly
  • 13.
    This has beenless studied. In areas where natural disasters or politico-military concerns lead to entire populations being displaced the initial population structure will be unchanged, though post-migration the population will have altered to reflect those who have survived the process, typically showing increases in older children and younger adults. Opportunistic migration tends to occur mostly among younger adults, and may be permanent or temporary. Some studies have shown increased fertility levels in migrants, so the effect of migration on population structure is to deplete the population emigrated from in the young adult groups, to augment this group in the immigrated- to population, and to increase the fertility/birthrate in the new population. Migration