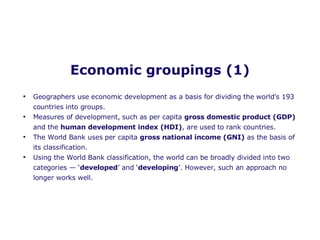
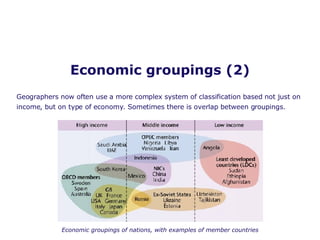
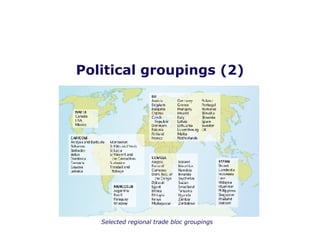
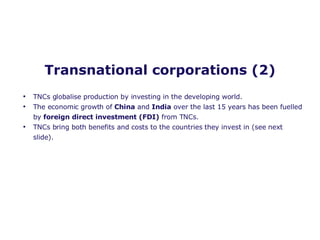
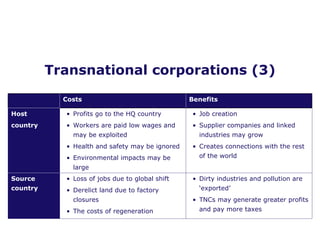
Going global Global groupings
Economic groupings (1) Geographers use economic development as a basis for dividing the world’s 193 countries into groups. Measures of development, such as per capita  gross domestic product (GDP)  and the  human development index (HDI) , are used to rank countries. The World Bank uses per capita  gross national income (GNI)  as the basis of its classification.  Using the World Bank classification, the world can be broadly divided into two categories — ‘ developed ’ and ‘ developing ’. However, such an approach no longer works well.
Economic groupings (2) Geographers now often use a more complex system of classification based not just on income, but on type of economy. Sometimes there is overlap between groupings.  Economic groupings of nations, with examples of member countries
Political groupings (1) Countries, usually at similar development levels and in the same part of the world, agree to form  trade blocs  by signing international agreements (see next slide). These allow for tariff- and quota-free trade. The  World Trade Organization  works to increase free trade between blocs.
Political groupings (2) Selected regional trade bloc groupings
World trade (1) Economists generally agree that ‘trade is the engine of growth’. Free trade  is therefore responsible for creating wealth. The  World Trade Organization’s  current round of talks, begun in Doha in 2001, aims to increase free trade further.  There are serious question marks over free trade and whether everyone, particularly the world’s poorest people, benefits from it.
World trade (2) More developed countries  have generally maintained their share of world trade. Asian newly industrialised countries (NICs)  have rapidly increased their share. Africa  and  Latin America  have barely benefited.
Global wealth In the world’s 50 poorest countries, average income is around $0.80 per day. In 2001, 34% of the population aged between 15 and 24 in the poorest countries was illiterate. About 60% of the poorest countries experienced civil conflict between 1990 and 2001. The gap between the richest and the poorest nations has grown. Initiatives such as  fair trade  are designed to ensure that people in the least developed countries gain a better share of global wealth.
Transnational corporations (1) Transnational corporations (TNCs)  are major companies which have a presence (e.g. production, headquarters, sales) in at least two countries.  Many TNCs are so economically powerful and politically influential that they rival national economies in terms of wealth.  How the wealth of TNCs compares with that of nations 2006 GDP of selected nations World’s top five TNCs (2006) TNC 131 5 Zimbabwe 207 General Motors 57 65 Bangladesh 274 BP 45 128 Pakistan 318 Royal Dutch/Shall 48 115 Nigeria 351 Wal-Mart 34 206 Thailand 377 Exxon Mobil Rank GDP ($bn) Country Revenue ($bn) TNC
Transnational corporations (2) TNCs globalise production by investing in the developing world.  The economic growth of  China  and  India  over the last 15 years has been fuelled by  foreign direct investment (FDI)  from TNCs. TNCs bring both benefits and costs to the countries they invest in (see next slide).
Transnational corporations (3) Costs Benefits  Host  country  Profits go to the HQ country  Workers are paid low wages and may be exploited  Health and safety may be ignored Environmental impacts may be large Job creation Supplier companies and linked industries may grow Creates connections with the rest of the world  Source country Loss of jobs due to global shift  Derelict land due to factory closures The costs of regeneration Dirty industries and pollution are ‘exported’  TNCs may generate greater profits and pay more taxes

Global Groupings

  • 1.
  • 2.
    Economic groupings (1)Geographers use economic development as a basis for dividing the world’s 193 countries into groups. Measures of development, such as per capita gross domestic product (GDP) and the human development index (HDI) , are used to rank countries. The World Bank uses per capita gross national income (GNI) as the basis of its classification. Using the World Bank classification, the world can be broadly divided into two categories — ‘ developed ’ and ‘ developing ’. However, such an approach no longer works well.
  • 3.
    Economic groupings (2)Geographers now often use a more complex system of classification based not just on income, but on type of economy. Sometimes there is overlap between groupings. Economic groupings of nations, with examples of member countries
  • 4.
    Political groupings (1)Countries, usually at similar development levels and in the same part of the world, agree to form trade blocs by signing international agreements (see next slide). These allow for tariff- and quota-free trade. The World Trade Organization works to increase free trade between blocs.
  • 5.
    Political groupings (2)Selected regional trade bloc groupings
  • 6.
    World trade (1)Economists generally agree that ‘trade is the engine of growth’. Free trade is therefore responsible for creating wealth. The World Trade Organization’s current round of talks, begun in Doha in 2001, aims to increase free trade further. There are serious question marks over free trade and whether everyone, particularly the world’s poorest people, benefits from it.
  • 7.
    World trade (2)More developed countries have generally maintained their share of world trade. Asian newly industrialised countries (NICs) have rapidly increased their share. Africa and Latin America have barely benefited.
  • 8.
    Global wealth Inthe world’s 50 poorest countries, average income is around $0.80 per day. In 2001, 34% of the population aged between 15 and 24 in the poorest countries was illiterate. About 60% of the poorest countries experienced civil conflict between 1990 and 2001. The gap between the richest and the poorest nations has grown. Initiatives such as fair trade are designed to ensure that people in the least developed countries gain a better share of global wealth.
  • 9.
    Transnational corporations (1)Transnational corporations (TNCs) are major companies which have a presence (e.g. production, headquarters, sales) in at least two countries. Many TNCs are so economically powerful and politically influential that they rival national economies in terms of wealth. How the wealth of TNCs compares with that of nations 2006 GDP of selected nations World’s top five TNCs (2006) TNC 131 5 Zimbabwe 207 General Motors 57 65 Bangladesh 274 BP 45 128 Pakistan 318 Royal Dutch/Shall 48 115 Nigeria 351 Wal-Mart 34 206 Thailand 377 Exxon Mobil Rank GDP ($bn) Country Revenue ($bn) TNC
  • 10.
    Transnational corporations (2)TNCs globalise production by investing in the developing world. The economic growth of China and India over the last 15 years has been fuelled by foreign direct investment (FDI) from TNCs. TNCs bring both benefits and costs to the countries they invest in (see next slide).
  • 11.
    Transnational corporations (3)Costs Benefits Host country Profits go to the HQ country Workers are paid low wages and may be exploited Health and safety may be ignored Environmental impacts may be large Job creation Supplier companies and linked industries may grow Creates connections with the rest of the world Source country Loss of jobs due to global shift Derelict land due to factory closures The costs of regeneration Dirty industries and pollution are ‘exported’ TNCs may generate greater profits and pay more taxes