Downloaded 81 times


![Medical Example using PyMC
model = pymc.Model()
with model:
sick = pymc.Bernoulli(p=0.01)
test_result = pymc.Bernoulli(sick * 0.9 + (1-sick) * (1.0-0.9), observed=[1])
algorithm = pymc.Metropolis()
print “Pr(Sick | Test) = %f” % pymc.sample(1000, algorithm)[sick].mean()](https://image.slidesharecdn.com/final-131115073059-phpapp01/85/Dealing-with-Uncertainty-What-the-reverend-Bayes-can-teach-us-28-320.jpg)

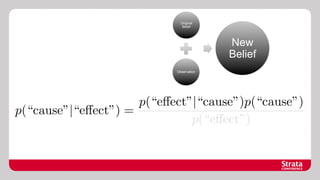
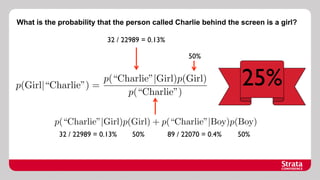
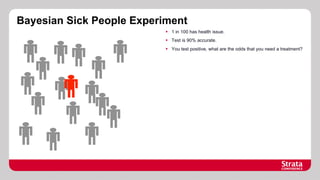
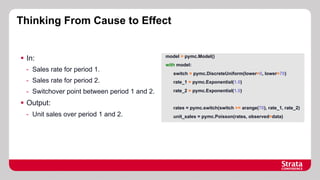
The document discusses Bayesian probability, including historical context and key concepts like inverse probability and Cox's axioms. It explores applications in decision-making, such as evaluating the bias of coins and medical testing, and includes examples of probabilistic programming models. The document also references important resources for further understanding Bayesian methods.