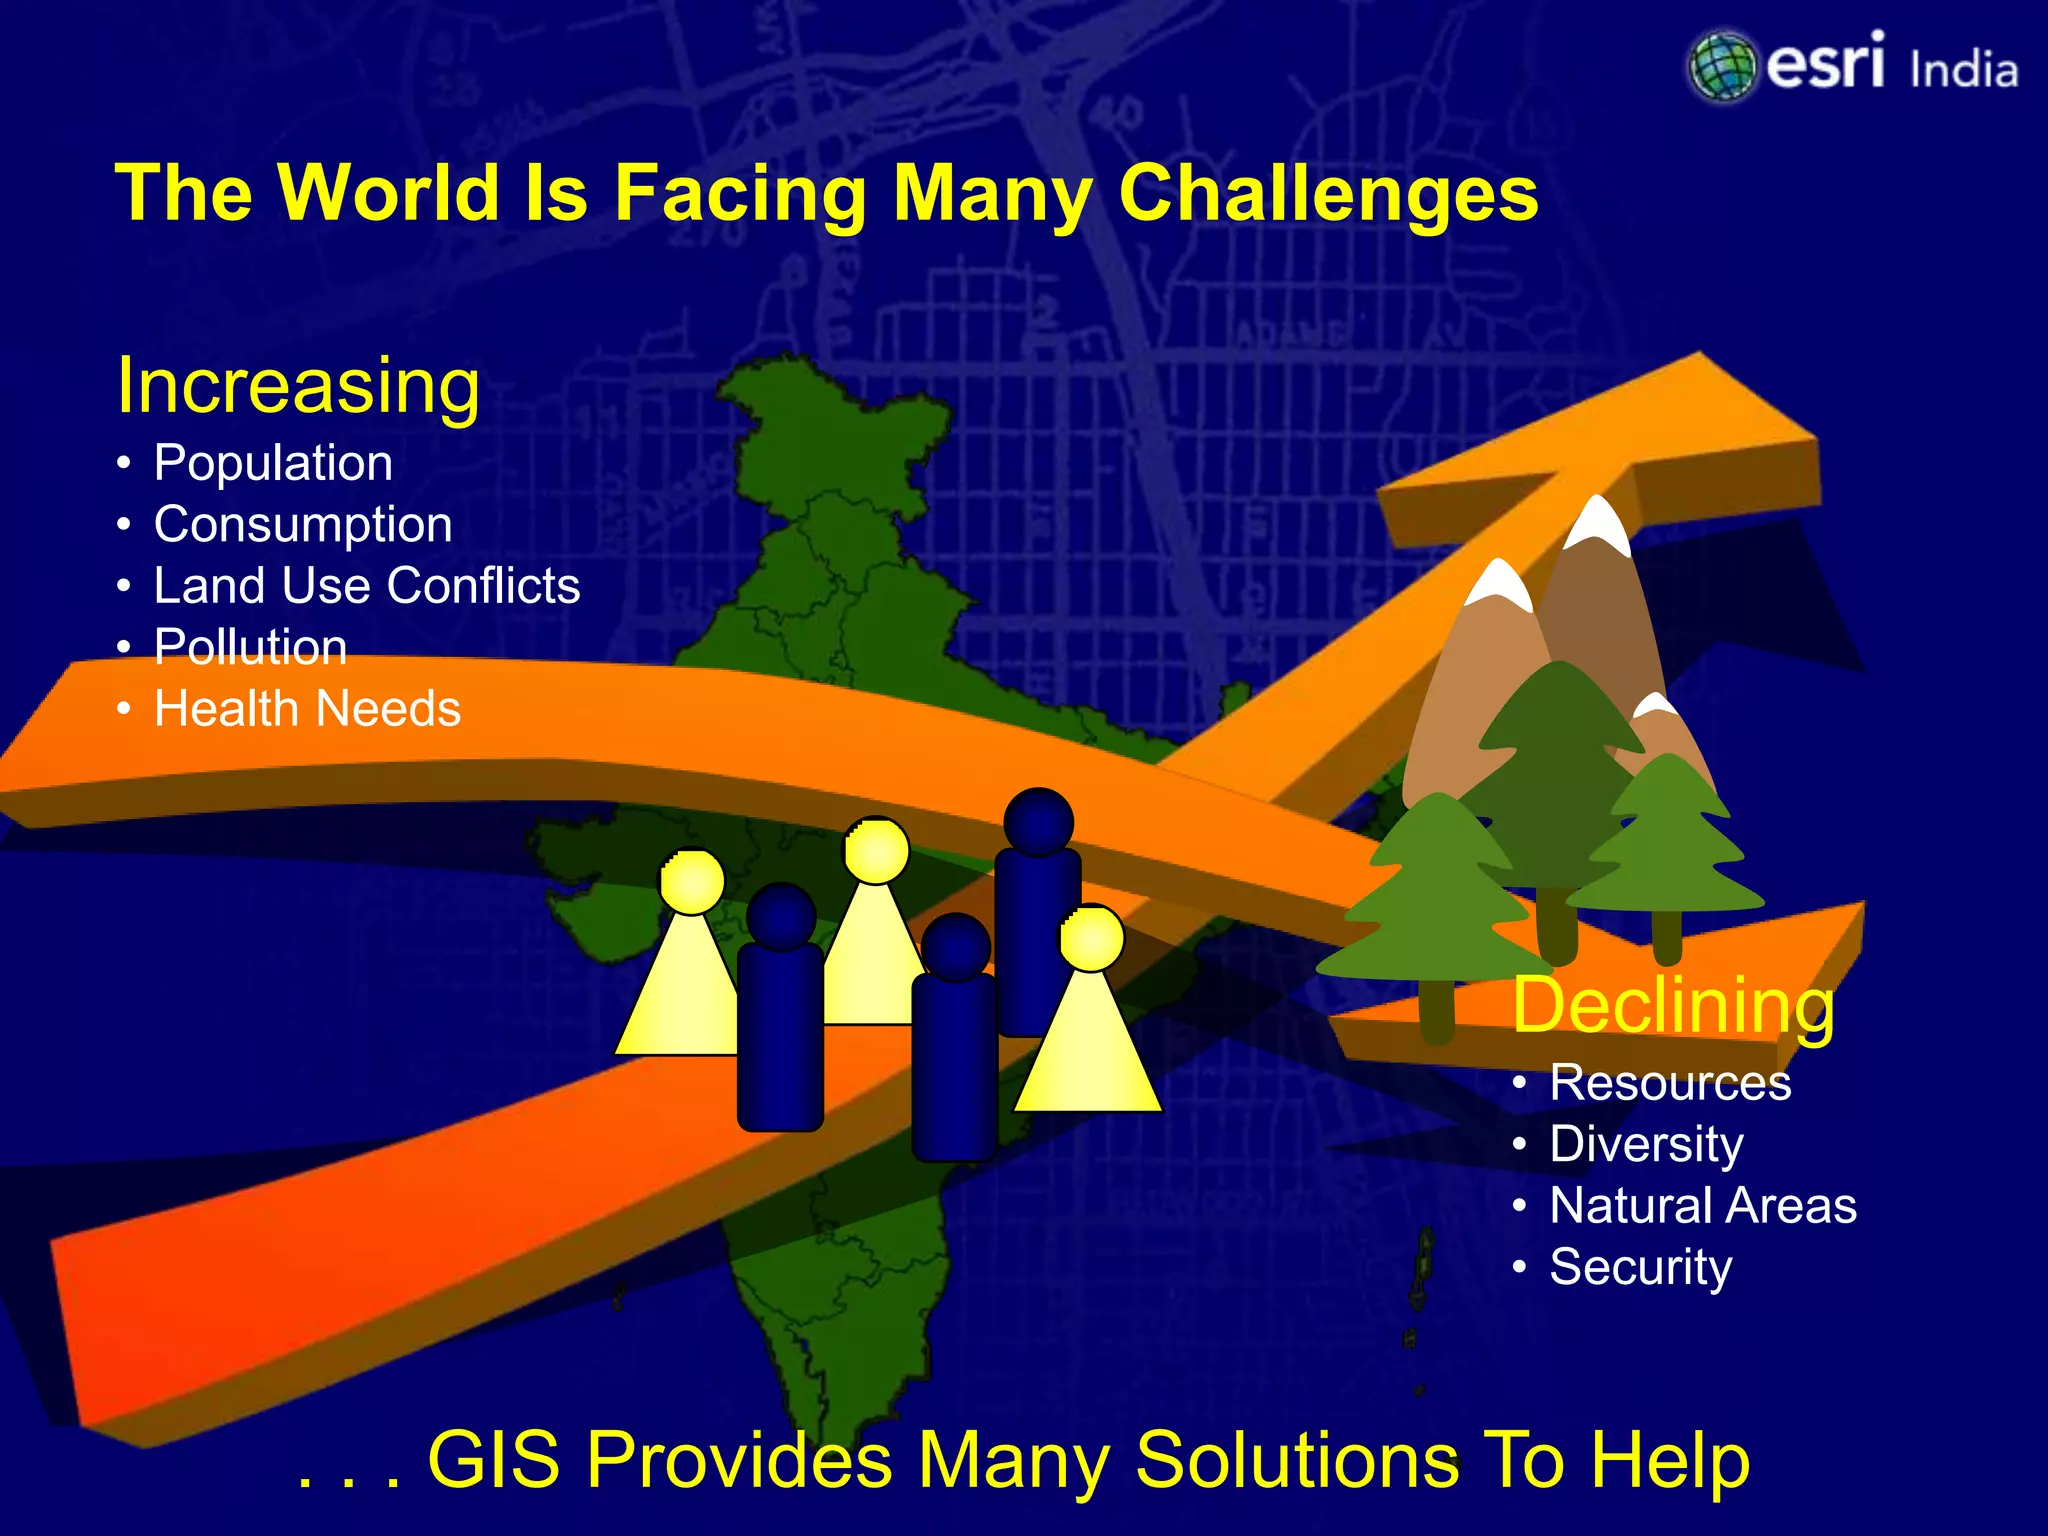
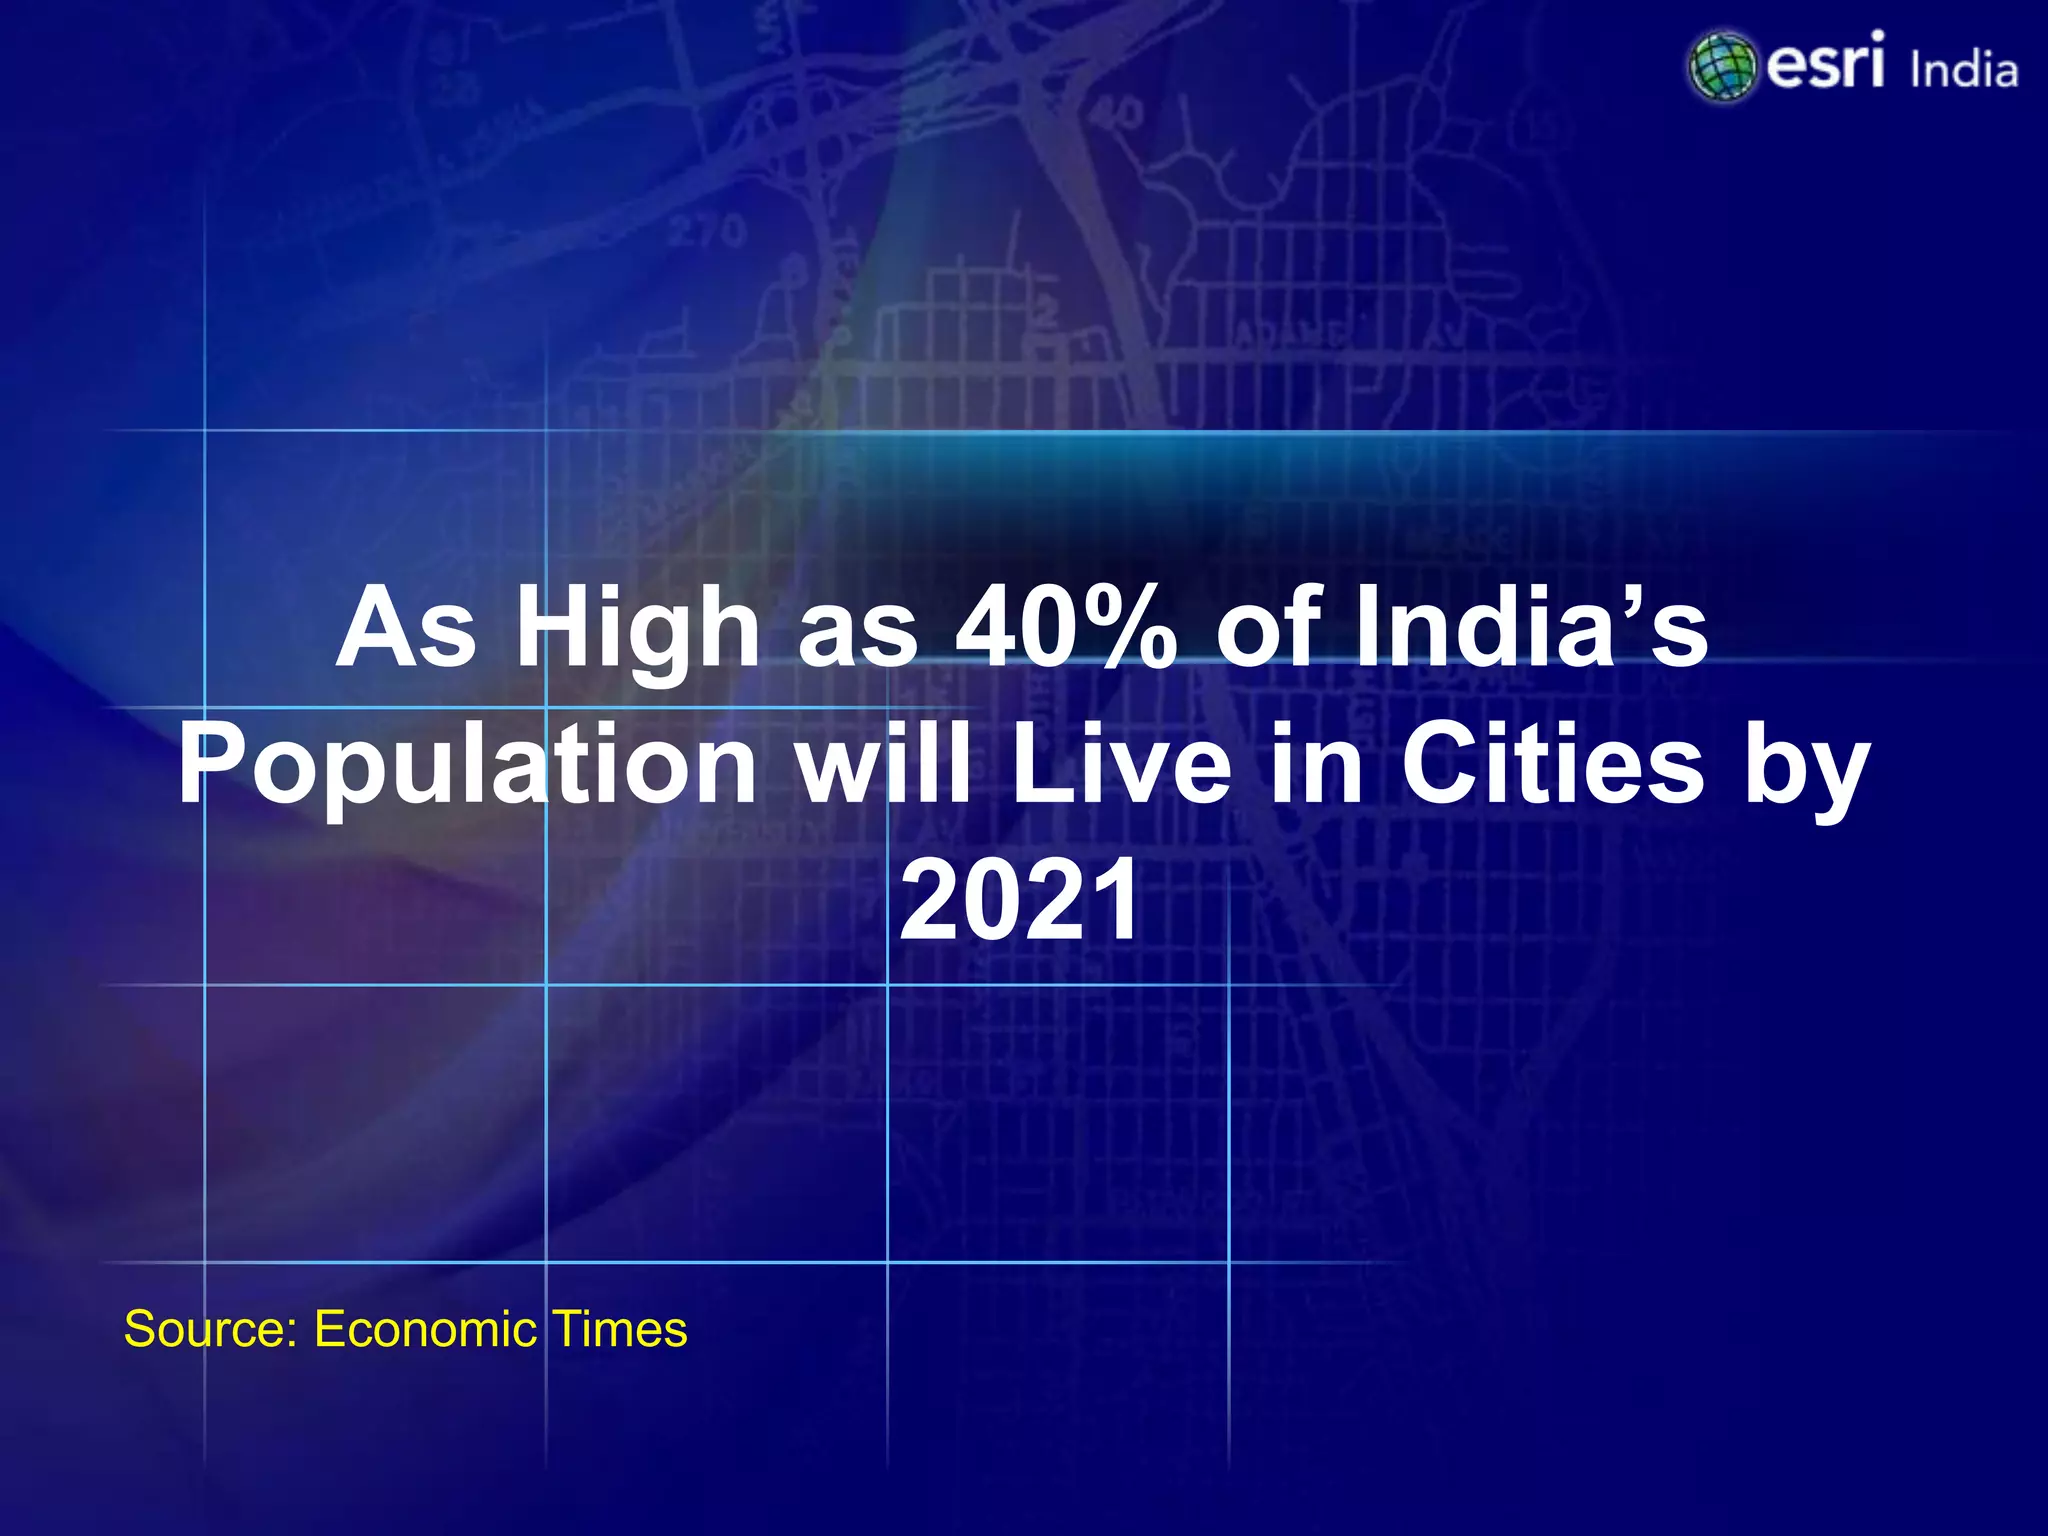
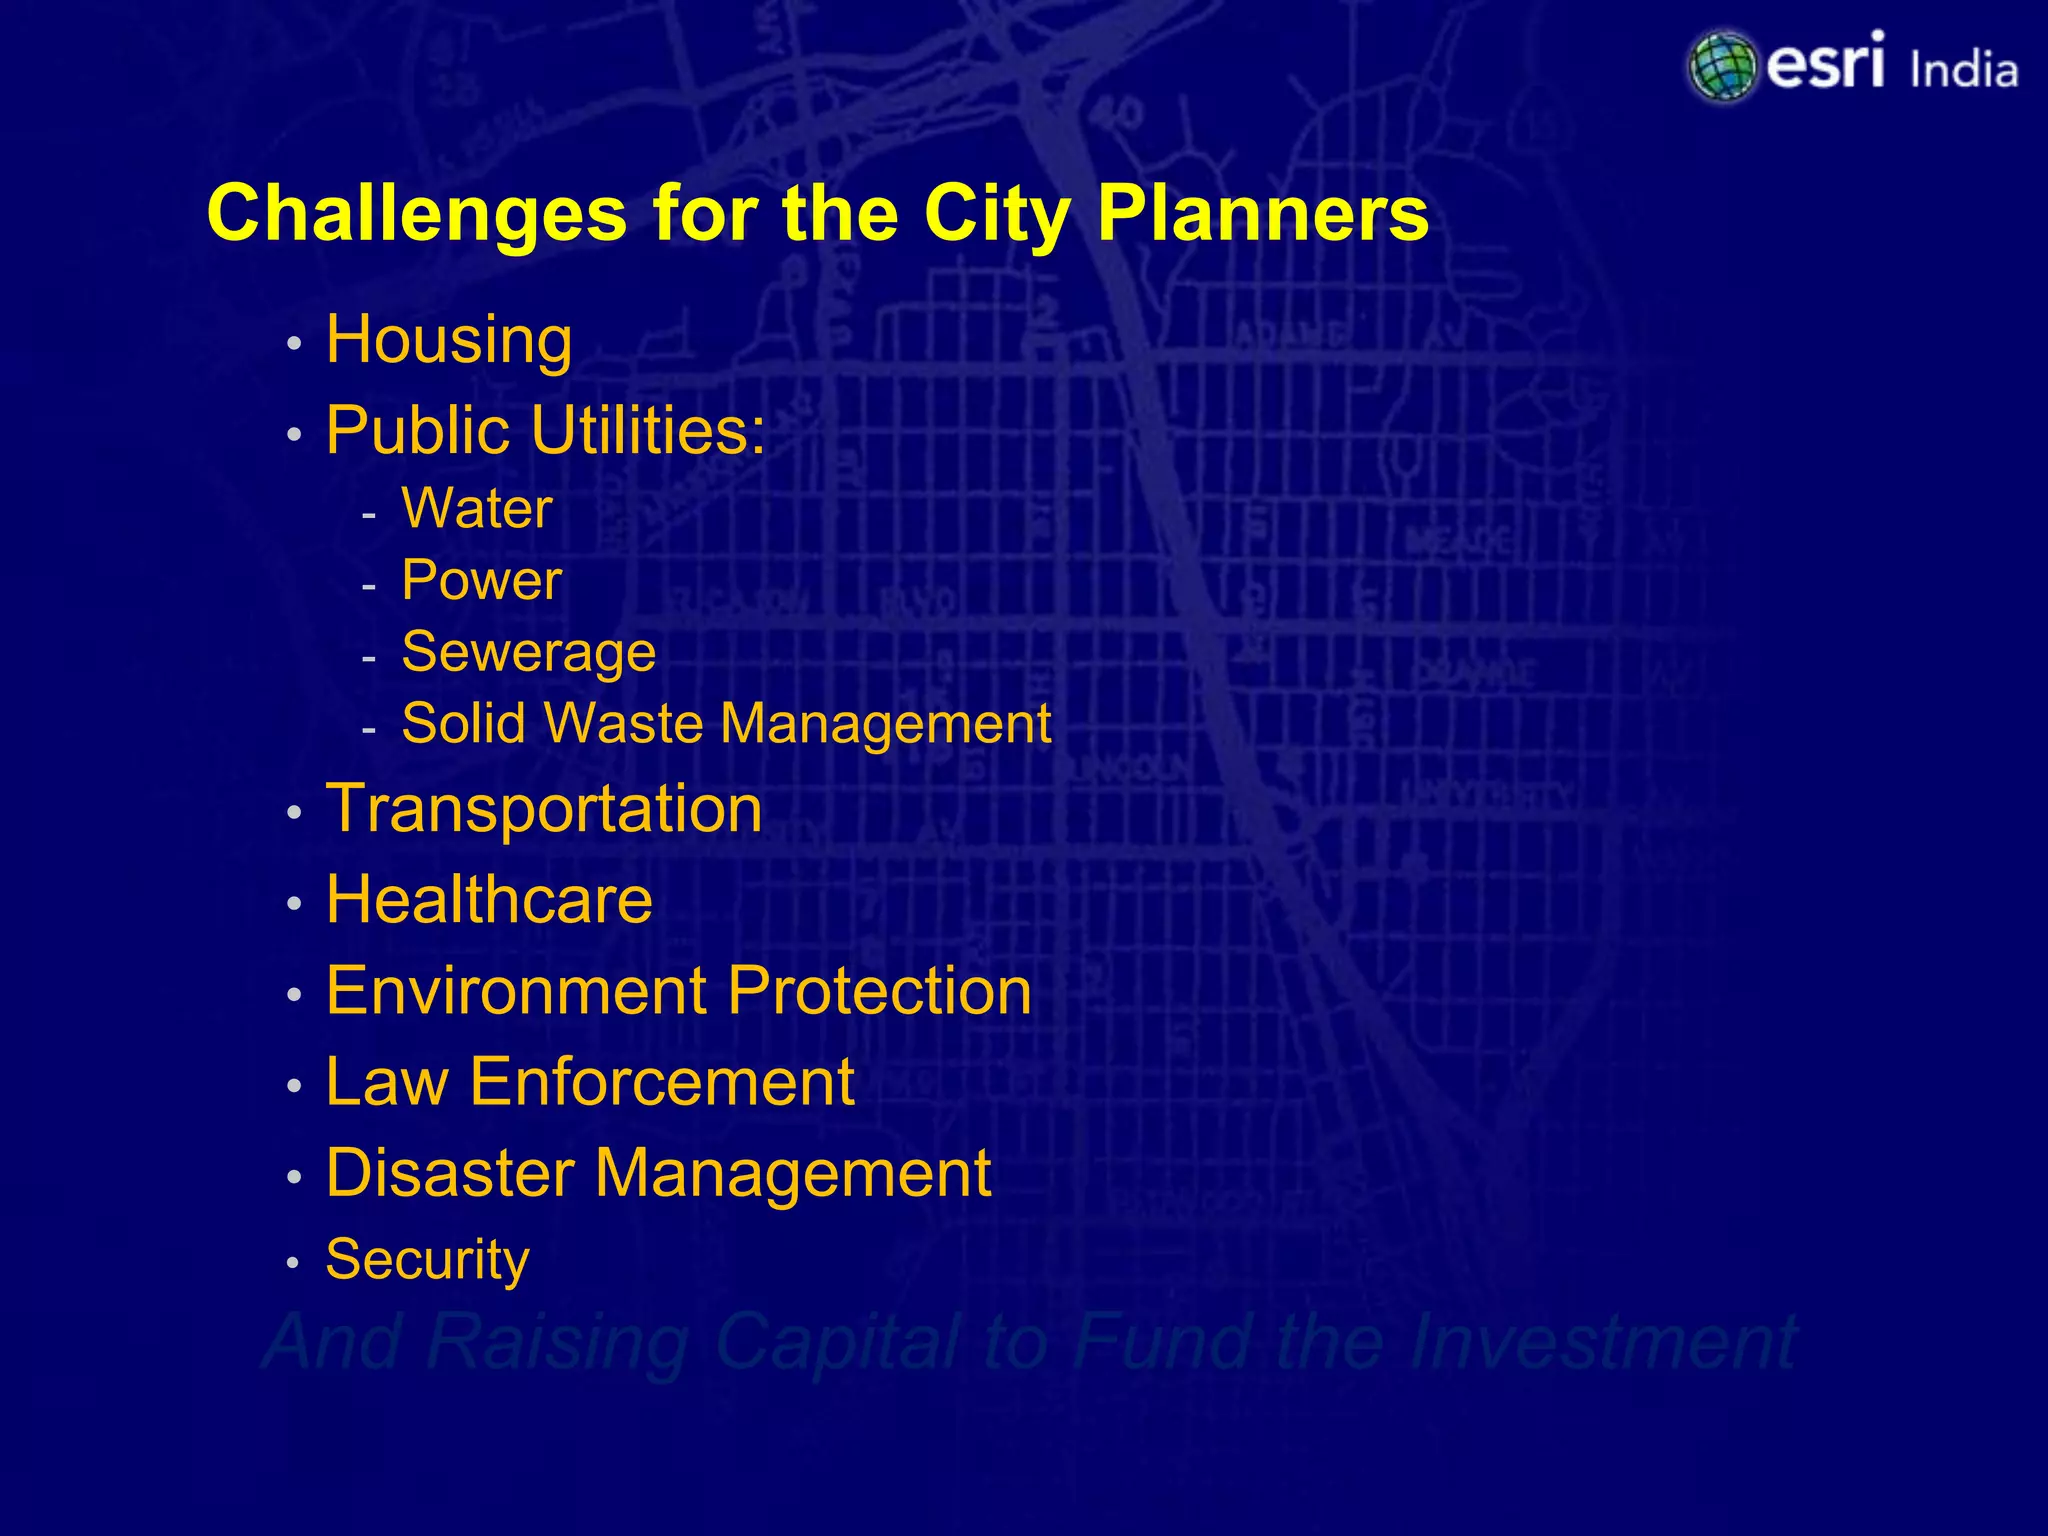
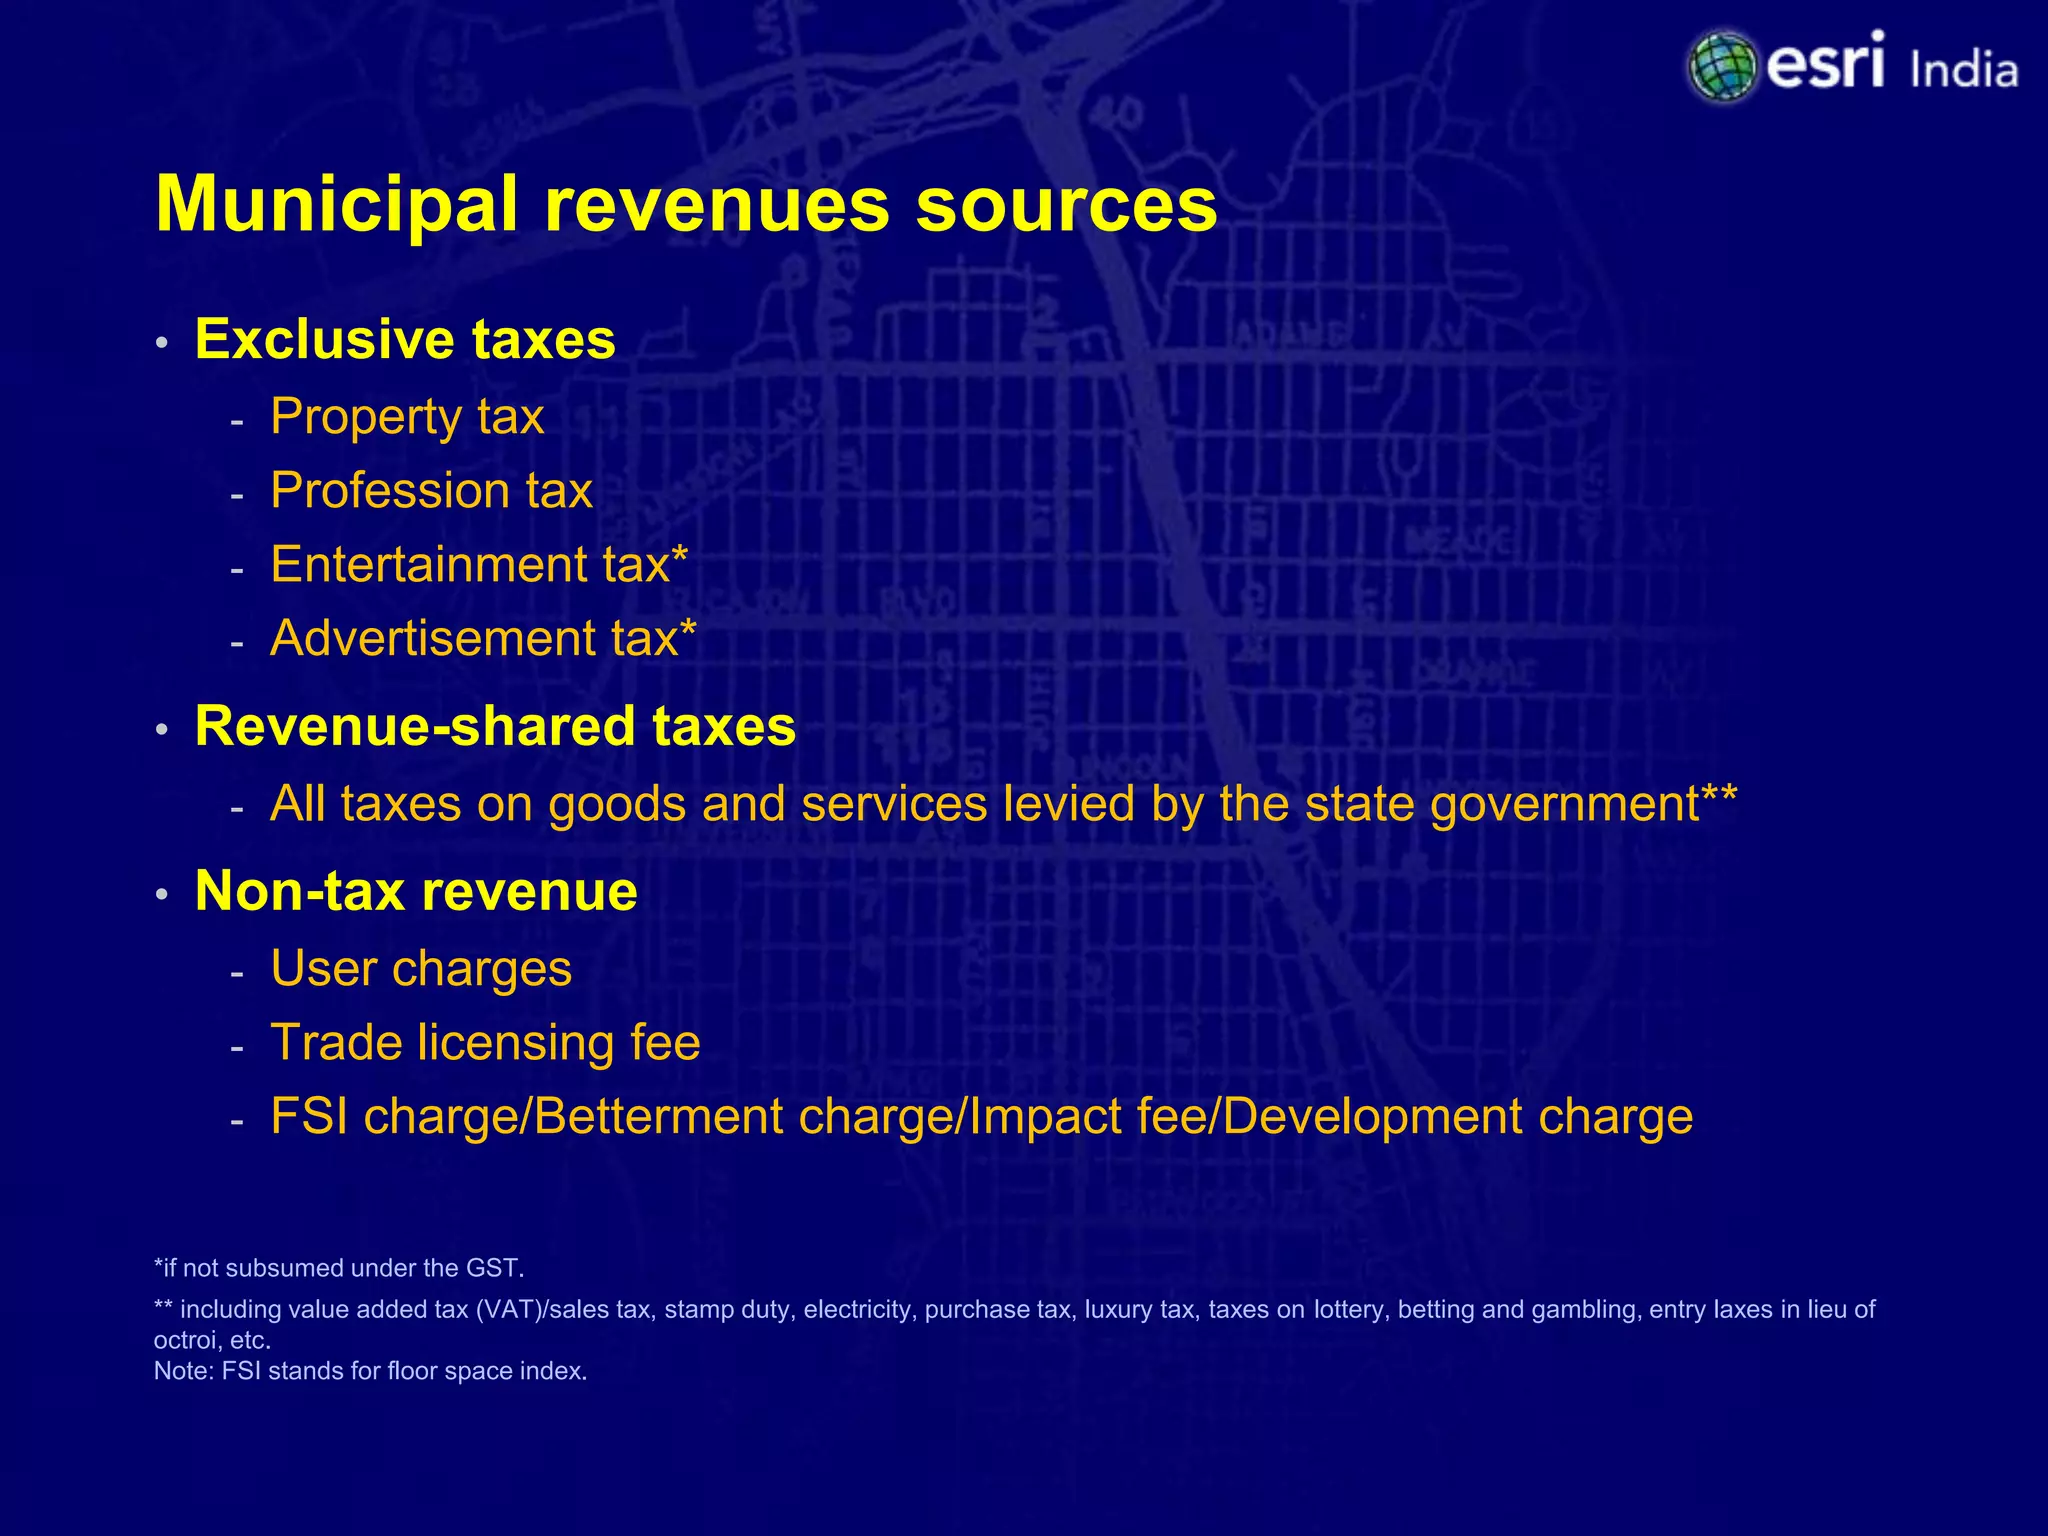
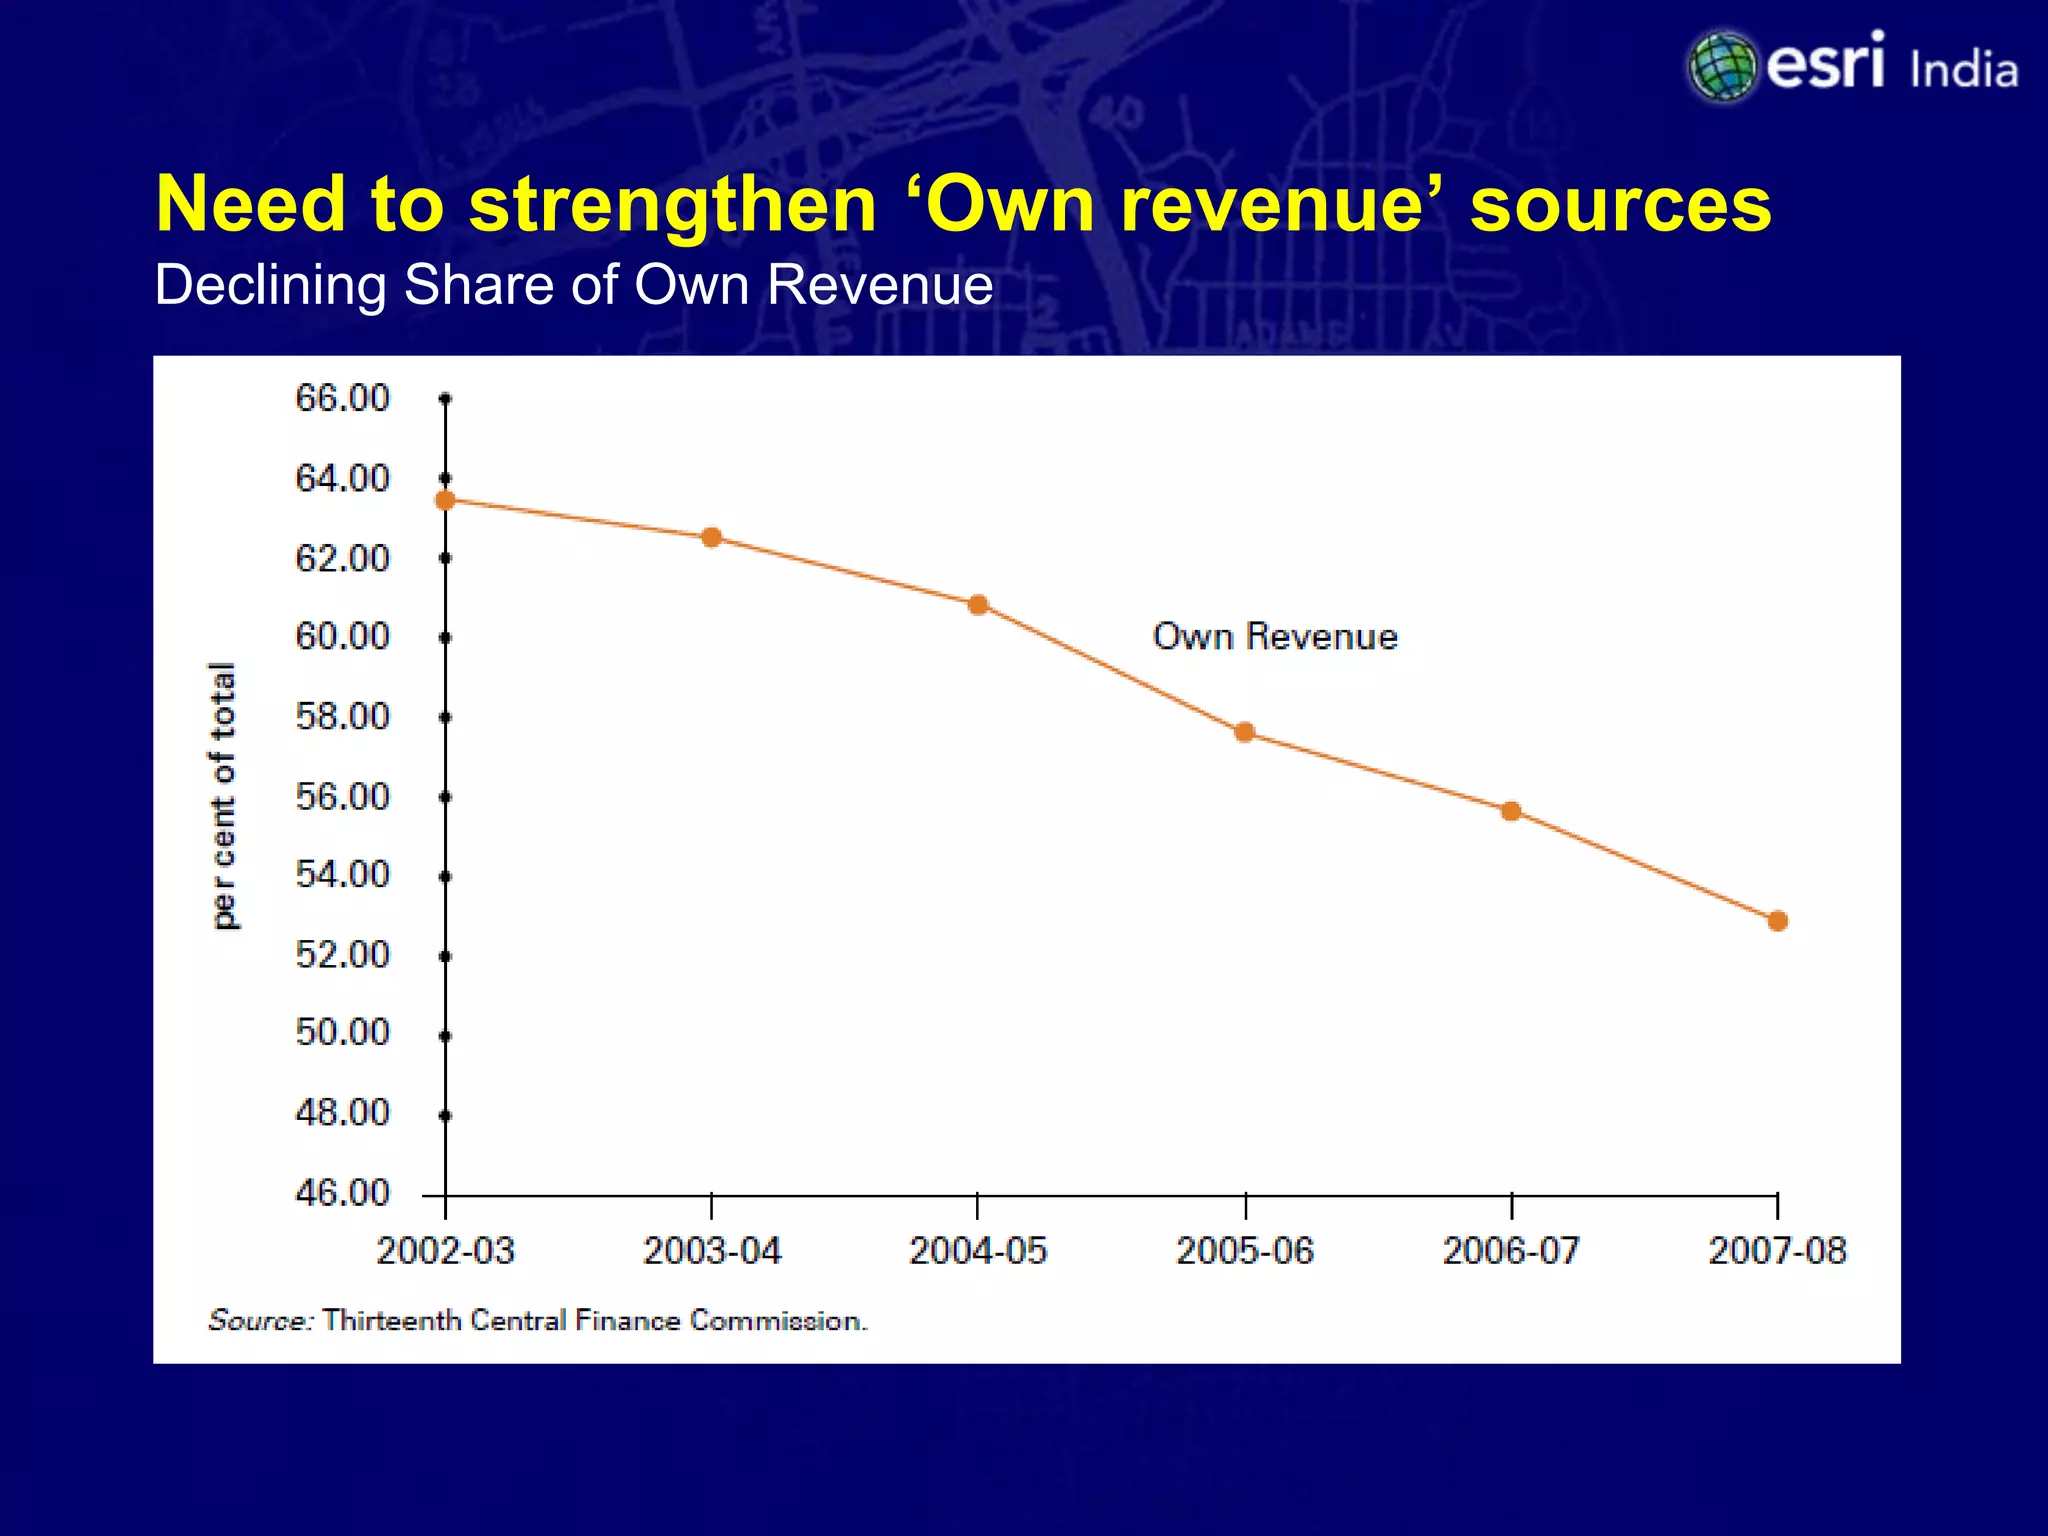
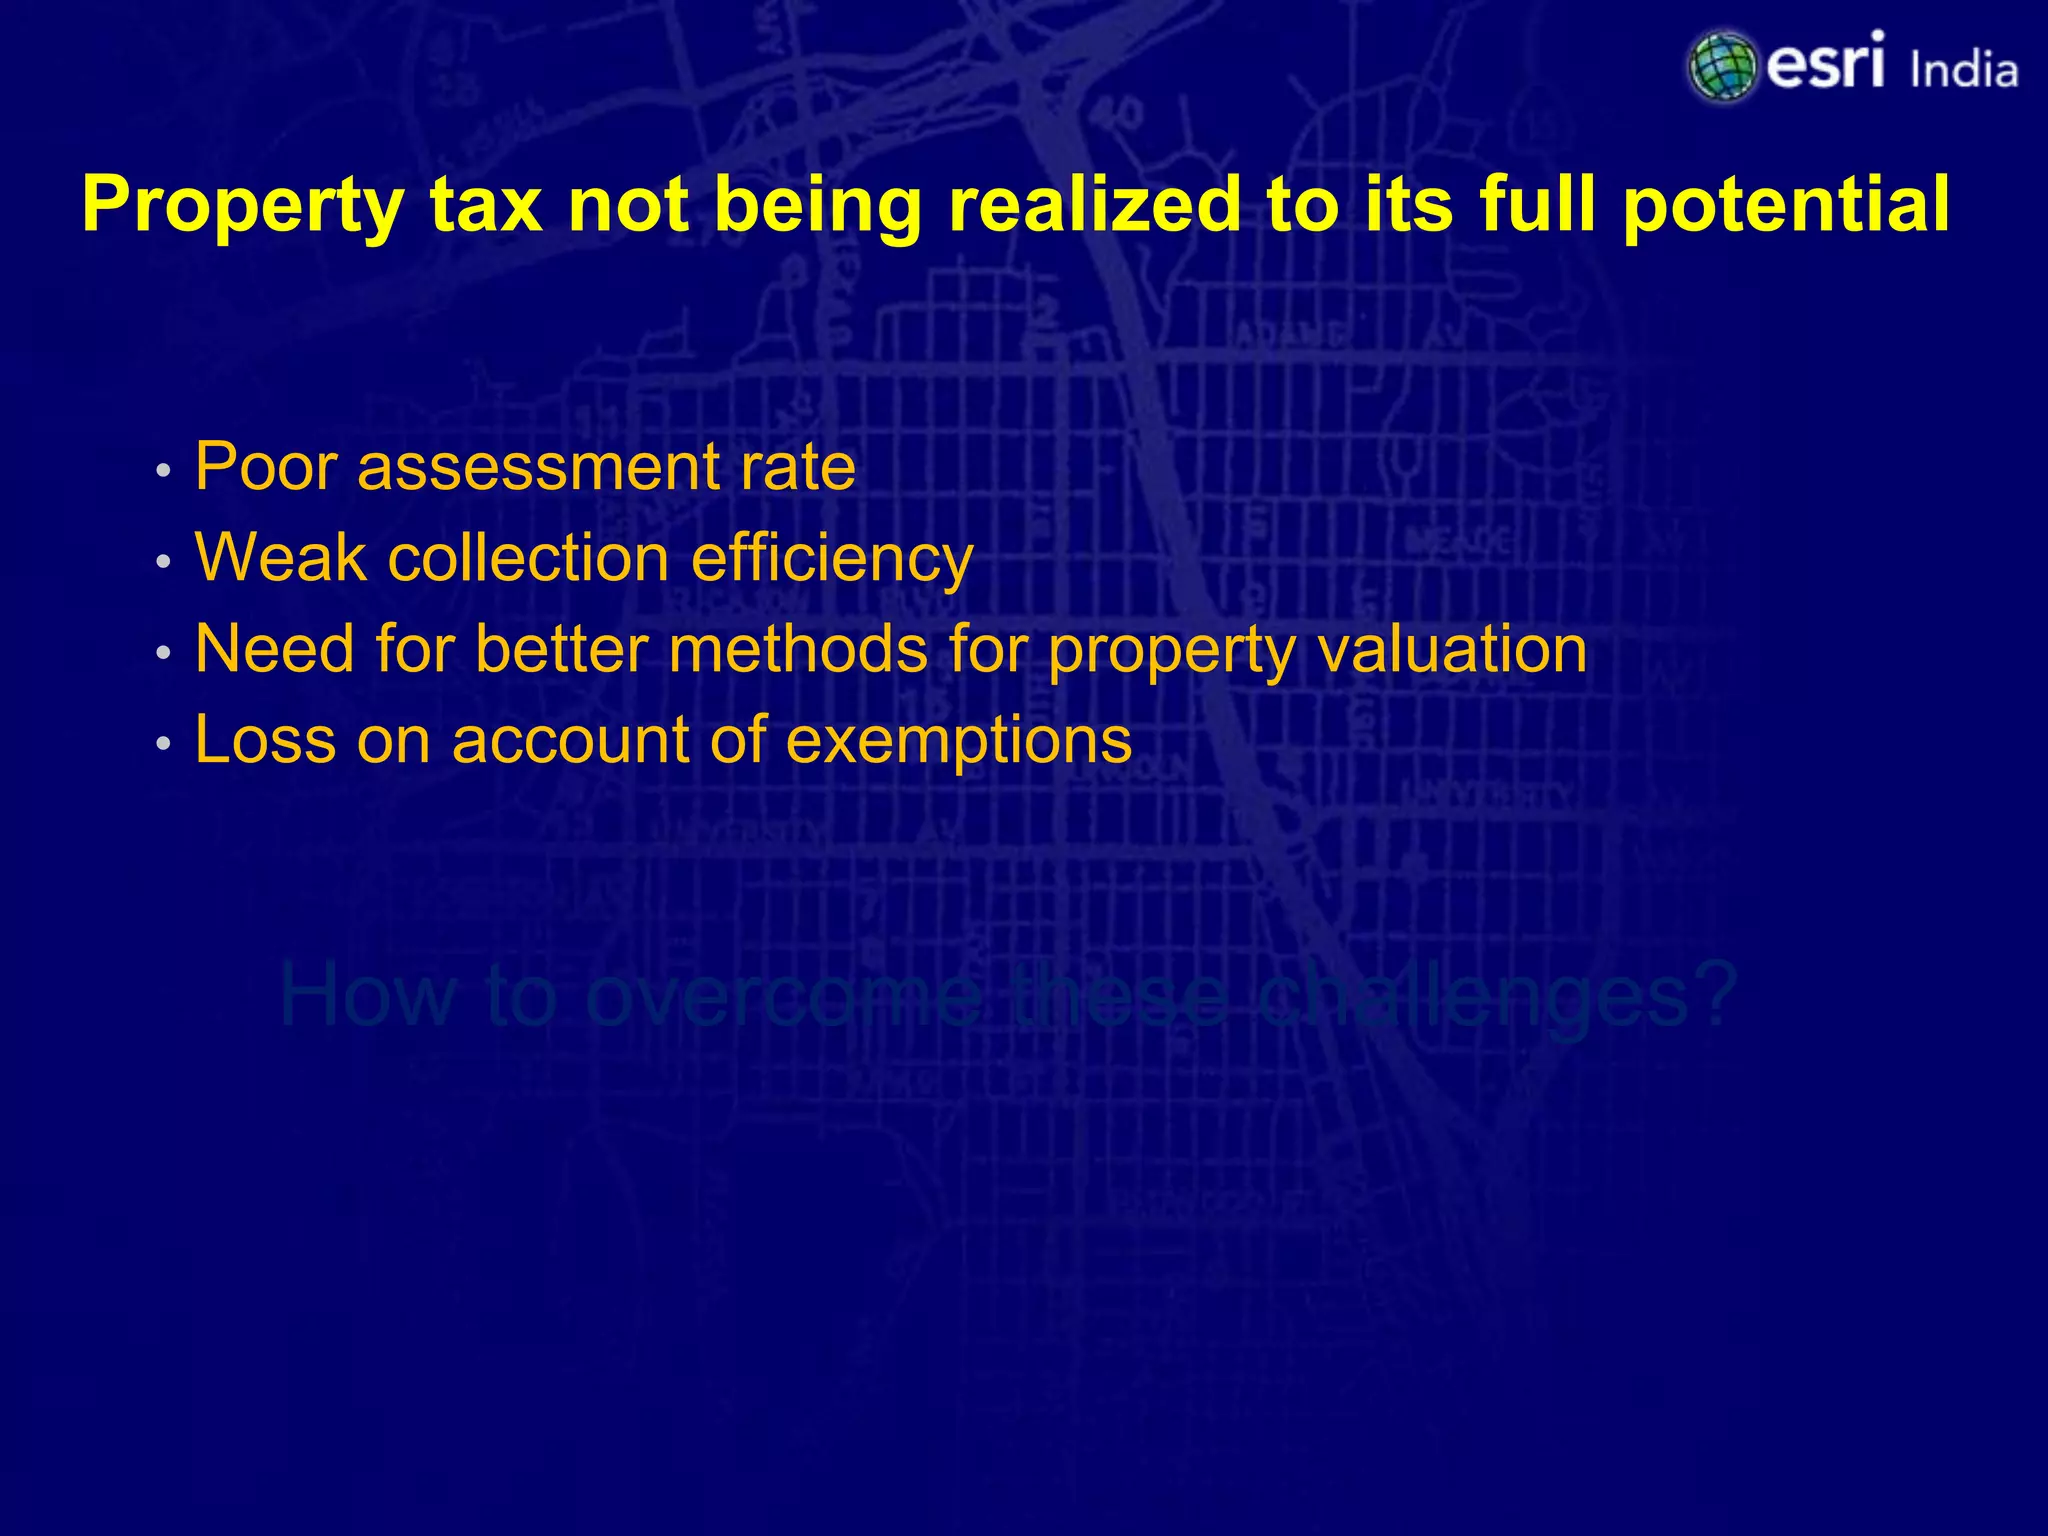
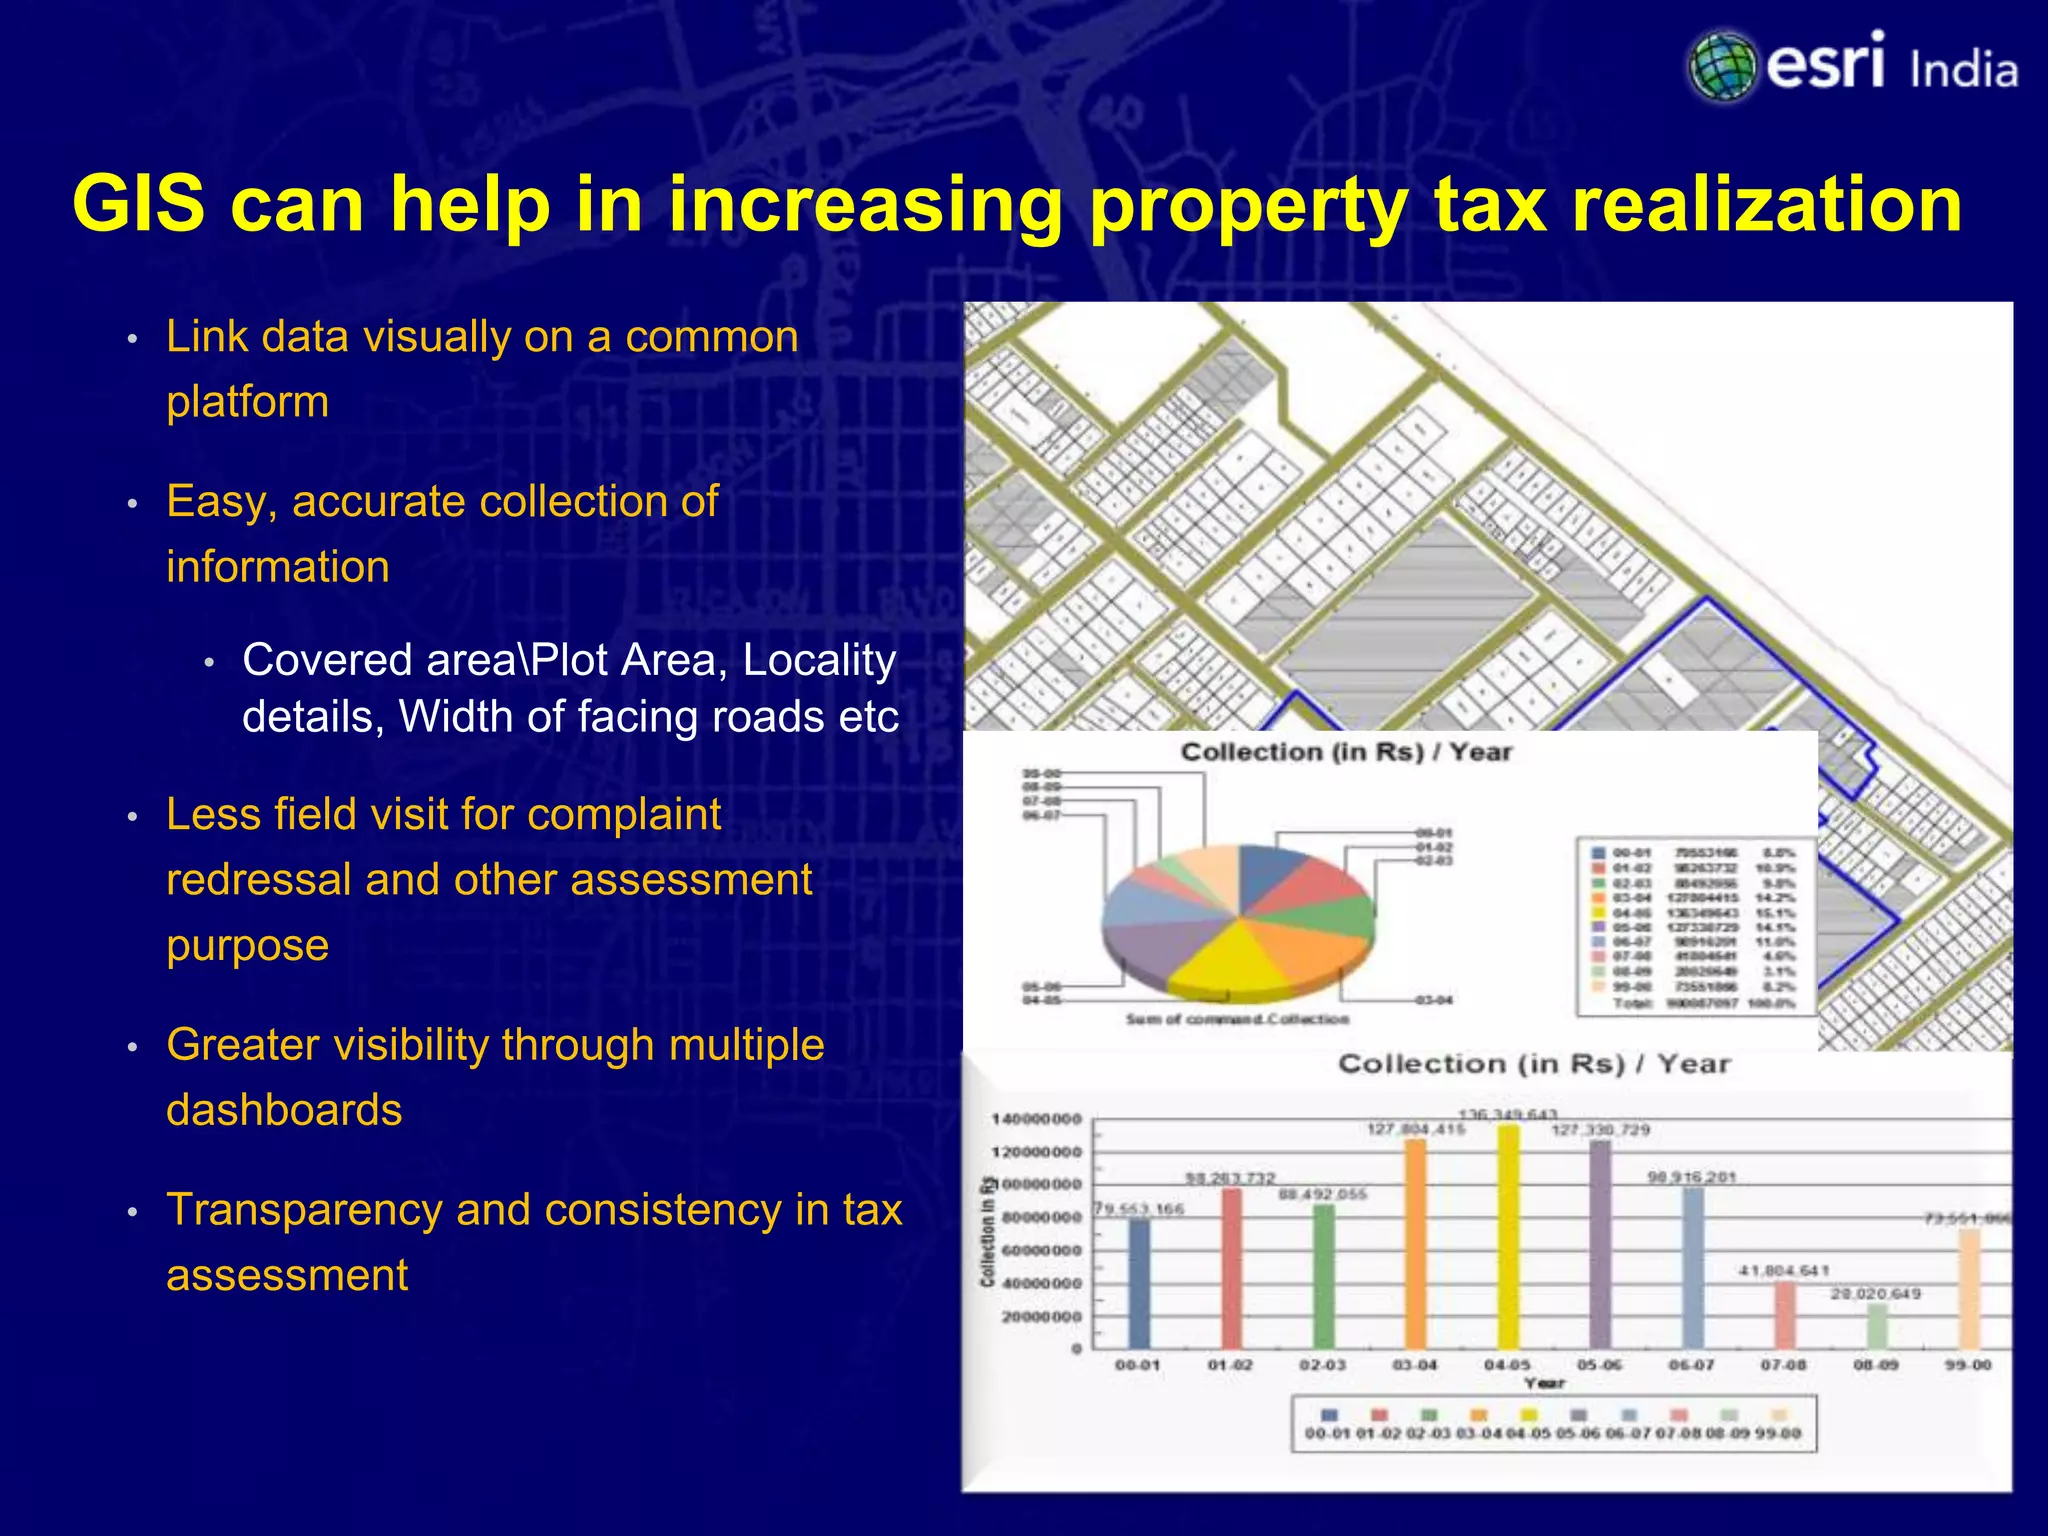
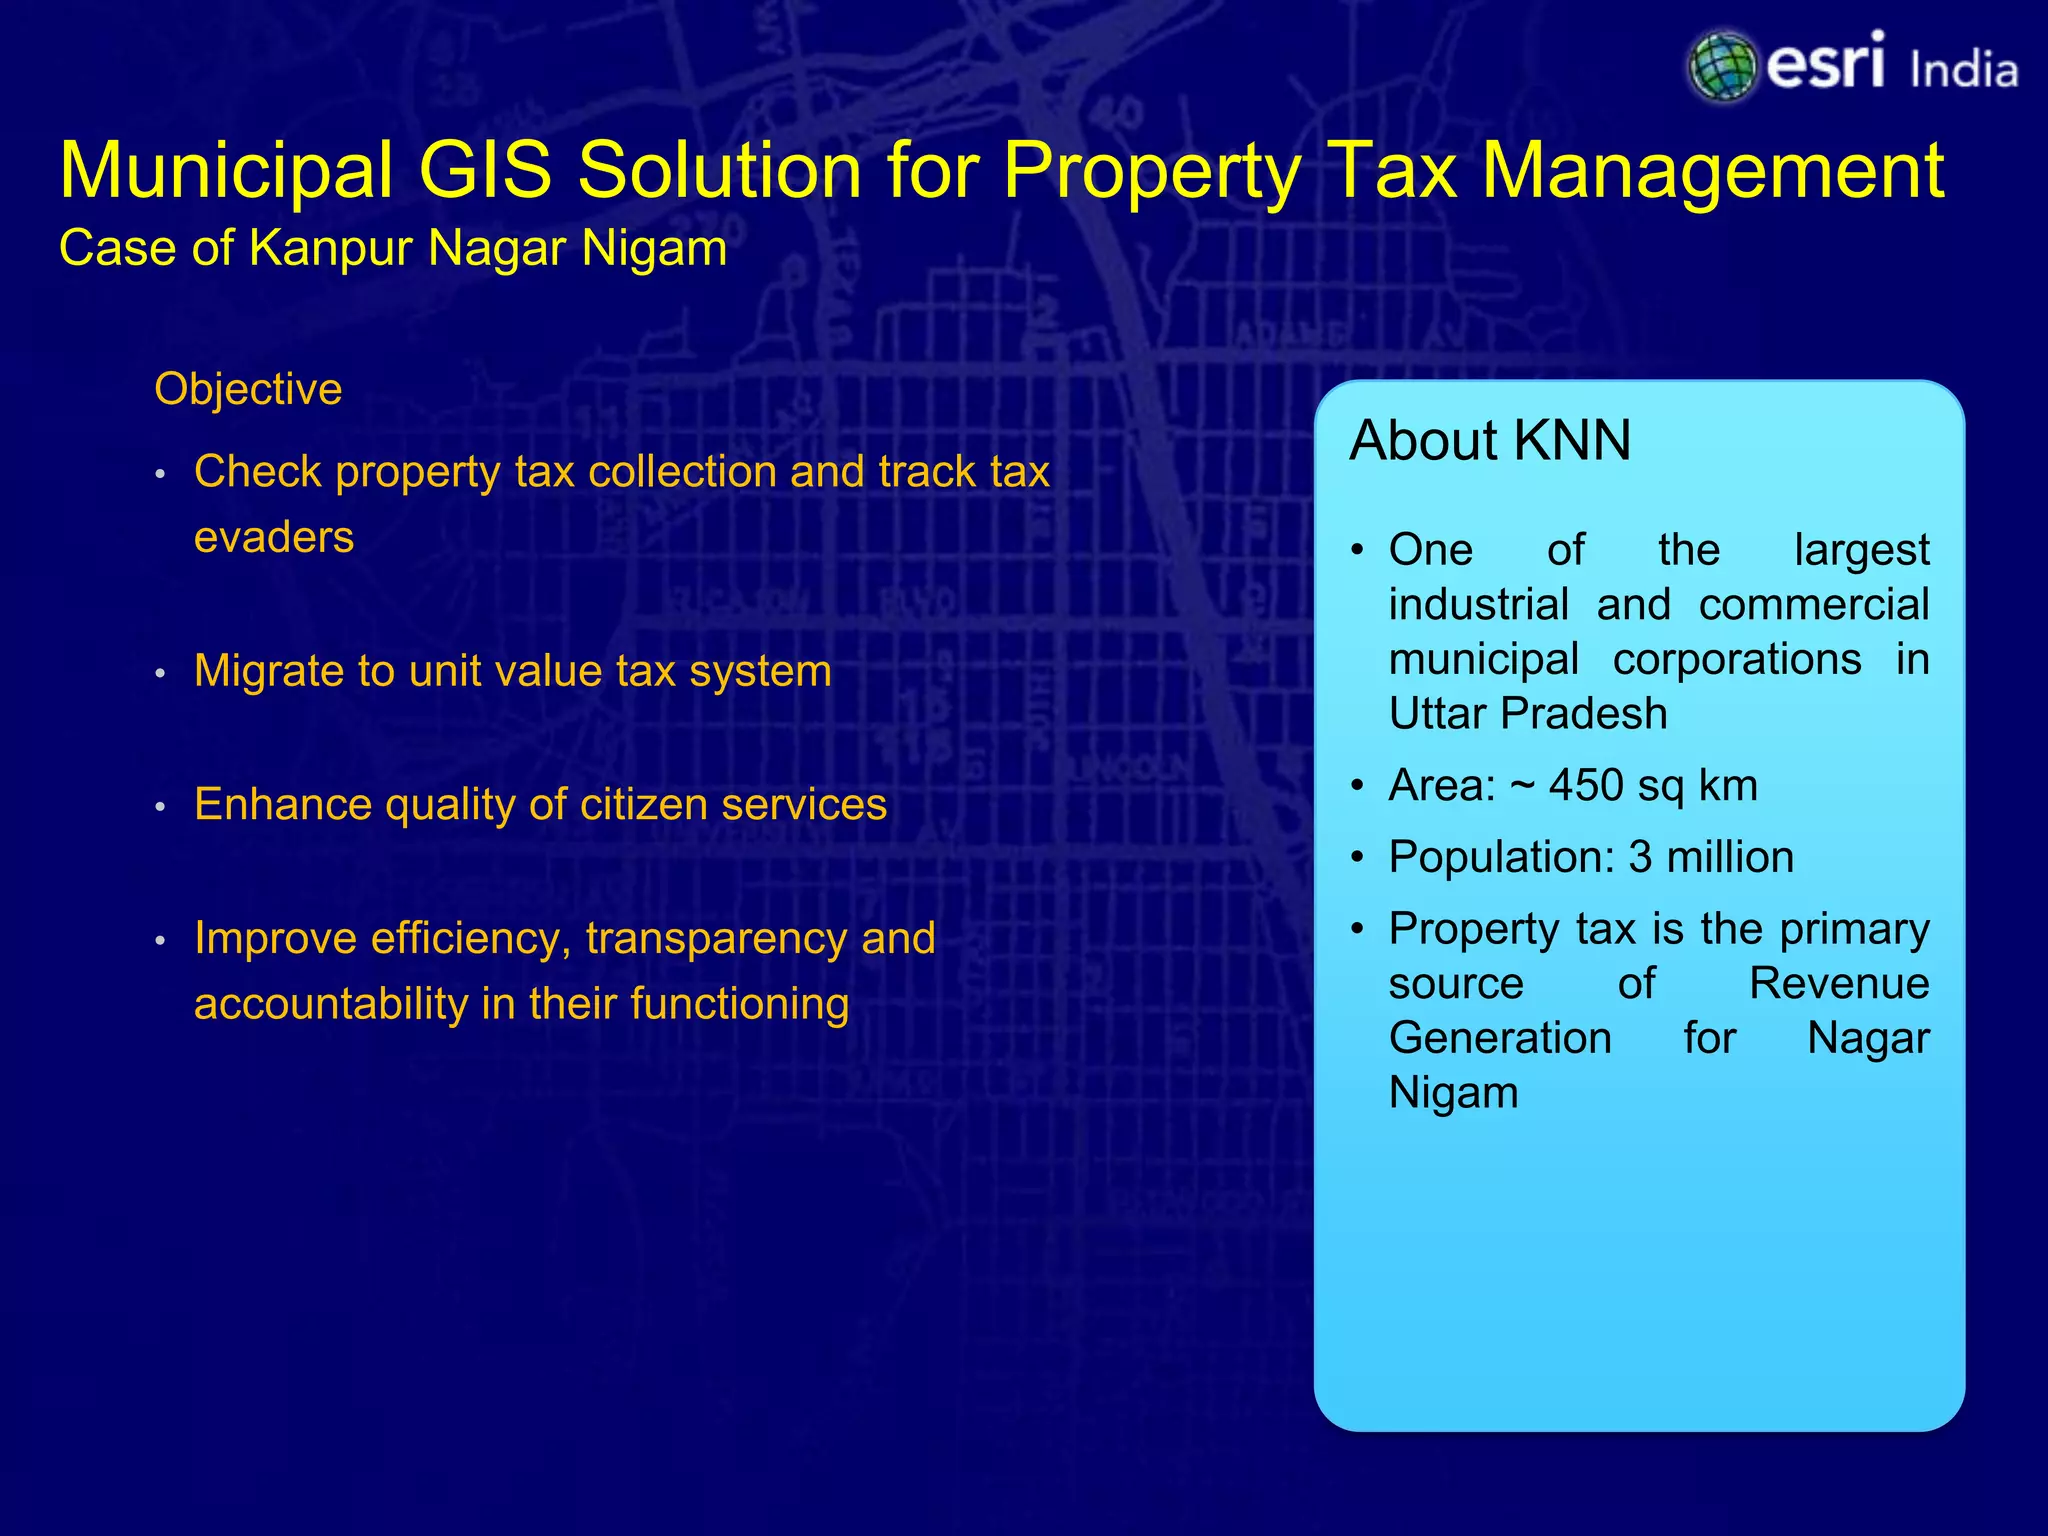
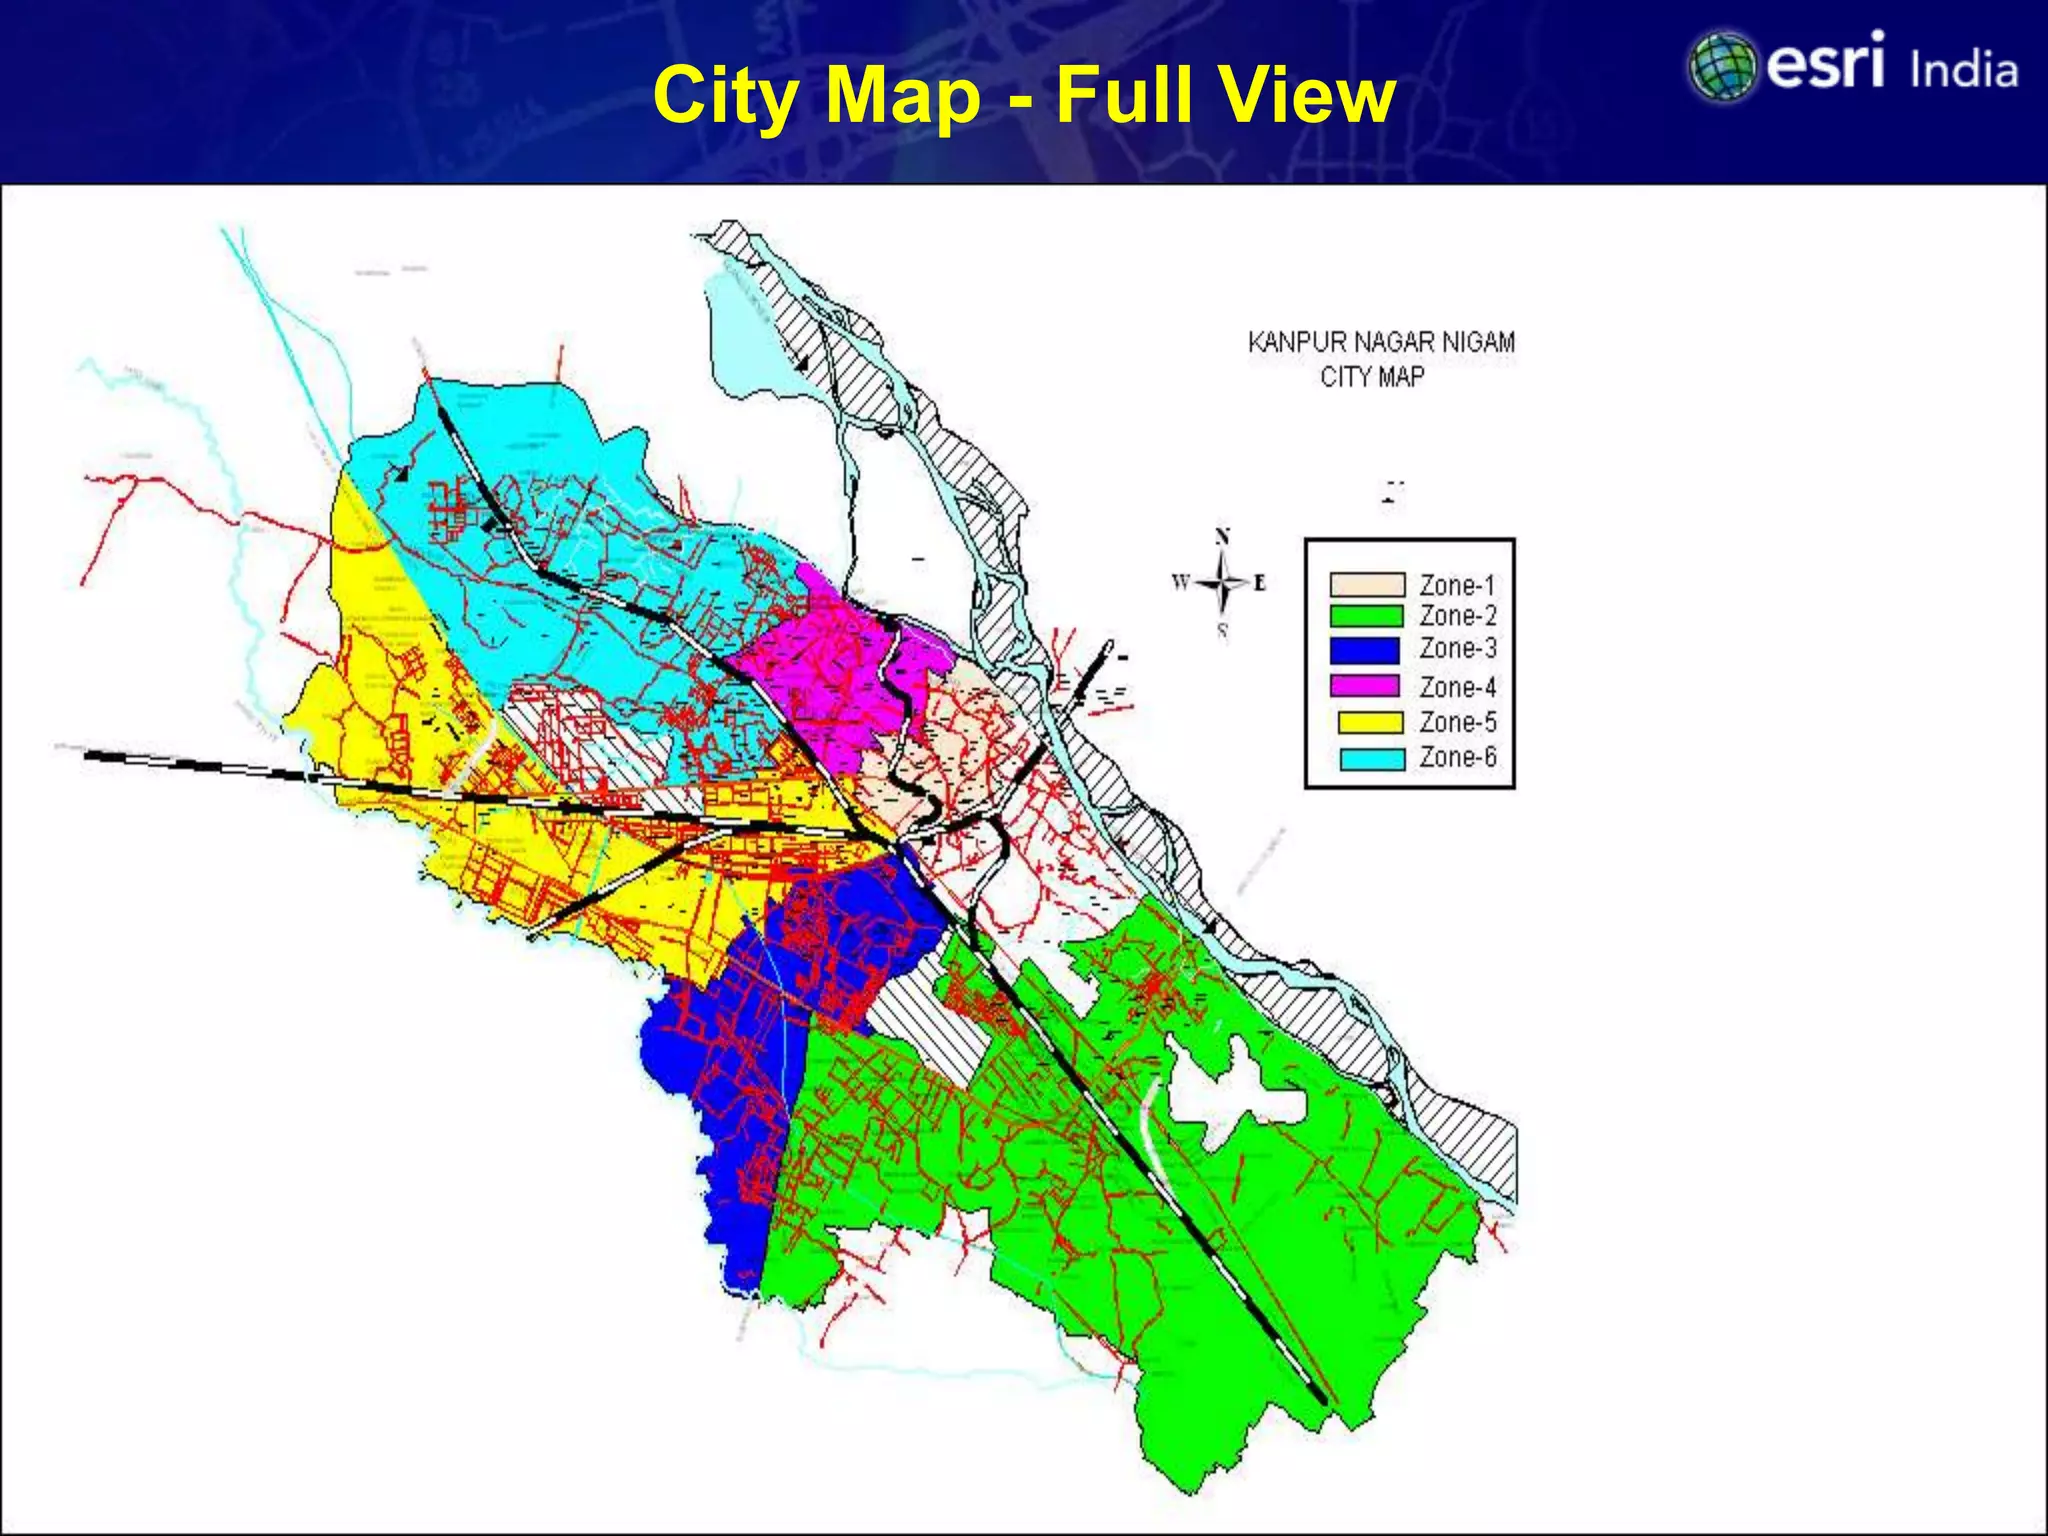
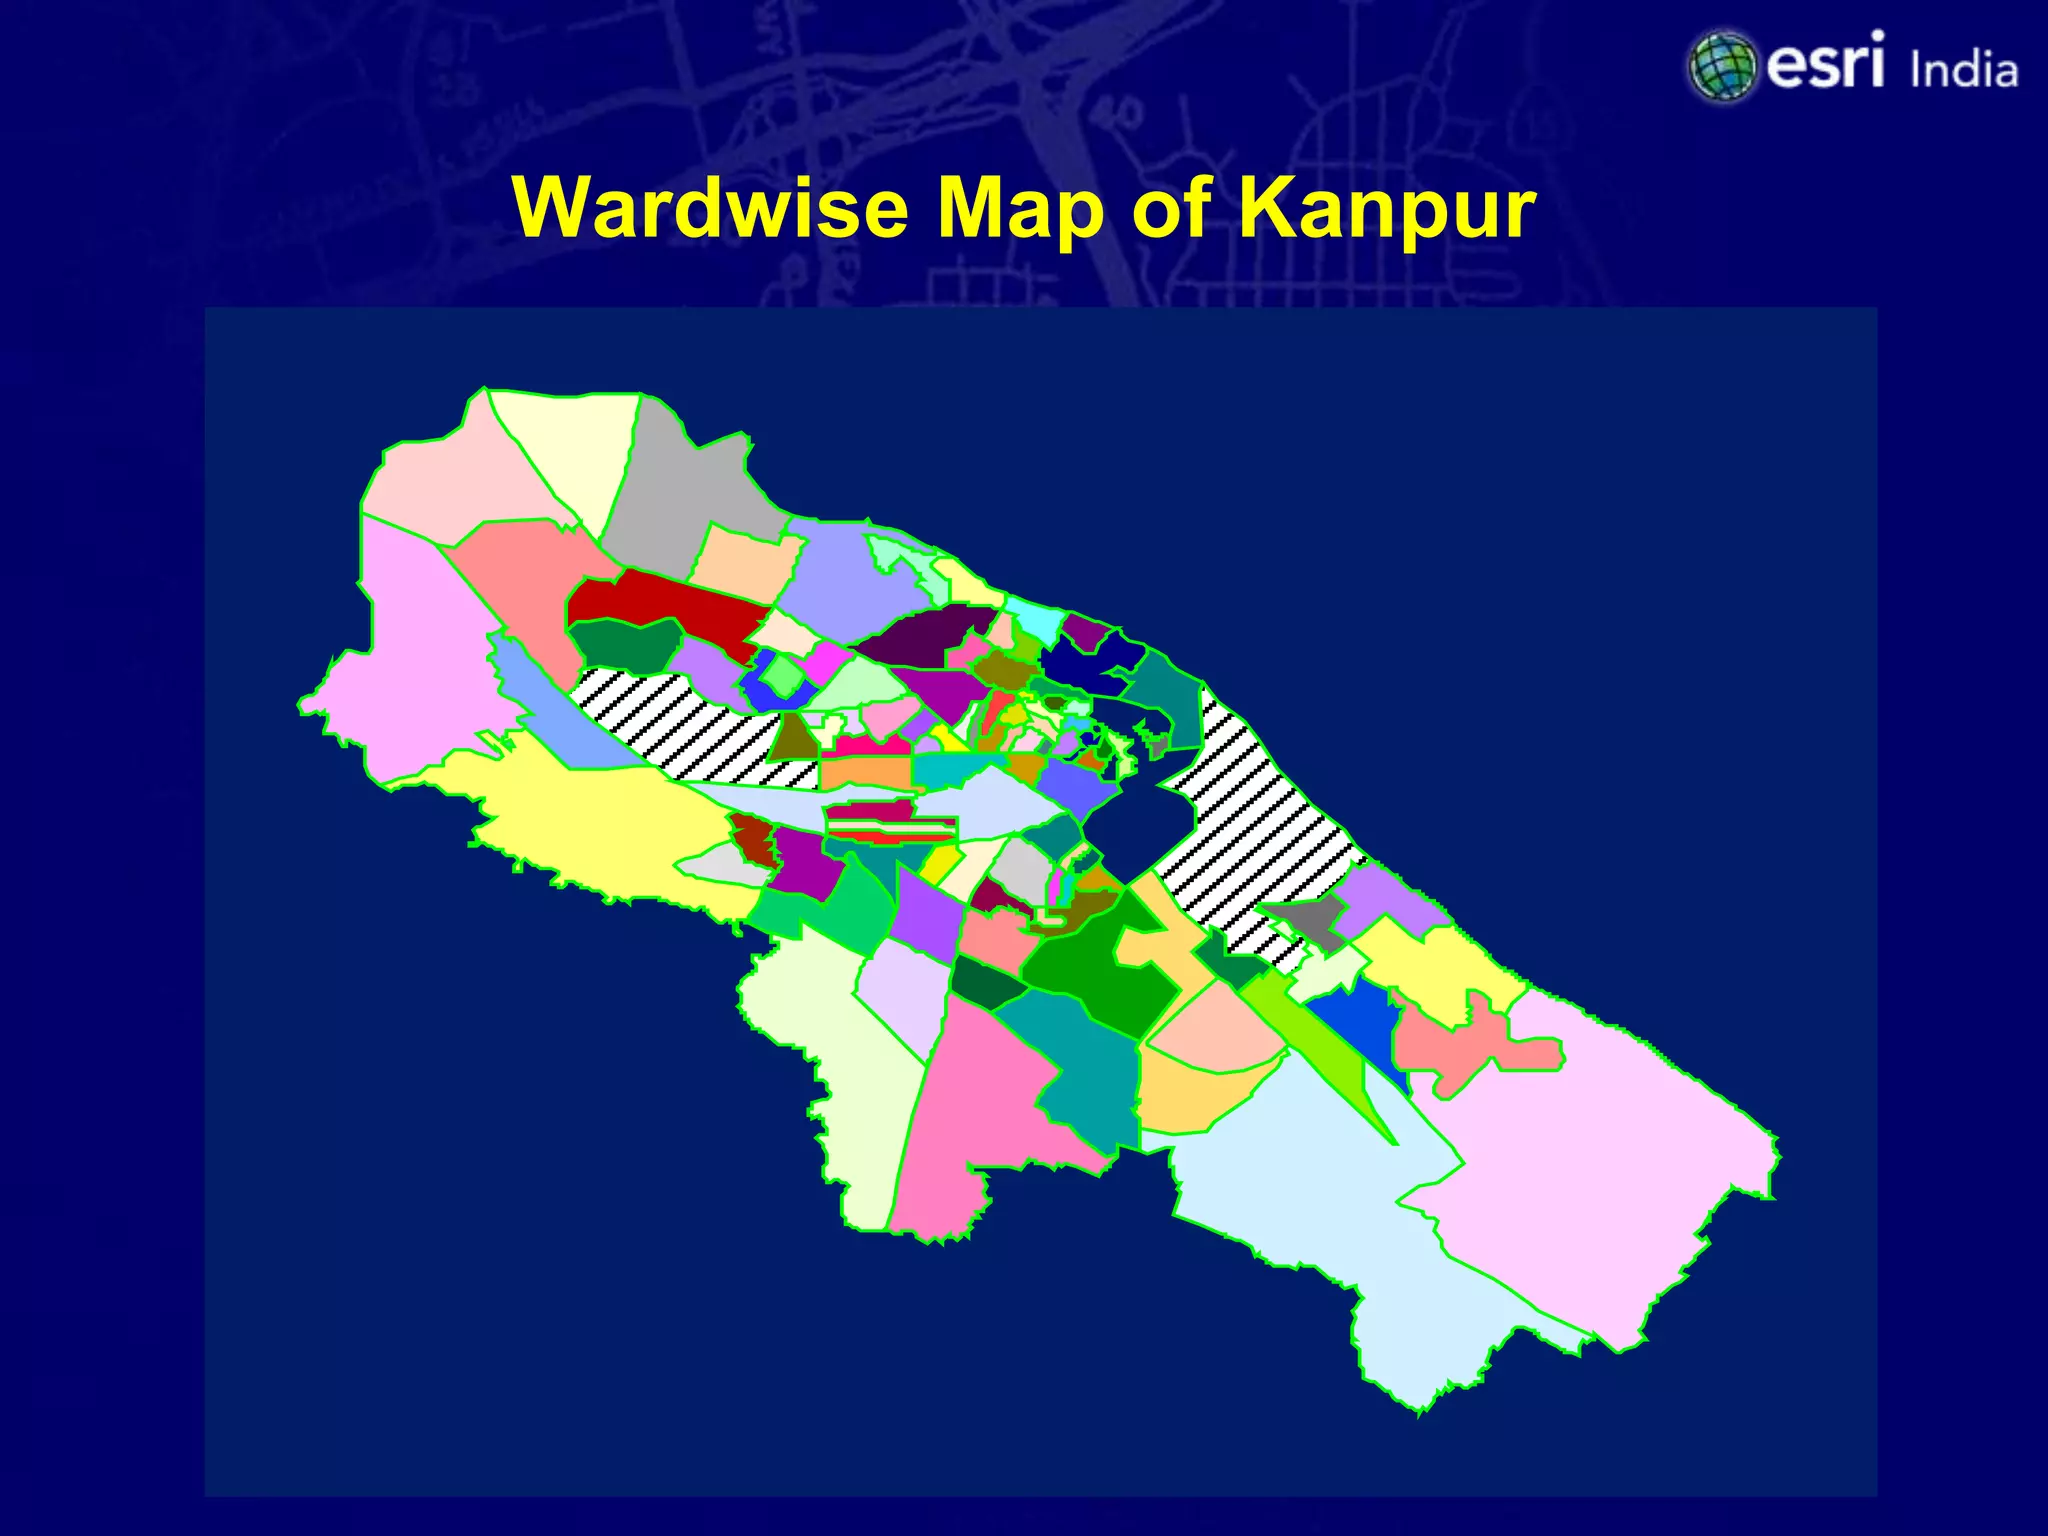
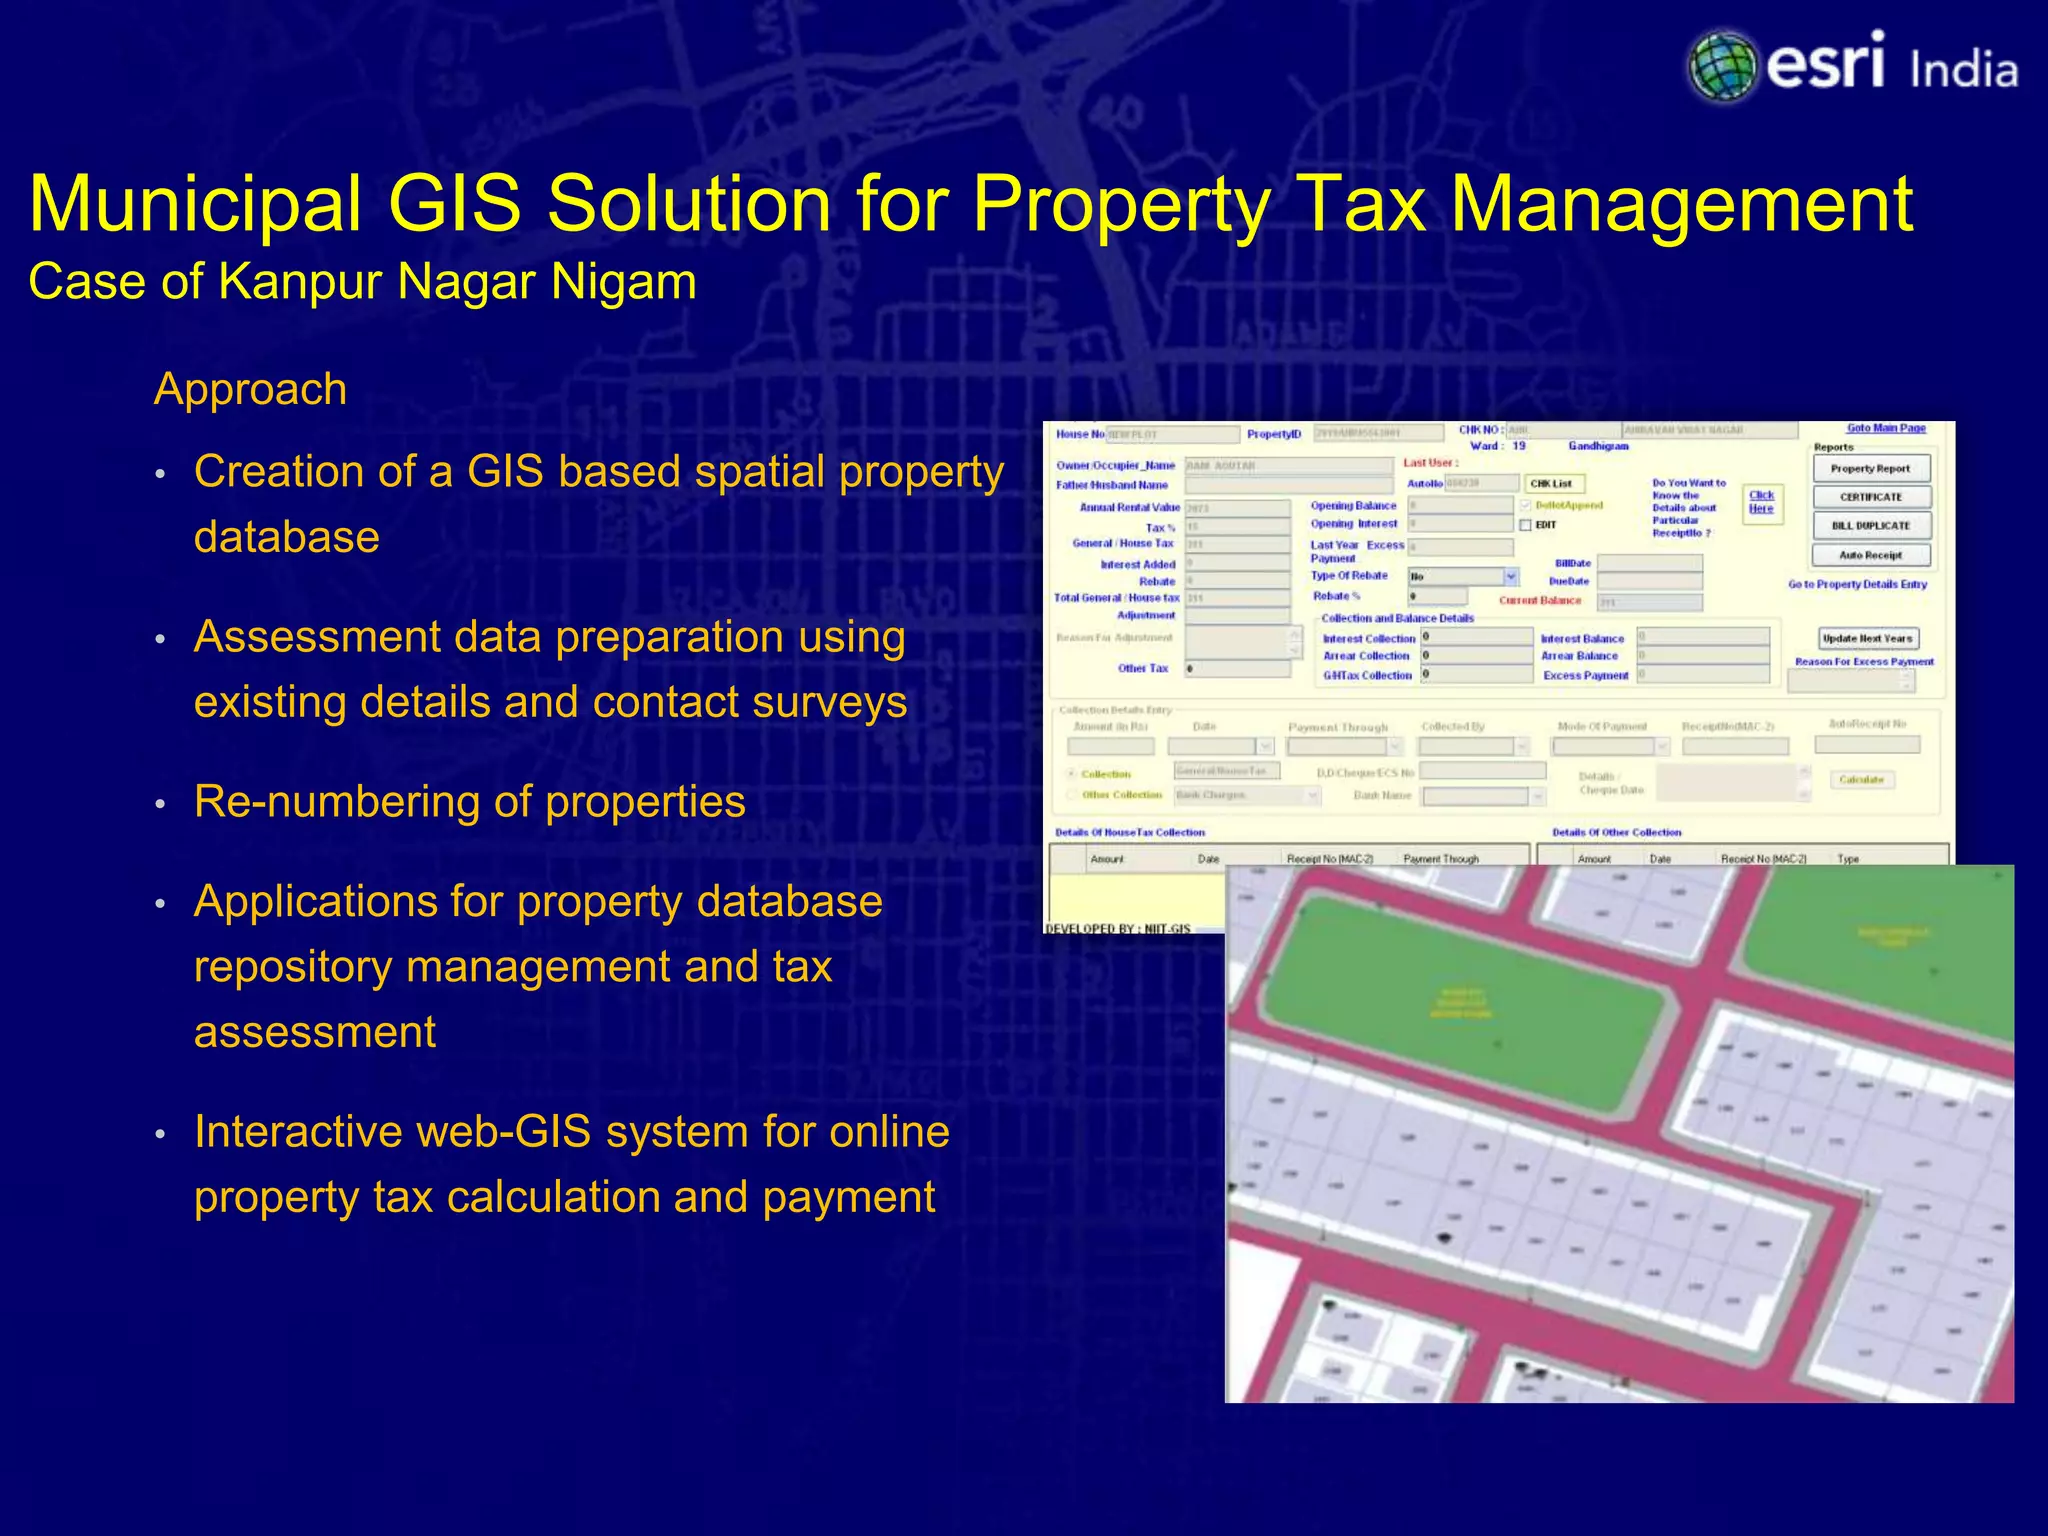
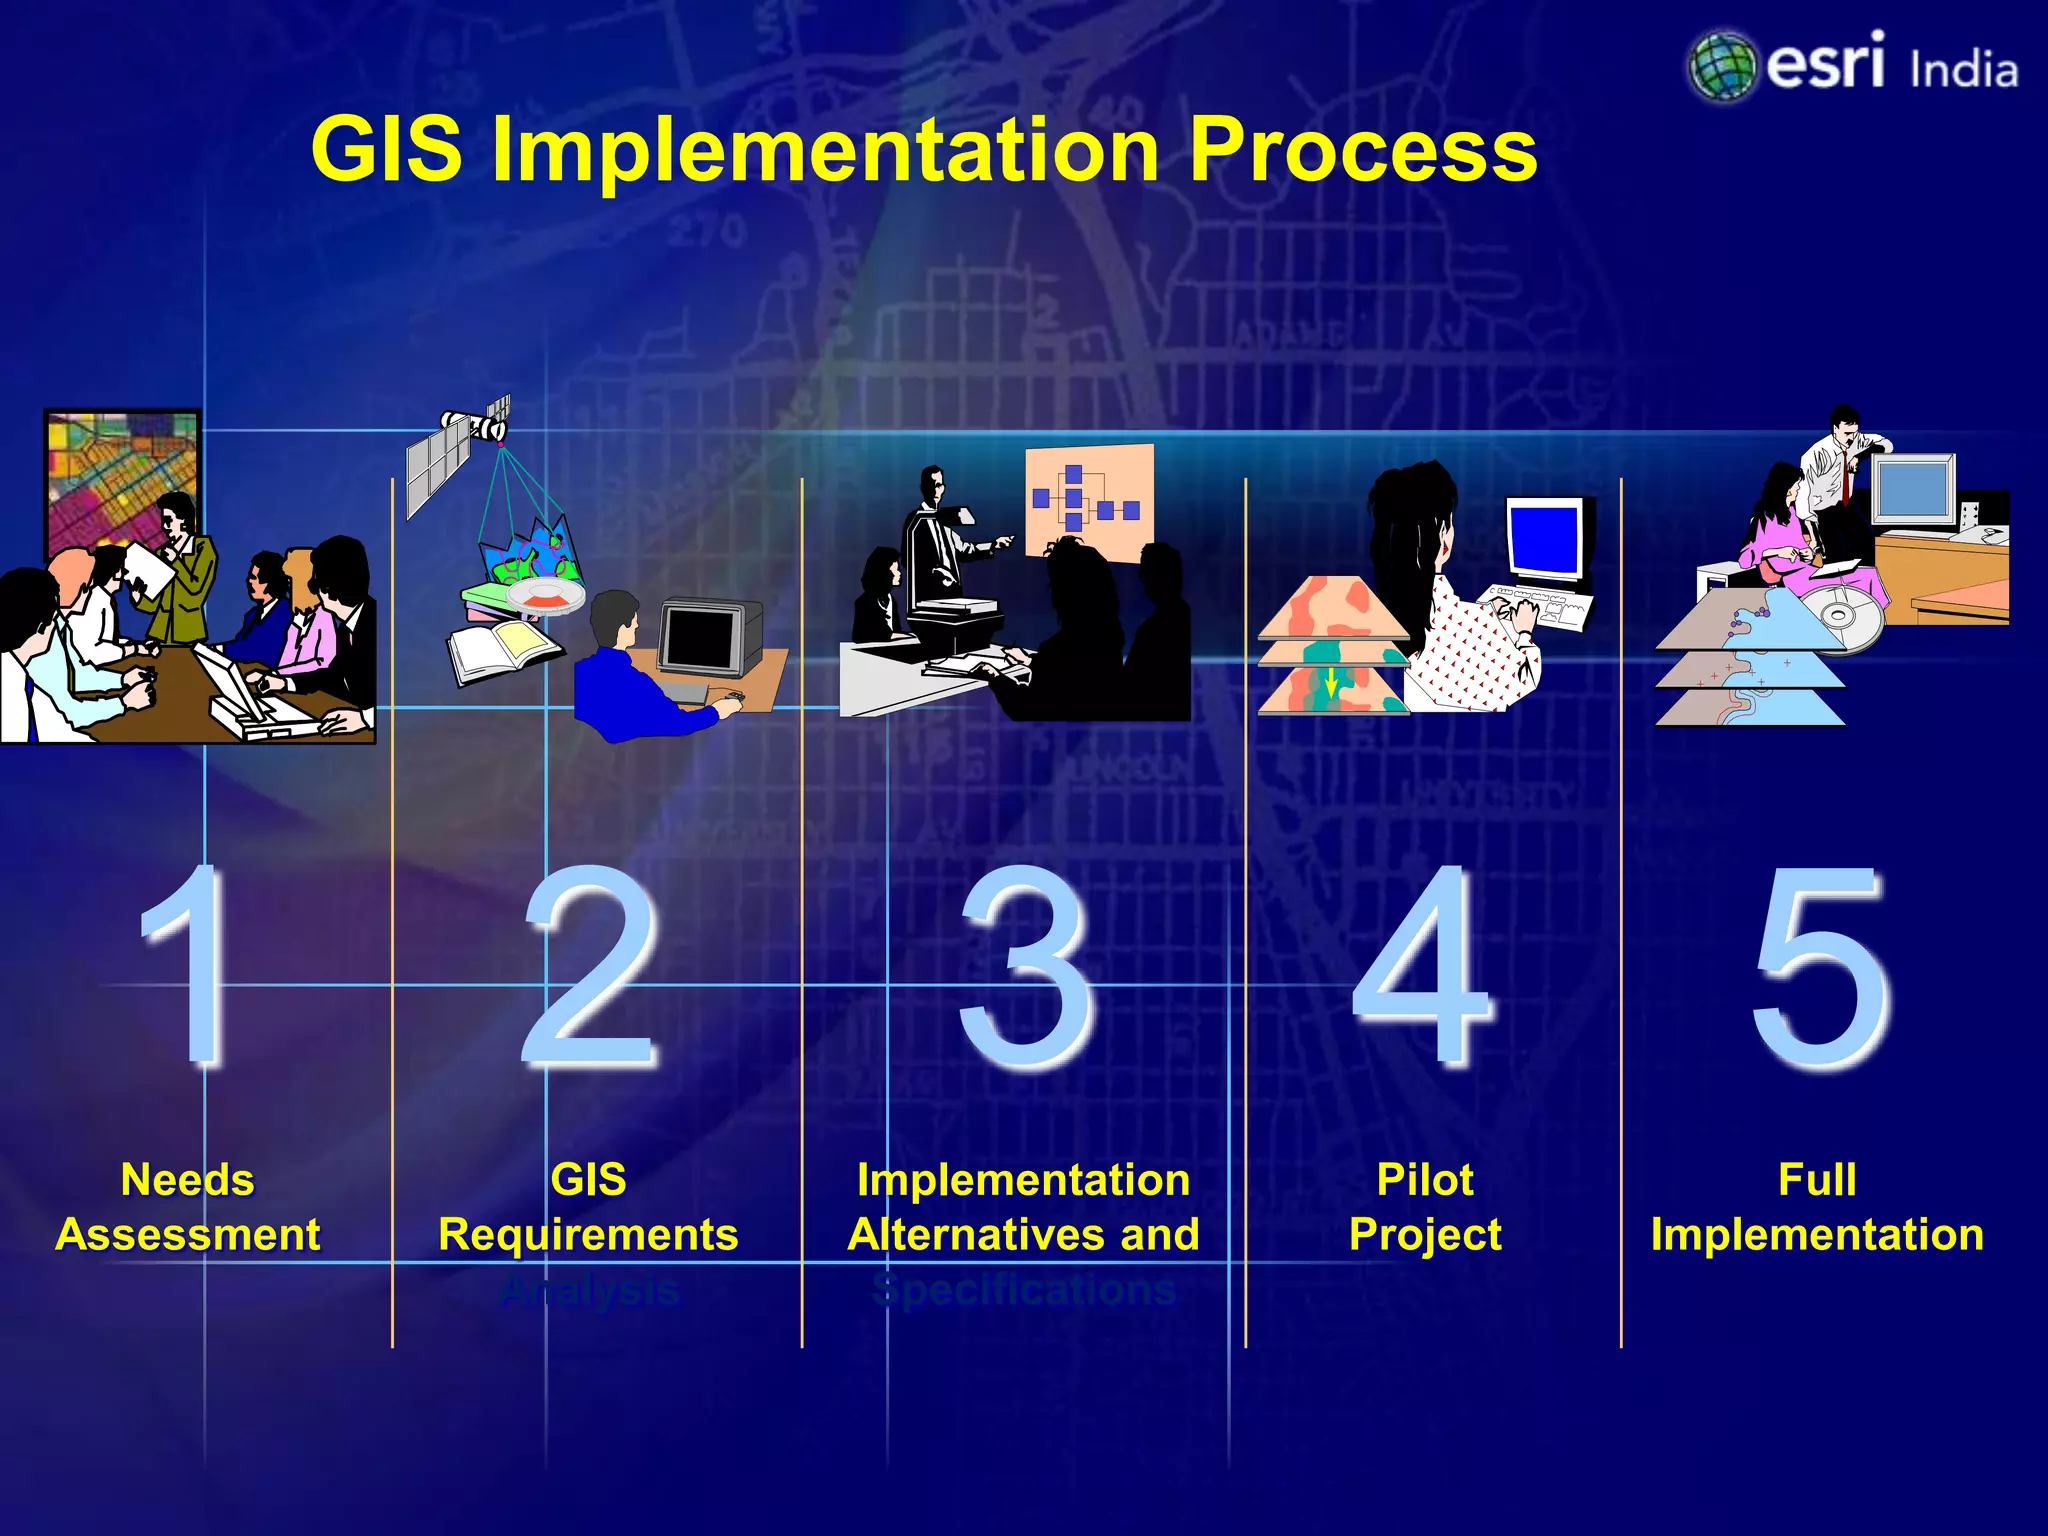
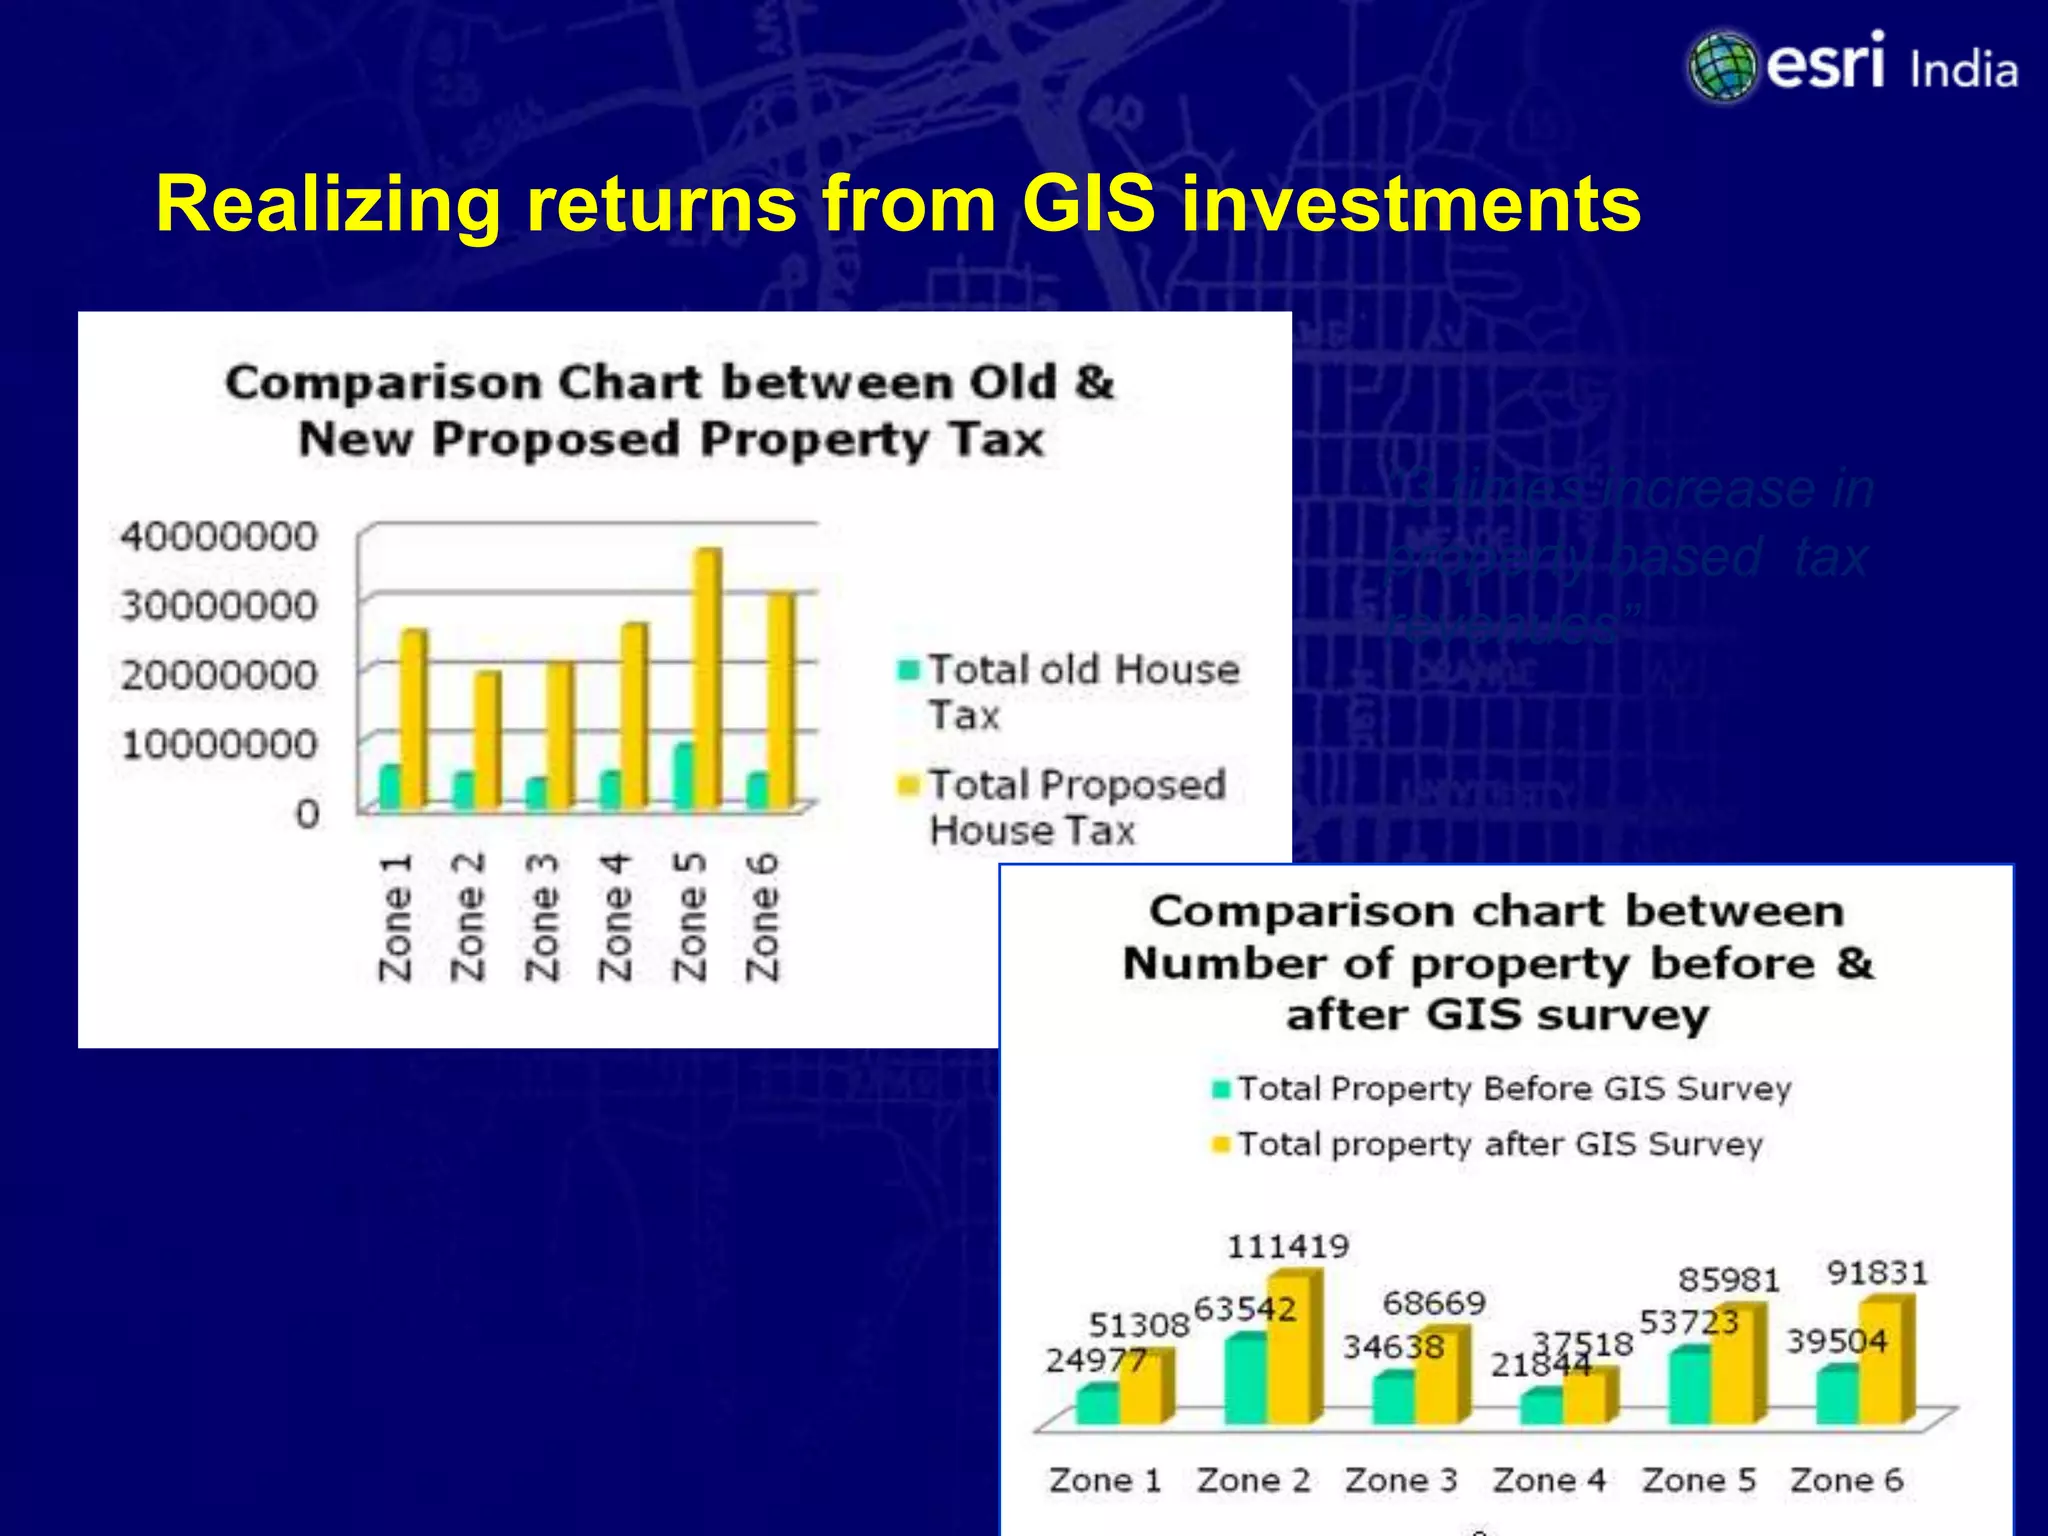
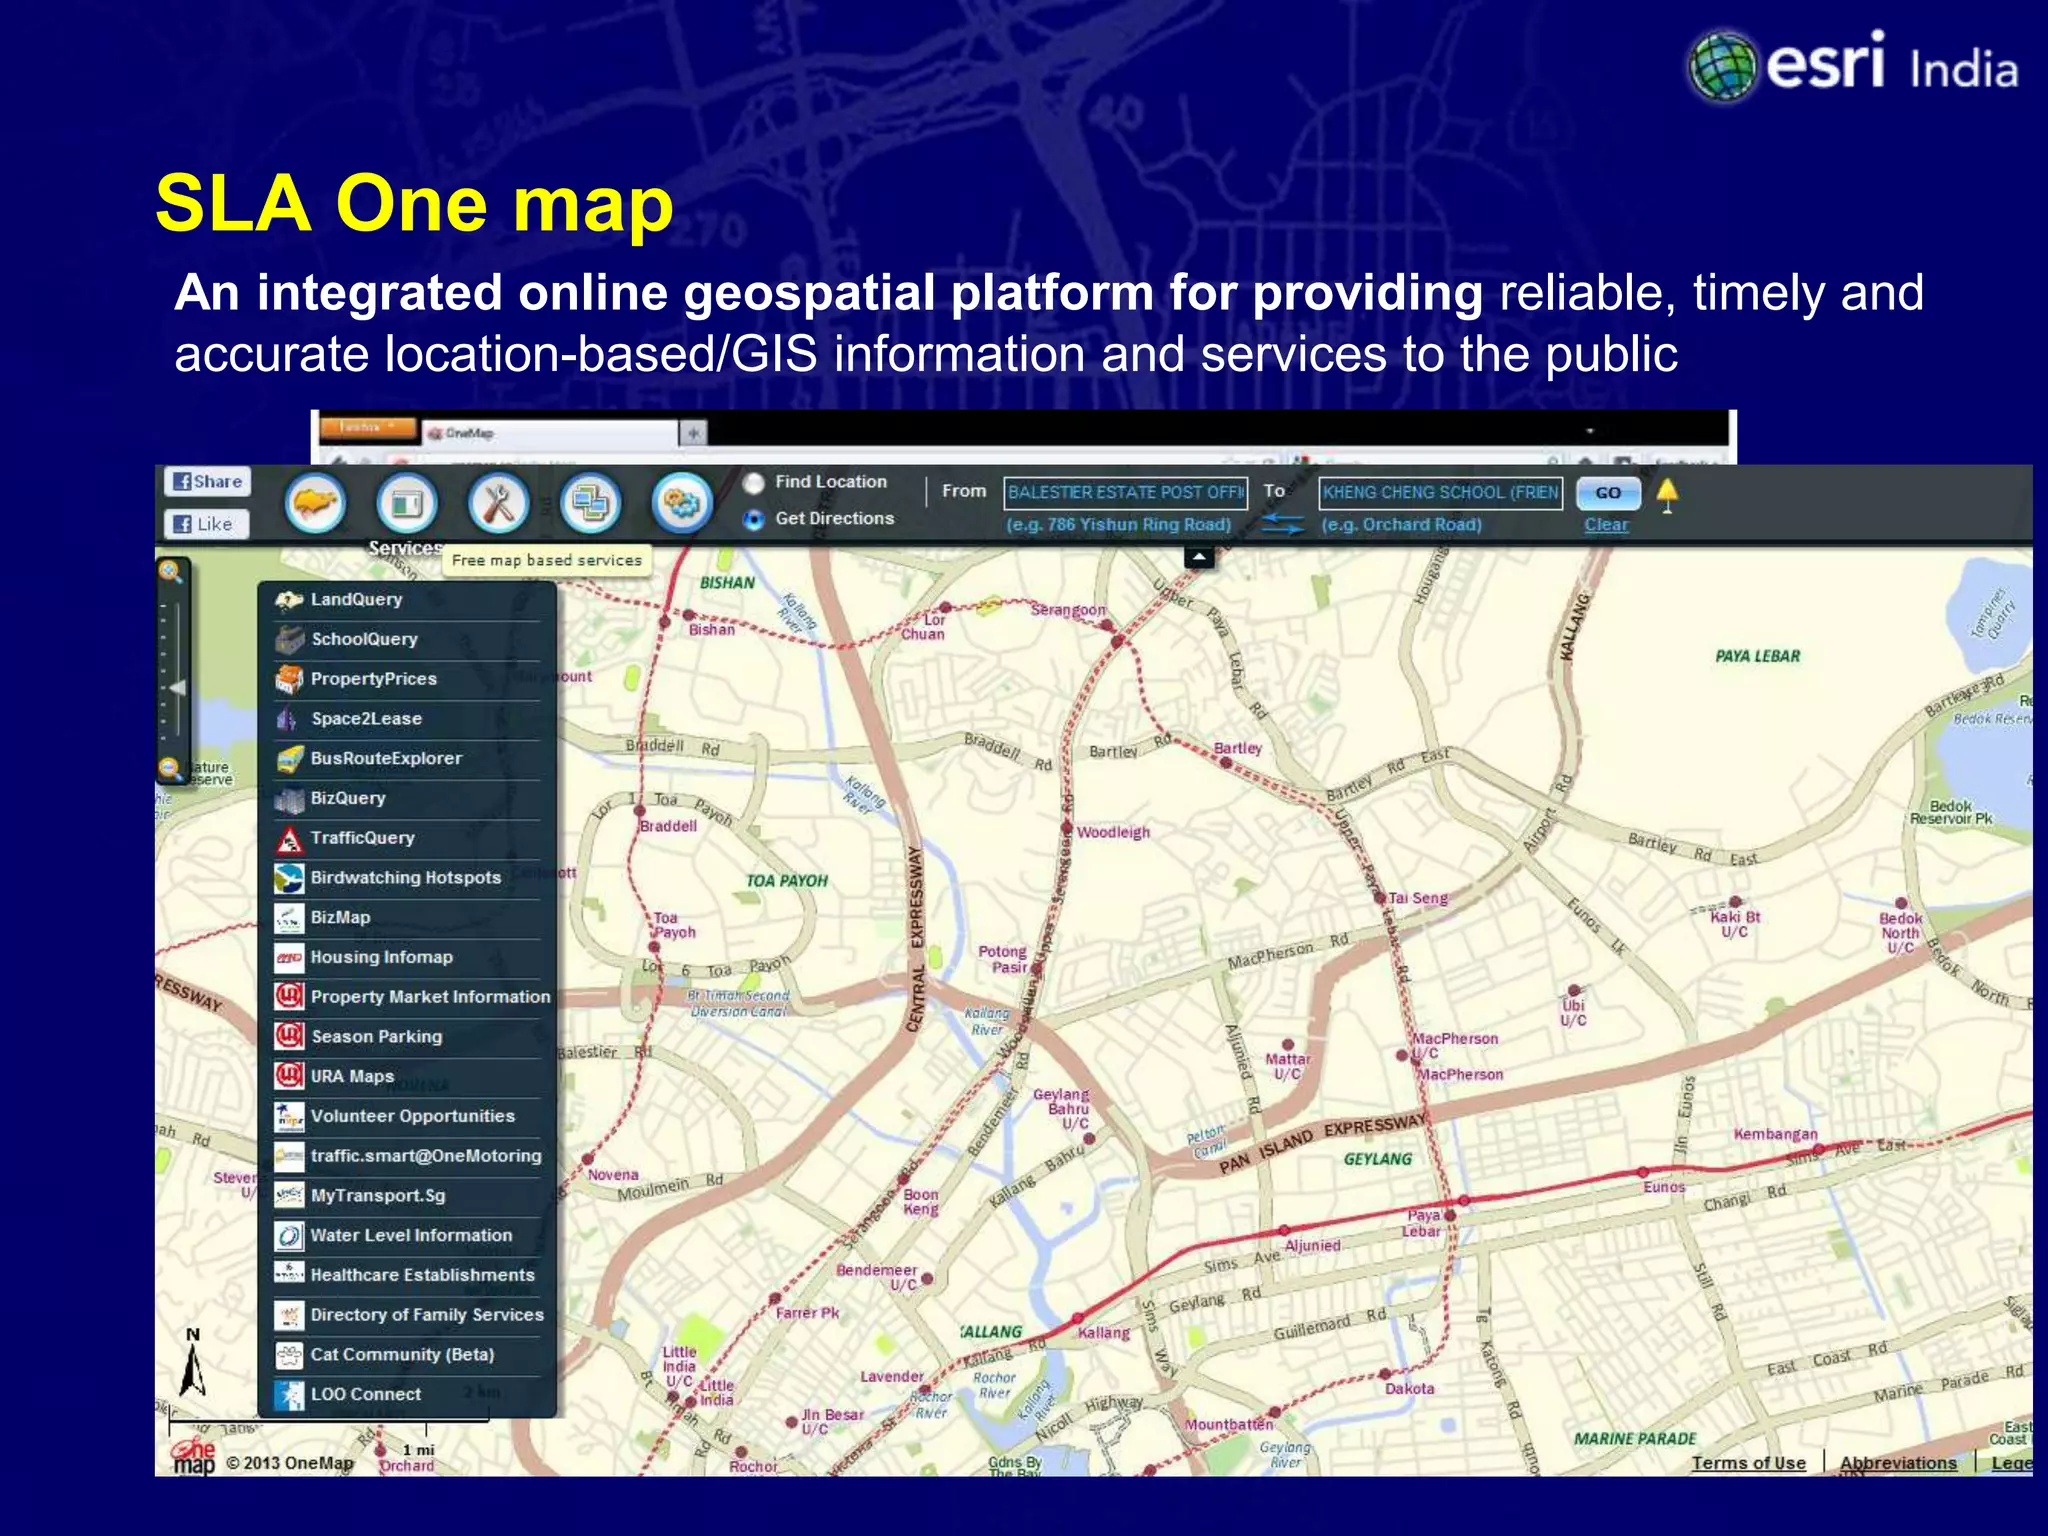
Revenue Collection and Management

            Rajesh C Mathur
             Vice Chairman,
         NIIT GIS Ltd (Esri India)
Agenda

•   Charter for a Municipal corporation
•   Realizing potential of Property Tax
•   GIS for Property taxation
•   Case study
•   Learning’s, Recommendations and Way forward
The World Is Facing Many Challenges

Increasing
•   Population
•   Consumption
•   Land Use Conflicts
•   Pollution
•   Health Needs


                                           Declining
                                           •   Resources
                                           •   Diversity
                                           •   Natural Areas
                                           •   Security


         . . . GIS Provides Many Solutions To Help
48% of World Population Lived in
        Urban Areas in 2003
         ( 3 Billion People)


Source: World Bank
48% of World Population Lived in
  Urban Areas in 2003 ( 3 Billion
             People)


         4.1 Billion People (55% of population)
               Will Live in Cities by 2020
Source: World Bank
As High as 40% of India’s
 Population will Live in Cities by
              2021


Source: Economic Times
Challenges for the City Planners
  •   Housing
  •   Public Utilities:
       -   Water
       -   Power
       -   Sewerage
       -   Solid Waste Management
  • Transportation
  • Healthcare
  • Environment Protection
  • Law Enforcement
  • Disaster Management
  •   Security
 And Raising Capital to Fund the Investment
Municipal revenues sources
•   Exclusive taxes
       - Property tax
       - Profession tax
       - Entertainment tax*
       - Advertisement tax*

•   Revenue-shared taxes
       -   All taxes on goods and services levied by the state government**
•   Non-tax revenue
       - User charges
       - Trade licensing fee
       - FSI charge/Betterment charge/Impact fee/Development charge


*if not subsumed under the GST.
** including value added tax (VAT)/sales tax, stamp duty, electricity, purchase tax, luxury tax, taxes on lottery, betting and gambling, entry laxes in lieu of
octroi, etc.
Note: FSI stands for floor space index.
Need to strengthen ‘Own revenue’ sources
Declining Share of Own Revenue
Property tax not being realized to its full potential


  •   Poor assessment rate
  •   Weak collection efficiency
  •   Need for better methods for property valuation
  •   Loss on account of exemptions


        How to overcome these challenges?
GIS can help in increasing property tax realization
 •   Link data visually on a common
     platform

 •   Easy, accurate collection of
     information

      •   Covered areaPlot Area, Locality
          details, Width of facing roads etc

 •   Less field visit for complaint
     redressal and other assessment
     purpose

 •   Greater visibility through multiple
     dashboards

 •   Transparency and consistency in tax
     assessment
Municipal GIS Solution for Property Tax Management
Case of Kanpur Nagar Nigam

   Objective
   •   Check property tax collection and track tax
                                                     About KNN
       evaders                                       • One     of   the   largest
                                                       industrial and commercial
   •   Migrate to unit value tax system                municipal corporations in
                                                       Uttar Pradesh
   •   Enhance quality of citizen services           • Area: ~ 450 sq km
                                                     • Population: 3 million
   •   Improve efficiency, transparency and          • Property tax is the primary
       accountability in their functioning             source     of      Revenue
                                                       Generation     for   Nagar
                                                       Nigam
City Map - Full View
Wardwise Map of Kanpur
Municipal GIS Solution for Property Tax Management
Case of Kanpur Nagar Nigam

    Approach
    •   Creation of a GIS based spatial property
        database

    •   Assessment data preparation using
        existing details and contact surveys

    •   Re-numbering of properties

    •   Applications for property database
        repository management and tax
        assessment

    •   Interactive web-GIS system for online
        property tax calculation and payment
GIS Implementation Process


  1 2
  Needs          GIS
                                3 4 5
                            Implementation      Pilot         Full
Assessment   Requirements   Alternatives and   Project   Implementation
               Analysis      Specifications
Project Implementation Phases
PHASE – I : Requirement Analysis
•  User Requirement Study
•  System Design
     • Database Modeling
     • Database and Application Design
     • Functional Design
PHASE – II: Development
•  Data Creation
•  Configuration
•  Customization/Application Development
•  Test cases and Testing
•  Integration
•  Pilot Implementation
•  User Acceptance Test
PHASE – III: Implementation
•  Enterprise Wide Implementation
•  User Training
•  Transfer of Technology
•  Support
Realizing returns from GIS investments


                               “3 times increase in
                               property based tax
                               revenues”
Challenges
• Limited awareness amongst local residents about their key property
  details

• Change Management {Internal & External -- building awareness on
  long-term benefits}

• Support of staff in survey and data collection

• Accessing and integrating legacy data from various other departments

• Need to build long-term vision, phased approach and management
  buy-in
Learning’s, Recommendations and Way forward

•   Re-engineer business processes to implement key IT initiatives

•   Creation of standardized workflows e.g. mandate GIS updates in any
    property related transactions

•   Maintain active and accurate database of taxpayers to minimize
    leakages

•   Regular revaluation of base for levying property tax

•   Web-enablement of tax collection through online payment /
    computerized collection centres

•   Opportunities to reuse GIS database across other initiatives for ULBs
SLA One map
An integrated online geospatial platform for providing reliable, timely and
accurate location-based/GIS information and services to the public
GIS for Revenue Collection and Management

GIS for Revenue Collection and Management

  • 1.
    Revenue Collection andManagement Rajesh C Mathur Vice Chairman, NIIT GIS Ltd (Esri India)
  • 2.
    Agenda • Charter for a Municipal corporation • Realizing potential of Property Tax • GIS for Property taxation • Case study • Learning’s, Recommendations and Way forward
  • 3.
    The World IsFacing Many Challenges Increasing • Population • Consumption • Land Use Conflicts • Pollution • Health Needs Declining • Resources • Diversity • Natural Areas • Security . . . GIS Provides Many Solutions To Help
  • 4.
    48% of WorldPopulation Lived in Urban Areas in 2003 ( 3 Billion People) Source: World Bank
  • 5.
    48% of WorldPopulation Lived in Urban Areas in 2003 ( 3 Billion People) 4.1 Billion People (55% of population) Will Live in Cities by 2020 Source: World Bank
  • 6.
    As High as40% of India’s Population will Live in Cities by 2021 Source: Economic Times
  • 7.
    Challenges for theCity Planners • Housing • Public Utilities: - Water - Power - Sewerage - Solid Waste Management • Transportation • Healthcare • Environment Protection • Law Enforcement • Disaster Management • Security And Raising Capital to Fund the Investment
  • 8.
    Municipal revenues sources • Exclusive taxes - Property tax - Profession tax - Entertainment tax* - Advertisement tax* • Revenue-shared taxes - All taxes on goods and services levied by the state government** • Non-tax revenue - User charges - Trade licensing fee - FSI charge/Betterment charge/Impact fee/Development charge *if not subsumed under the GST. ** including value added tax (VAT)/sales tax, stamp duty, electricity, purchase tax, luxury tax, taxes on lottery, betting and gambling, entry laxes in lieu of octroi, etc. Note: FSI stands for floor space index.
  • 9.
    Need to strengthen‘Own revenue’ sources Declining Share of Own Revenue
  • 10.
    Property tax notbeing realized to its full potential • Poor assessment rate • Weak collection efficiency • Need for better methods for property valuation • Loss on account of exemptions How to overcome these challenges?
  • 11.
    GIS can helpin increasing property tax realization • Link data visually on a common platform • Easy, accurate collection of information • Covered areaPlot Area, Locality details, Width of facing roads etc • Less field visit for complaint redressal and other assessment purpose • Greater visibility through multiple dashboards • Transparency and consistency in tax assessment
  • 12.
    Municipal GIS Solutionfor Property Tax Management Case of Kanpur Nagar Nigam Objective • Check property tax collection and track tax About KNN evaders • One of the largest industrial and commercial • Migrate to unit value tax system municipal corporations in Uttar Pradesh • Enhance quality of citizen services • Area: ~ 450 sq km • Population: 3 million • Improve efficiency, transparency and • Property tax is the primary accountability in their functioning source of Revenue Generation for Nagar Nigam
  • 13.
    City Map -Full View
  • 14.
  • 15.
    Municipal GIS Solutionfor Property Tax Management Case of Kanpur Nagar Nigam Approach • Creation of a GIS based spatial property database • Assessment data preparation using existing details and contact surveys • Re-numbering of properties • Applications for property database repository management and tax assessment • Interactive web-GIS system for online property tax calculation and payment
  • 16.
    GIS Implementation Process 1 2 Needs GIS 3 4 5 Implementation Pilot Full Assessment Requirements Alternatives and Project Implementation Analysis Specifications
  • 17.
    Project Implementation Phases PHASE– I : Requirement Analysis • User Requirement Study • System Design • Database Modeling • Database and Application Design • Functional Design PHASE – II: Development • Data Creation • Configuration • Customization/Application Development • Test cases and Testing • Integration • Pilot Implementation • User Acceptance Test PHASE – III: Implementation • Enterprise Wide Implementation • User Training • Transfer of Technology • Support
  • 18.
    Realizing returns fromGIS investments “3 times increase in property based tax revenues”
  • 19.
    Challenges • Limited awarenessamongst local residents about their key property details • Change Management {Internal & External -- building awareness on long-term benefits} • Support of staff in survey and data collection • Accessing and integrating legacy data from various other departments • Need to build long-term vision, phased approach and management buy-in
  • 20.
    Learning’s, Recommendations andWay forward • Re-engineer business processes to implement key IT initiatives • Creation of standardized workflows e.g. mandate GIS updates in any property related transactions • Maintain active and accurate database of taxpayers to minimize leakages • Regular revaluation of base for levying property tax • Web-enablement of tax collection through online payment / computerized collection centres • Opportunities to reuse GIS database across other initiatives for ULBs
  • 21.
    SLA One map Anintegrated online geospatial platform for providing reliable, timely and accurate location-based/GIS information and services to the public

Editor's Notes

  • #2 •             How can ICT help in the collection and management of ULB revenues, especially property tax?•             What have been some of the more successful initiatives in this regard?•             What are the key issues and challenges in the Indian context?
  • #14 In developed countries like Canada and the US, property tax revenues reach up to 3 to 4 per cent of GDP
  • #15 A recent study based on a survey of 36 largest cities in India shows that the major factors contributing to poor realisation from property tax are poor assessment rate (56 per cent of the properties covered), weak collection efficiency (37 per cent of the property tax demand raised), flawed methods for property valuation, loss on account of exemptions (11.7 per cent), and poorenforcement (Mathur et al. 2009).
  • #16 GIS based systems has the potential to link data visually on a common platformTransparency and consistency in tax assessment by reducing human interventionsEasy and accurate way of collecting key parameters required for tax calculation purpose, such as Covered area\\Plot Area, Locality details, Width of facing roads etcLess field visit for complaint redressal and other assessment purpose.Better report preparation facility such as mapping of defaulters or non- assessed propertiesFacility to calculate tax based on digitized areasBetter way of assigning new property / house numbers
  • #24 Political, bureaucratic and public