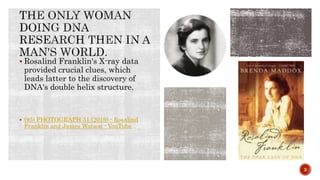
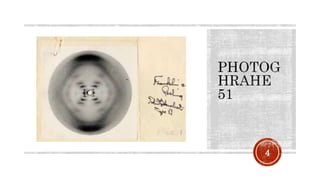
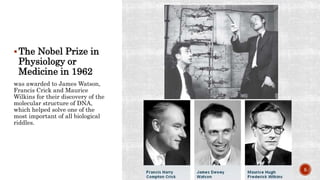
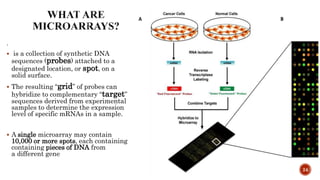
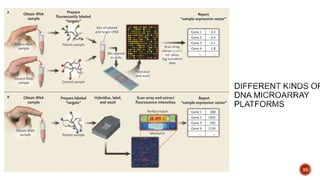
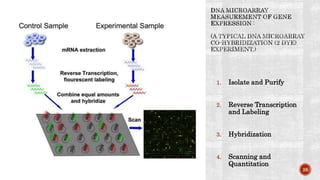
Decoding Genetic
Secrets with Microarrays
1
 Rosalind Franklin's X-ray data
provided crucial clues, which
leads latter to the discovery of
DNA's double helix structure.
 (95) PHOTOGRAPH 51 (2019) - Rosalind
Franklin and James Watson - YouTube
3
4
The Nobel Prize in
Physiology or
Medicine in 1962
was awarded to James Watson,
Francis Crick and Maurice
Wilkins for their discovery of the
molecular structure of DNA,
which helped solve one of the
most important of all biological
riddles.
5
6
 DNA (deoxyribonucleic acid)
Polynucleotide formed from covalently linked
deoxyribonucleotide units.
It serves as the store of hereditary information
within a cell and the carrier of this information
from generation to generation.
 Gene
Region of DNA that controls a discrete hereditary
characteristic, usually corresponding to a
single protein or RNA.
 Expression
Production of an
observable phenotype (observable character) by
a gene—usually by directing the synthesis of
a protein.
7
3D FROM DNA
TO PROTEIN
 https://www.youtube.com/watch?v=gG7uC
skUOrA
8
FROM
DNA'S
BLUEPRINT
TO
PROTEIN
INSTRUME
NTS
9
10
 Measure the amount of
mRNA for every gene that
present in the cell or tissue
sample.
 PVR Gene - GeneCards |
PVR Protein | PVR
Antibody
11
12
13
 Update:
In 2014, it takes 24 hours and $1,000 to sequence a
genome. This will help us deliver even better care to our
patients!
14
 A targeted DNA microarray runs
from $10 to $100 per sample,
says Schena, whereas “the whole
human genome is typically $100 to
$1,000 per sample.”
15
16
is a general laboratory approach that involves
binding an array of thousands to millions of
known nucleic acid fragments to a solid surface,
referred to as a “chip.
17
Individual Gene
Analysis:
Then, researchers had to analyze each
gene within that region separately.
 Southern blot
is the process of transfer of
DNA/RNA fragments that are separated by
electrophoresis onto a membrane for
immobilization and identification.
Time-Consuming
18
19
20
 Parallel Analysis:
Microarray chips allow researchers to place
probes for thousands of genes on a single chip
 Single Experiment:
A single experiment analyzes the expression of
all genes simultaneously, revealing which ones
are actively expressed .
 High-Throughput Screening:
Microarrays enable rapid testing of hundreds of
candidate genes, accelerating the identification
of the specific gene responsible.
21
22
 is a thin-sized chip
that has been spotted
at fixed locations with
thousands of single-
stranded DNA
fragments
corresponding to
various genes of
interest.
23
.
 is a collection of synthetic DNA
sequences (probes) attached to a
designated location, or spot, on a
solid surface.
 The resulting “grid” of probes can
hybridize to complementary “target”
sequences derived from experimental
samples to determine the expression
level of specific mRNAs in a sample.
 A single microarray may contain
10,000 or more spots, each containing
containing pieces of DNA from
a different gene
24
25
1. Isolate and Purify
2. Reverse Transcription
and Labeling
3. Hybridization
4. Scanning and
Quantitation
26
 https://learn.genetics.utah.edu/content/labs/microarray/
27
 Some methods basically use a robot to “print” pre-designed probes that have been
attached to fine needles onto a chemical matrix surface using surface engineering
(examples include fine-pointed pins, needles, and ink-jet printing).
 Other methods employ photo-activated chemistry and masking to synthesize probes
one nucleotide at a time on a solid surface in repeated steps to build up probes of
specific sequences in designated locations.
28
 GeneChipâ„
¢ :: CSHL
DNA
Learning
Center
29
 Affymetrix GeneChip arrays
being the most common.
 These are made using
photolithography, use light to
create a pattern.
 The method relies on UV
masking and light-directed
combinatorial chemical
synthesis on a solid support to
selectively synthesize probes
directly on the surface of the
array,
 one nucleotide at a time per
spot, for many spots
simultaneously .
30
 Fast and affordable: They can check thousands of genes all
at once, like a high-speed gene scanner!
 Proven track record: They've been around for years and
helped us learn a lot about diseases.
 Cost-effective: They're cheaper than some newer detective
tools 31
 Blind spots:
They can only see genes that they already know
about, so they might miss new clues.
 Slow updates:
If we find a new gene to investigate, it takes time to
update the microarray "wanted list."
 Tricksy results:
Sometimes they get confused and give us wrong
answers, like a detective with bad eyesight.
 Alternatives:
 RNA-Seq: Offers superior flexibility for uncovering unknown
genes and mutations, but at a higher cost. 32
33
ANALYSIS OF MICROARRAY
DATA
 Feature extraction
is the process of converting the scanned image of the microarray
into quantifiable (computable) values and annotating it with the
gene IDs, sample names and other useful information
 Quality control
 Normalisation
 Differential expression analysis
 Biological interpretation of the results:
Many of the methods for visualising and interpreting microarray data
 Submission of data to a public database
34
 Array intensity distributions (Boxplots) :
Shows overall gene activity levels
 PCA plot (Principal Component Analysis) :
Reveals patterns in gene behavior
 Density estimates:
Takes a closer look at gene activity groups, showing how common each level is. 35
 The goal of differential expression analysis is to identify
genes whose expression differs under different conditions.
 An important consideration for differential expression
analysis is correction for multiple testing ( statistical
phenomenon )
 . This leads to an increased chance of false positive results
 creates a log2 fold change ratio between the test and
control condition and an ‘adjusted’ p-value that rates the
significance of the difference
ANALYSIS
OF
MICROARR
AY DATA
37
WHY
DIFFERENTI
AL
EXPRESSION
?
Fluorescent intensities do not directly
correspond to mRNA concentrations, due
to:
 different shapes and densities of spots
 different hybridization properties
between genes
 different amounts of dye incorporation
between genes from two samples.
38
 Genotyping Array Development: A custom Axiom
genotyping array is being developed for pan-Arab
populations using whole genome sequencing data from 19
Arab countries.
 Array Features:
 Approximately 800,000 variants
 Targets conditions including diabetes, cardiovascular
diseases, autism, inherited disorders, and cancer.
 Objective: Facilitate scientific research and insights,
providing a cost-effective alternative to whole genome
sequencing.
 The collaboration includes custom genotyping arrays
designed to accelerate genomic research and clinical
applications of predictive genomics across Arab populations
39
QATAR GENOME
PROGRAM
 The Qatar Genome Programme (QGP) is a national
population-based research project which studies the
genetic makeup of Qatari and other Arab
populations with a view to introducing personalised
and precision medicine into the national health care
system. The QCP has already sequenced the
genomes of 25,000 Qataris. Now in phase 3, this
project aims to sequence 100,000 genomes by 2025.
 As of July 2023, Qatar had 514,524 confirmed
COVID-19 cases and 690 confirmed COVID-19
deaths. Qatar was the only Arab country to
participate in the COVID-19 Host Initiative, an
international collaboration to map the human
genetic architecture of COVID-19 in 2020, and it was
one of the few non-European or North American
contributors.
40
THERMO FISHER
SCIENTIFIC AND QATAR
GENOME PROGRAM:
ADVANCE GENOMIC
RESEARCH FOR ARAB
POPULATIONS
 Previous Collaboration:
 Establishment: Collaboration began in
2018, resulting in the development of
the Q-Chip microarray designed for
the Qatari population.
 Continued Refinement: Ongoing
refinement of algorithms and
clinically actionable content, including
polygenic risk scores and
pharmacogenomics.
41
DISEASE
GENOMICS
DATABASE
 Qatar Genome is currently working on
establishing the Disease Genomics Database
(DGD) to allow data sharing and
empowerment of genomic research and
discovery related to diseases of national
priority in Qatar and the region.
 If you are interested in participating in this
database, you can contact this
email hrashid@qf.org.qa
 Click here to Download DGD Affiliation
Request Form
42
43
44
 www.thermofisher.com
 https://www.qatargenome.org.qa/
45
 This theory proposes that some of our
genes (particularly those involved in
energy production) originated from ancient
viruses that invaded our ancestors billions
of years ago. These viruses, instead of
destroying the cell, entered a symbiotic
relationship, providing crucial functions.
Over time, their DNA became integrated
into our genome, contributing to our
evolution and adaptation. This theory still
sparks debates, but it's a captivating
narrative about the potential "alien"
origins of some human genes
46
 While only about 2% of human DNA
codes for proteins, the remaining 98%
used to be considered "junk DNA."
Recent research suggests this so-called
"dark matter" plays a crucial role in
regulating gene expression, cell
development, and even behavior. Some
theories propose that these non-coding
regions interact with environmental
factors and contribute to individual
differences and even evolution in ways
we're only beginning to understand.
47

Gene Expression Analysis with microarray.pptx

  • 1.
  • 2.
     Rosalind Franklin'sX-ray data provided crucial clues, which leads latter to the discovery of DNA's double helix structure.  (95) PHOTOGRAPH 51 (2019) - Rosalind Franklin and James Watson - YouTube 3
  • 3.
  • 4.
    The Nobel Prizein Physiology or Medicine in 1962 was awarded to James Watson, Francis Crick and Maurice Wilkins for their discovery of the molecular structure of DNA, which helped solve one of the most important of all biological riddles. 5
  • 5.
  • 6.
     DNA (deoxyribonucleicacid) Polynucleotide formed from covalently linked deoxyribonucleotide units. It serves as the store of hereditary information within a cell and the carrier of this information from generation to generation.  Gene Region of DNA that controls a discrete hereditary characteristic, usually corresponding to a single protein or RNA.  Expression Production of an observable phenotype (observable character) by a gene—usually by directing the synthesis of a protein. 7
  • 7.
    3D FROM DNA TOPROTEIN  https://www.youtube.com/watch?v=gG7uC skUOrA 8
  • 8.
  • 9.
  • 10.
     Measure theamount of mRNA for every gene that present in the cell or tissue sample.  PVR Gene - GeneCards | PVR Protein | PVR Antibody 11
  • 11.
  • 12.
  • 13.
     Update: In 2014,it takes 24 hours and $1,000 to sequence a genome. This will help us deliver even better care to our patients! 14
  • 14.
     A targetedDNA microarray runs from $10 to $100 per sample, says Schena, whereas “the whole human genome is typically $100 to $1,000 per sample.” 15
  • 15.
    16 is a generallaboratory approach that involves binding an array of thousands to millions of known nucleic acid fragments to a solid surface, referred to as a “chip.
  • 16.
  • 17.
    Individual Gene Analysis: Then, researchershad to analyze each gene within that region separately.  Southern blot is the process of transfer of DNA/RNA fragments that are separated by electrophoresis onto a membrane for immobilization and identification. Time-Consuming 18
  • 18.
  • 19.
  • 20.
     Parallel Analysis: Microarraychips allow researchers to place probes for thousands of genes on a single chip  Single Experiment: A single experiment analyzes the expression of all genes simultaneously, revealing which ones are actively expressed .  High-Throughput Screening: Microarrays enable rapid testing of hundreds of candidate genes, accelerating the identification of the specific gene responsible. 21
  • 21.
  • 22.
     is athin-sized chip that has been spotted at fixed locations with thousands of single- stranded DNA fragments corresponding to various genes of interest. 23
  • 23.
    .  is acollection of synthetic DNA sequences (probes) attached to a designated location, or spot, on a solid surface.  The resulting “grid” of probes can hybridize to complementary “target” sequences derived from experimental samples to determine the expression level of specific mRNAs in a sample.  A single microarray may contain 10,000 or more spots, each containing containing pieces of DNA from a different gene 24
  • 24.
  • 25.
    1. Isolate andPurify 2. Reverse Transcription and Labeling 3. Hybridization 4. Scanning and Quantitation 26
  • 26.
  • 27.
     Some methodsbasically use a robot to “print” pre-designed probes that have been attached to fine needles onto a chemical matrix surface using surface engineering (examples include fine-pointed pins, needles, and ink-jet printing).  Other methods employ photo-activated chemistry and masking to synthesize probes one nucleotide at a time on a solid surface in repeated steps to build up probes of specific sequences in designated locations. 28
  • 28.
     GeneChipâ„ ¢ ::CSHL DNA Learning Center 29
  • 29.
     Affymetrix GeneChiparrays being the most common.  These are made using photolithography, use light to create a pattern.  The method relies on UV masking and light-directed combinatorial chemical synthesis on a solid support to selectively synthesize probes directly on the surface of the array,  one nucleotide at a time per spot, for many spots simultaneously . 30
  • 30.
     Fast andaffordable: They can check thousands of genes all at once, like a high-speed gene scanner!  Proven track record: They've been around for years and helped us learn a lot about diseases.  Cost-effective: They're cheaper than some newer detective tools 31
  • 31.
     Blind spots: Theycan only see genes that they already know about, so they might miss new clues.  Slow updates: If we find a new gene to investigate, it takes time to update the microarray "wanted list."  Tricksy results: Sometimes they get confused and give us wrong answers, like a detective with bad eyesight.  Alternatives:  RNA-Seq: Offers superior flexibility for uncovering unknown genes and mutations, but at a higher cost. 32
  • 32.
  • 33.
    ANALYSIS OF MICROARRAY DATA Feature extraction is the process of converting the scanned image of the microarray into quantifiable (computable) values and annotating it with the gene IDs, sample names and other useful information  Quality control  Normalisation  Differential expression analysis  Biological interpretation of the results: Many of the methods for visualising and interpreting microarray data  Submission of data to a public database 34
  • 34.
     Array intensitydistributions (Boxplots) : Shows overall gene activity levels  PCA plot (Principal Component Analysis) : Reveals patterns in gene behavior  Density estimates: Takes a closer look at gene activity groups, showing how common each level is. 35
  • 35.
     The goalof differential expression analysis is to identify genes whose expression differs under different conditions.  An important consideration for differential expression analysis is correction for multiple testing ( statistical phenomenon )  . This leads to an increased chance of false positive results  creates a log2 fold change ratio between the test and control condition and an ‘adjusted’ p-value that rates the significance of the difference
  • 36.
  • 37.
    WHY DIFFERENTI AL EXPRESSION ? Fluorescent intensities donot directly correspond to mRNA concentrations, due to:  different shapes and densities of spots  different hybridization properties between genes  different amounts of dye incorporation between genes from two samples. 38
  • 38.
     Genotyping ArrayDevelopment: A custom Axiom genotyping array is being developed for pan-Arab populations using whole genome sequencing data from 19 Arab countries.  Array Features:  Approximately 800,000 variants  Targets conditions including diabetes, cardiovascular diseases, autism, inherited disorders, and cancer.  Objective: Facilitate scientific research and insights, providing a cost-effective alternative to whole genome sequencing.  The collaboration includes custom genotyping arrays designed to accelerate genomic research and clinical applications of predictive genomics across Arab populations 39
  • 39.
    QATAR GENOME PROGRAM  TheQatar Genome Programme (QGP) is a national population-based research project which studies the genetic makeup of Qatari and other Arab populations with a view to introducing personalised and precision medicine into the national health care system. The QCP has already sequenced the genomes of 25,000 Qataris. Now in phase 3, this project aims to sequence 100,000 genomes by 2025.  As of July 2023, Qatar had 514,524 confirmed COVID-19 cases and 690 confirmed COVID-19 deaths. Qatar was the only Arab country to participate in the COVID-19 Host Initiative, an international collaboration to map the human genetic architecture of COVID-19 in 2020, and it was one of the few non-European or North American contributors. 40
  • 40.
    THERMO FISHER SCIENTIFIC ANDQATAR GENOME PROGRAM: ADVANCE GENOMIC RESEARCH FOR ARAB POPULATIONS  Previous Collaboration:  Establishment: Collaboration began in 2018, resulting in the development of the Q-Chip microarray designed for the Qatari population.  Continued Refinement: Ongoing refinement of algorithms and clinically actionable content, including polygenic risk scores and pharmacogenomics. 41
  • 41.
    DISEASE GENOMICS DATABASE  Qatar Genomeis currently working on establishing the Disease Genomics Database (DGD) to allow data sharing and empowerment of genomic research and discovery related to diseases of national priority in Qatar and the region.  If you are interested in participating in this database, you can contact this email hrashid@qf.org.qa  Click here to Download DGD Affiliation Request Form 42
  • 42.
  • 43.
  • 44.
  • 45.
     This theoryproposes that some of our genes (particularly those involved in energy production) originated from ancient viruses that invaded our ancestors billions of years ago. These viruses, instead of destroying the cell, entered a symbiotic relationship, providing crucial functions. Over time, their DNA became integrated into our genome, contributing to our evolution and adaptation. This theory still sparks debates, but it's a captivating narrative about the potential "alien" origins of some human genes 46
  • 46.
     While onlyabout 2% of human DNA codes for proteins, the remaining 98% used to be considered "junk DNA." Recent research suggests this so-called "dark matter" plays a crucial role in regulating gene expression, cell development, and even behavior. Some theories propose that these non-coding regions interact with environmental factors and contribute to individual differences and even evolution in ways we're only beginning to understand. 47

Editor's Notes

  • #18 Before microarrays: Imagine you're looking for a specific book in a huge library. You have a clue that it's somewhere in the "health" section, but there are thousands of books there!
  • #20 the movement of charged particles in a fluid or gel under the influence of an electric field. The term phoresis is derived from the Greek word meaning “to carry.” 
  • #21 With microarrays: It's like having a magic scanner that can read all the book titles in the "health" section at once. You see all the titles listed on a screen, and you can quickly find the one you need without having to touch a single book!
  • #27 If we are trying to calculate relative expression between two samples, each labeled with a different dye (See figure 2, red for the experiment, green for the control), the resulting image is analyzed by calculating the ratio of the two dyes. If a gene is over-expressed in the experimental sample, then more of that sample cDNA than control cDNA will hybridize to the spot representing that expressed gene. In turn, the spot will fluoresce red with greater intensity than it will fluoresce green. The red-to-green fluorescence ratio thus indicates which gene is up or downregulated in the appropriate sample.