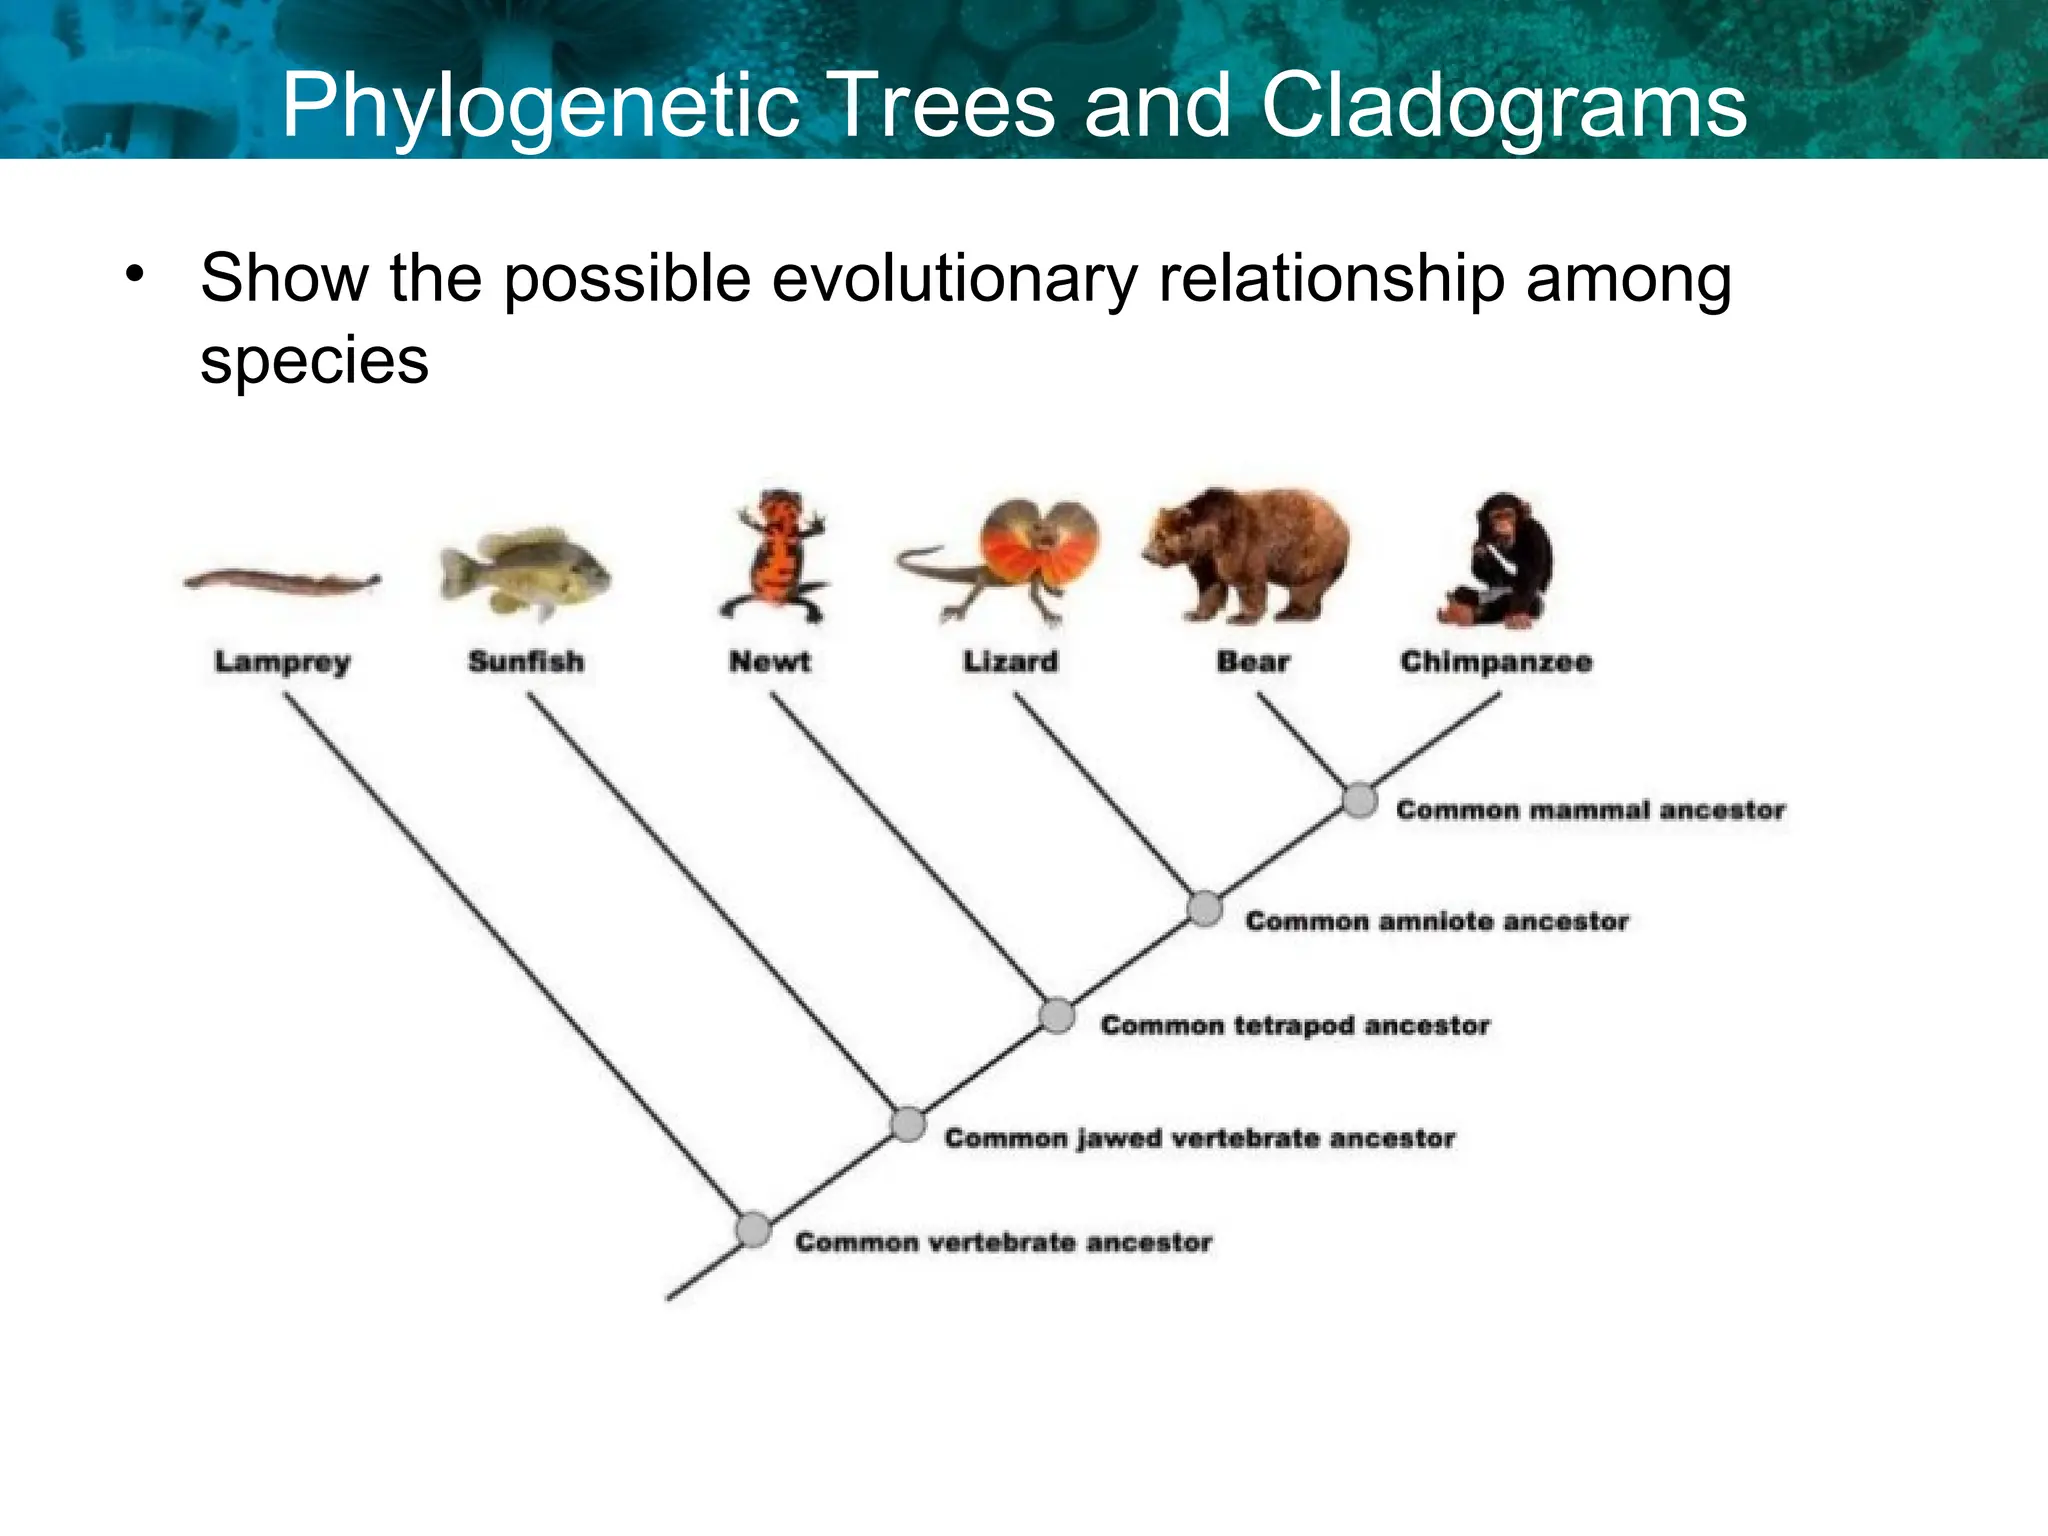
Phylogenetic Trees andCladograms
• Show the possible evolutionary relationship among
species
2.
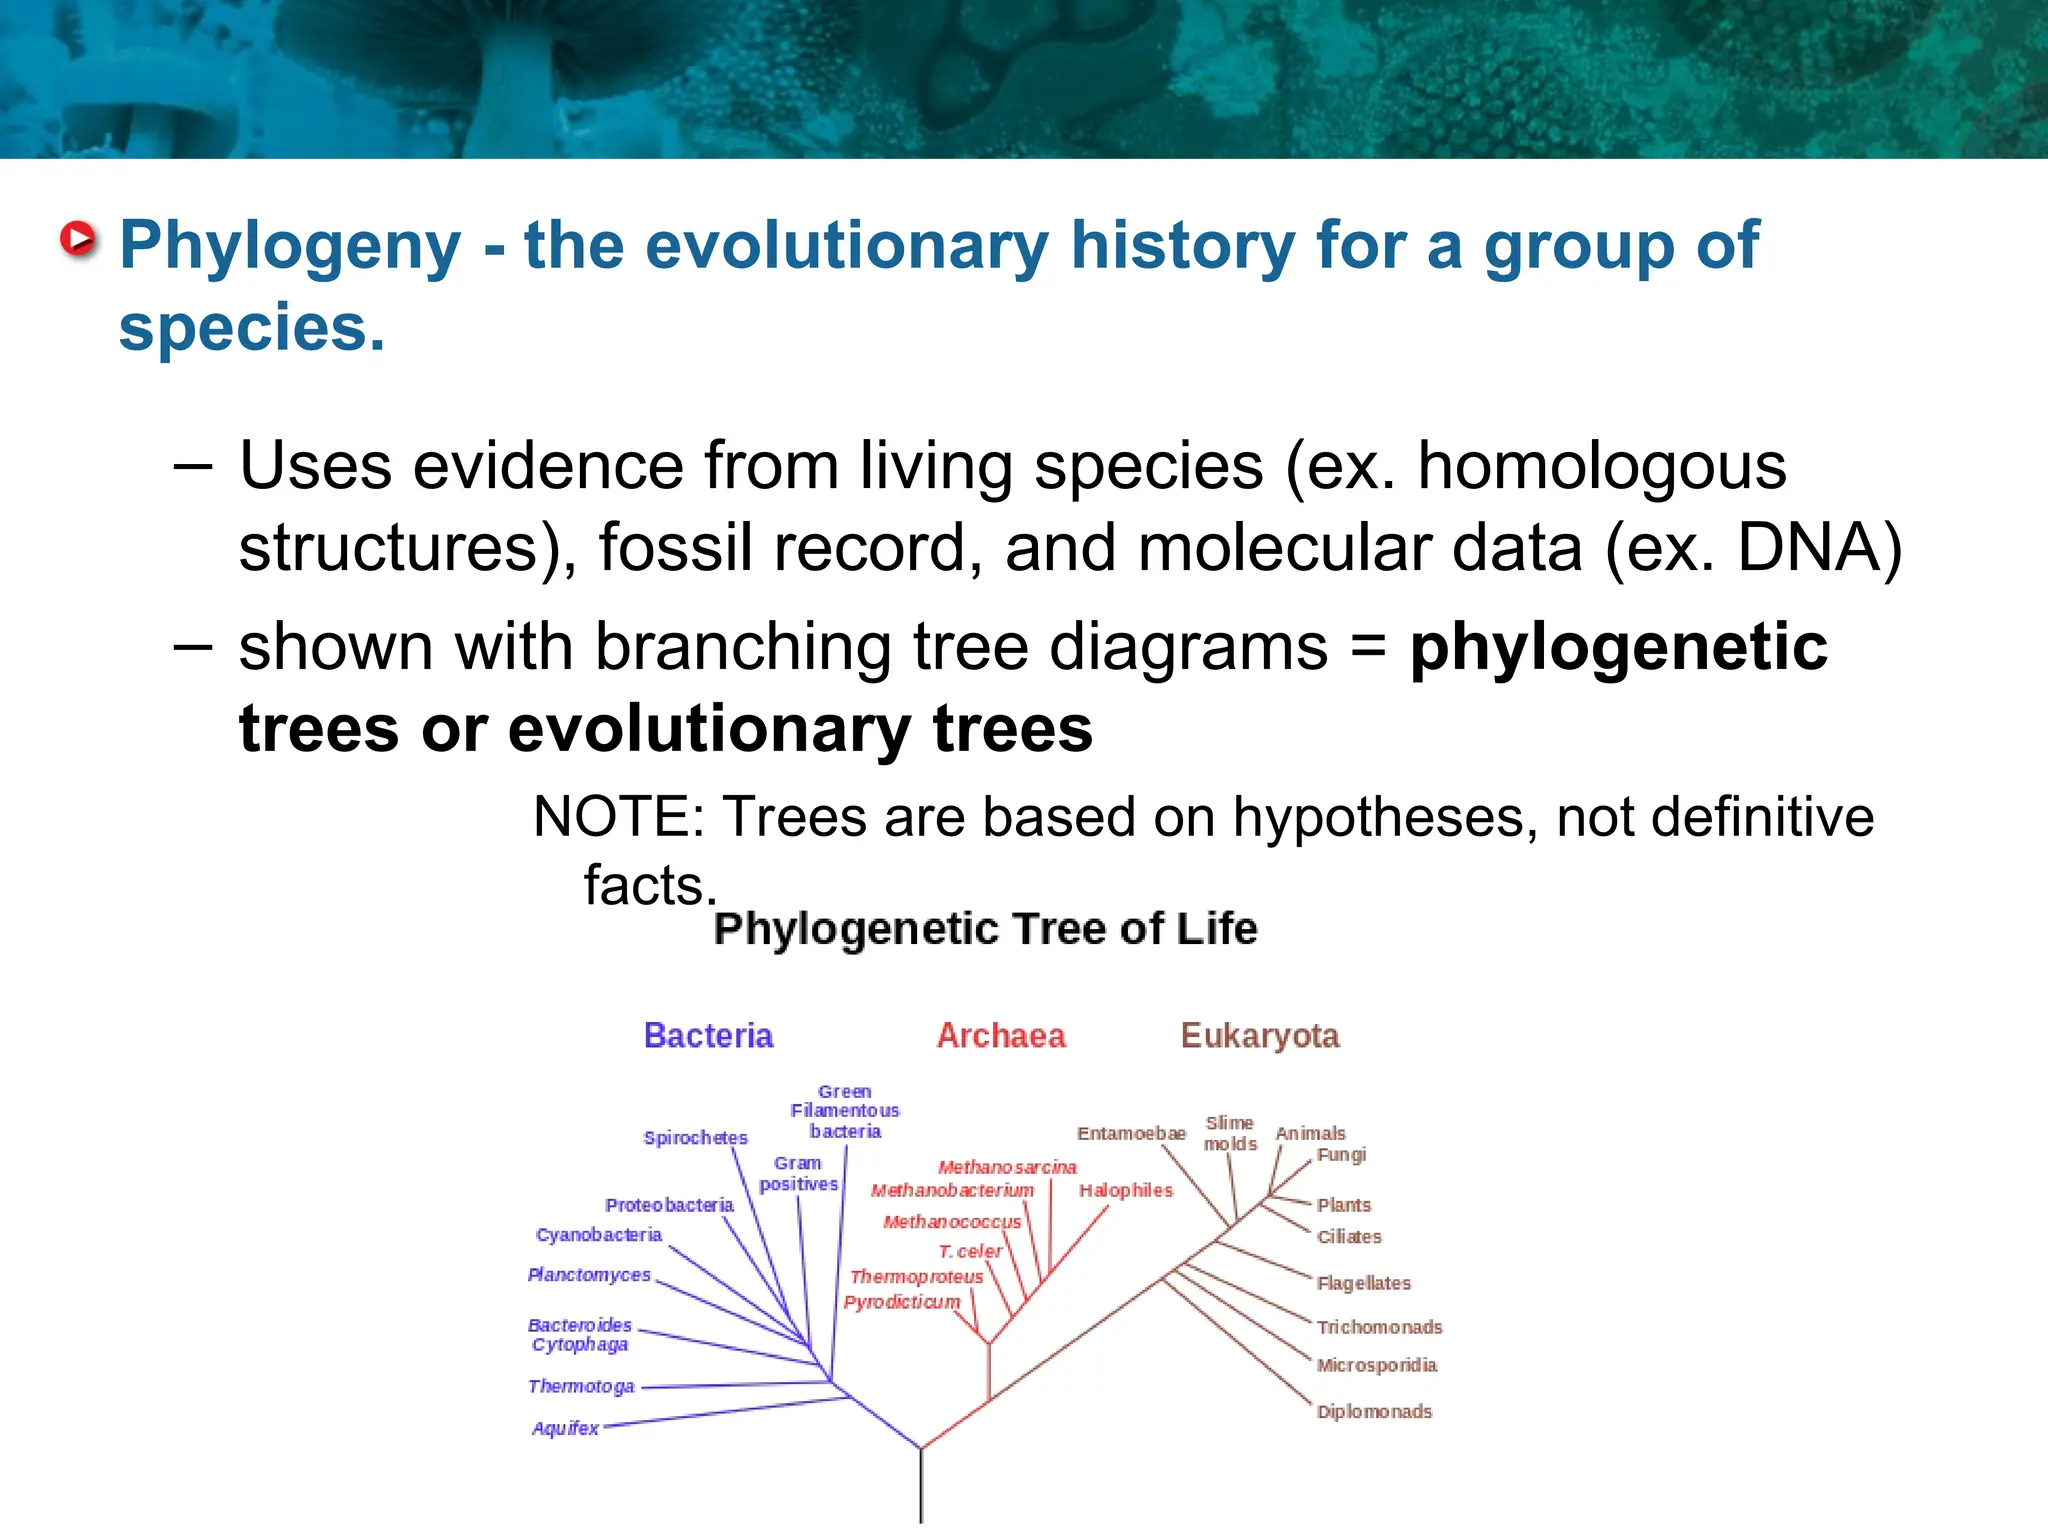
– Uses evidencefrom living species (ex. homologous
structures), fossil record, and molecular data (ex. DNA)
– shown with branching tree diagrams = phylogenetic
trees or evolutionary trees
NOTE: Trees are based on hypotheses, not definitive
facts.
Phylogeny - the evolutionary history for a group of
species.
3.
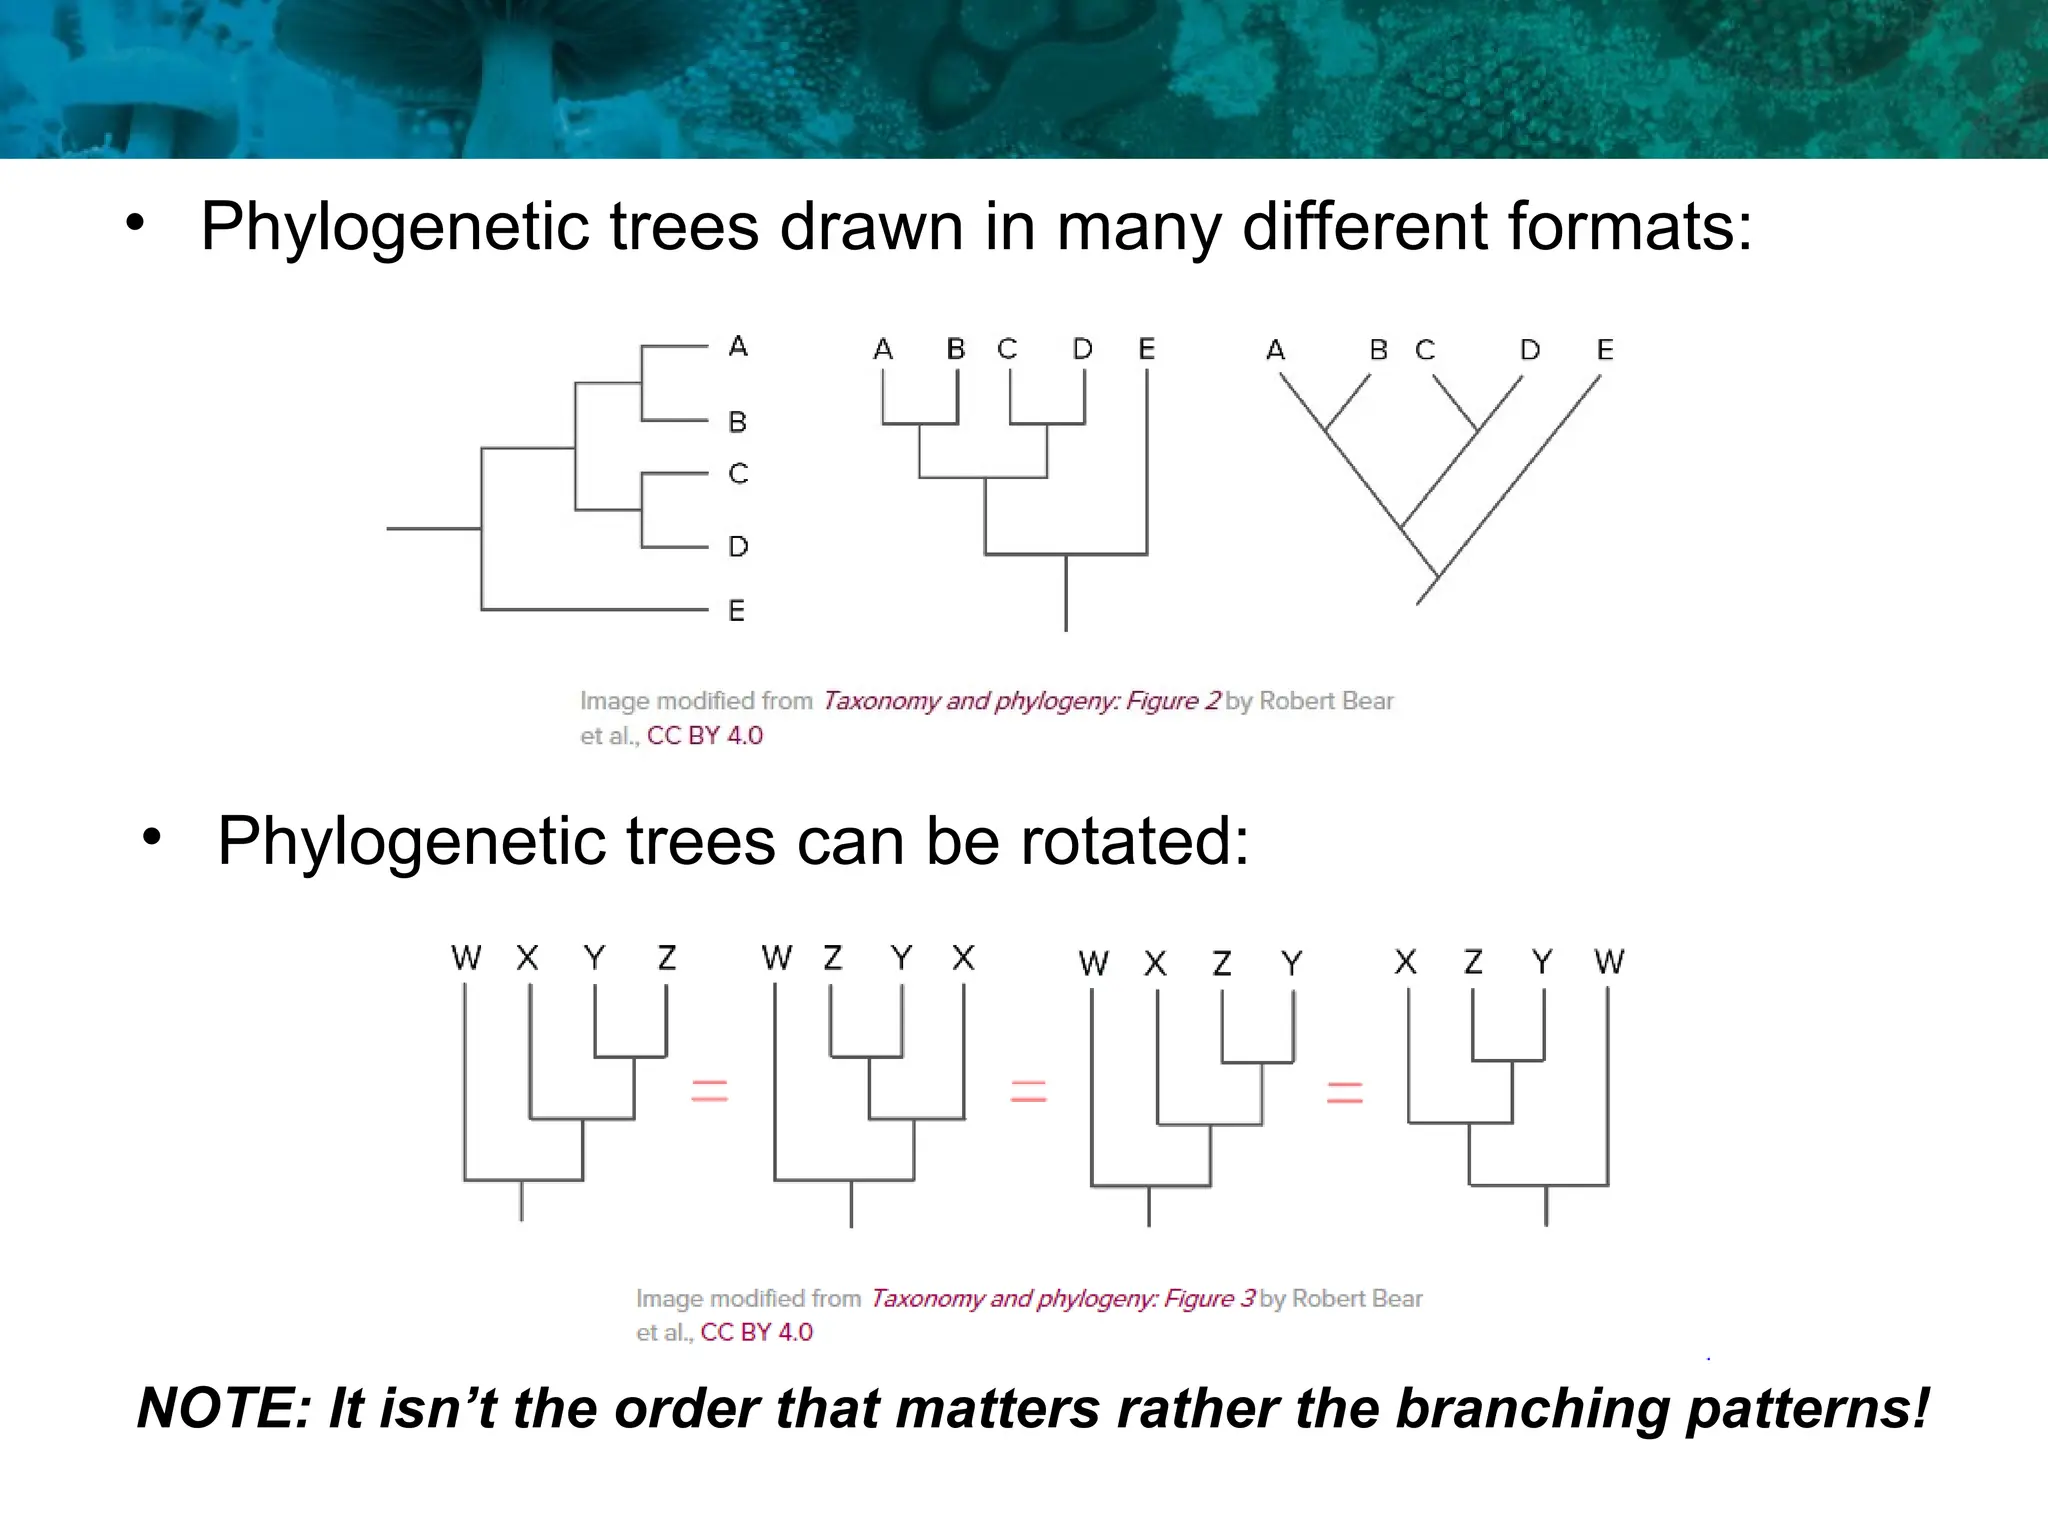
• Phylogenetic treesdrawn in many different formats:
• Phylogenetic trees can be rotated:
NOTE: It isn’t the order that matters rather the branching patterns!
4.
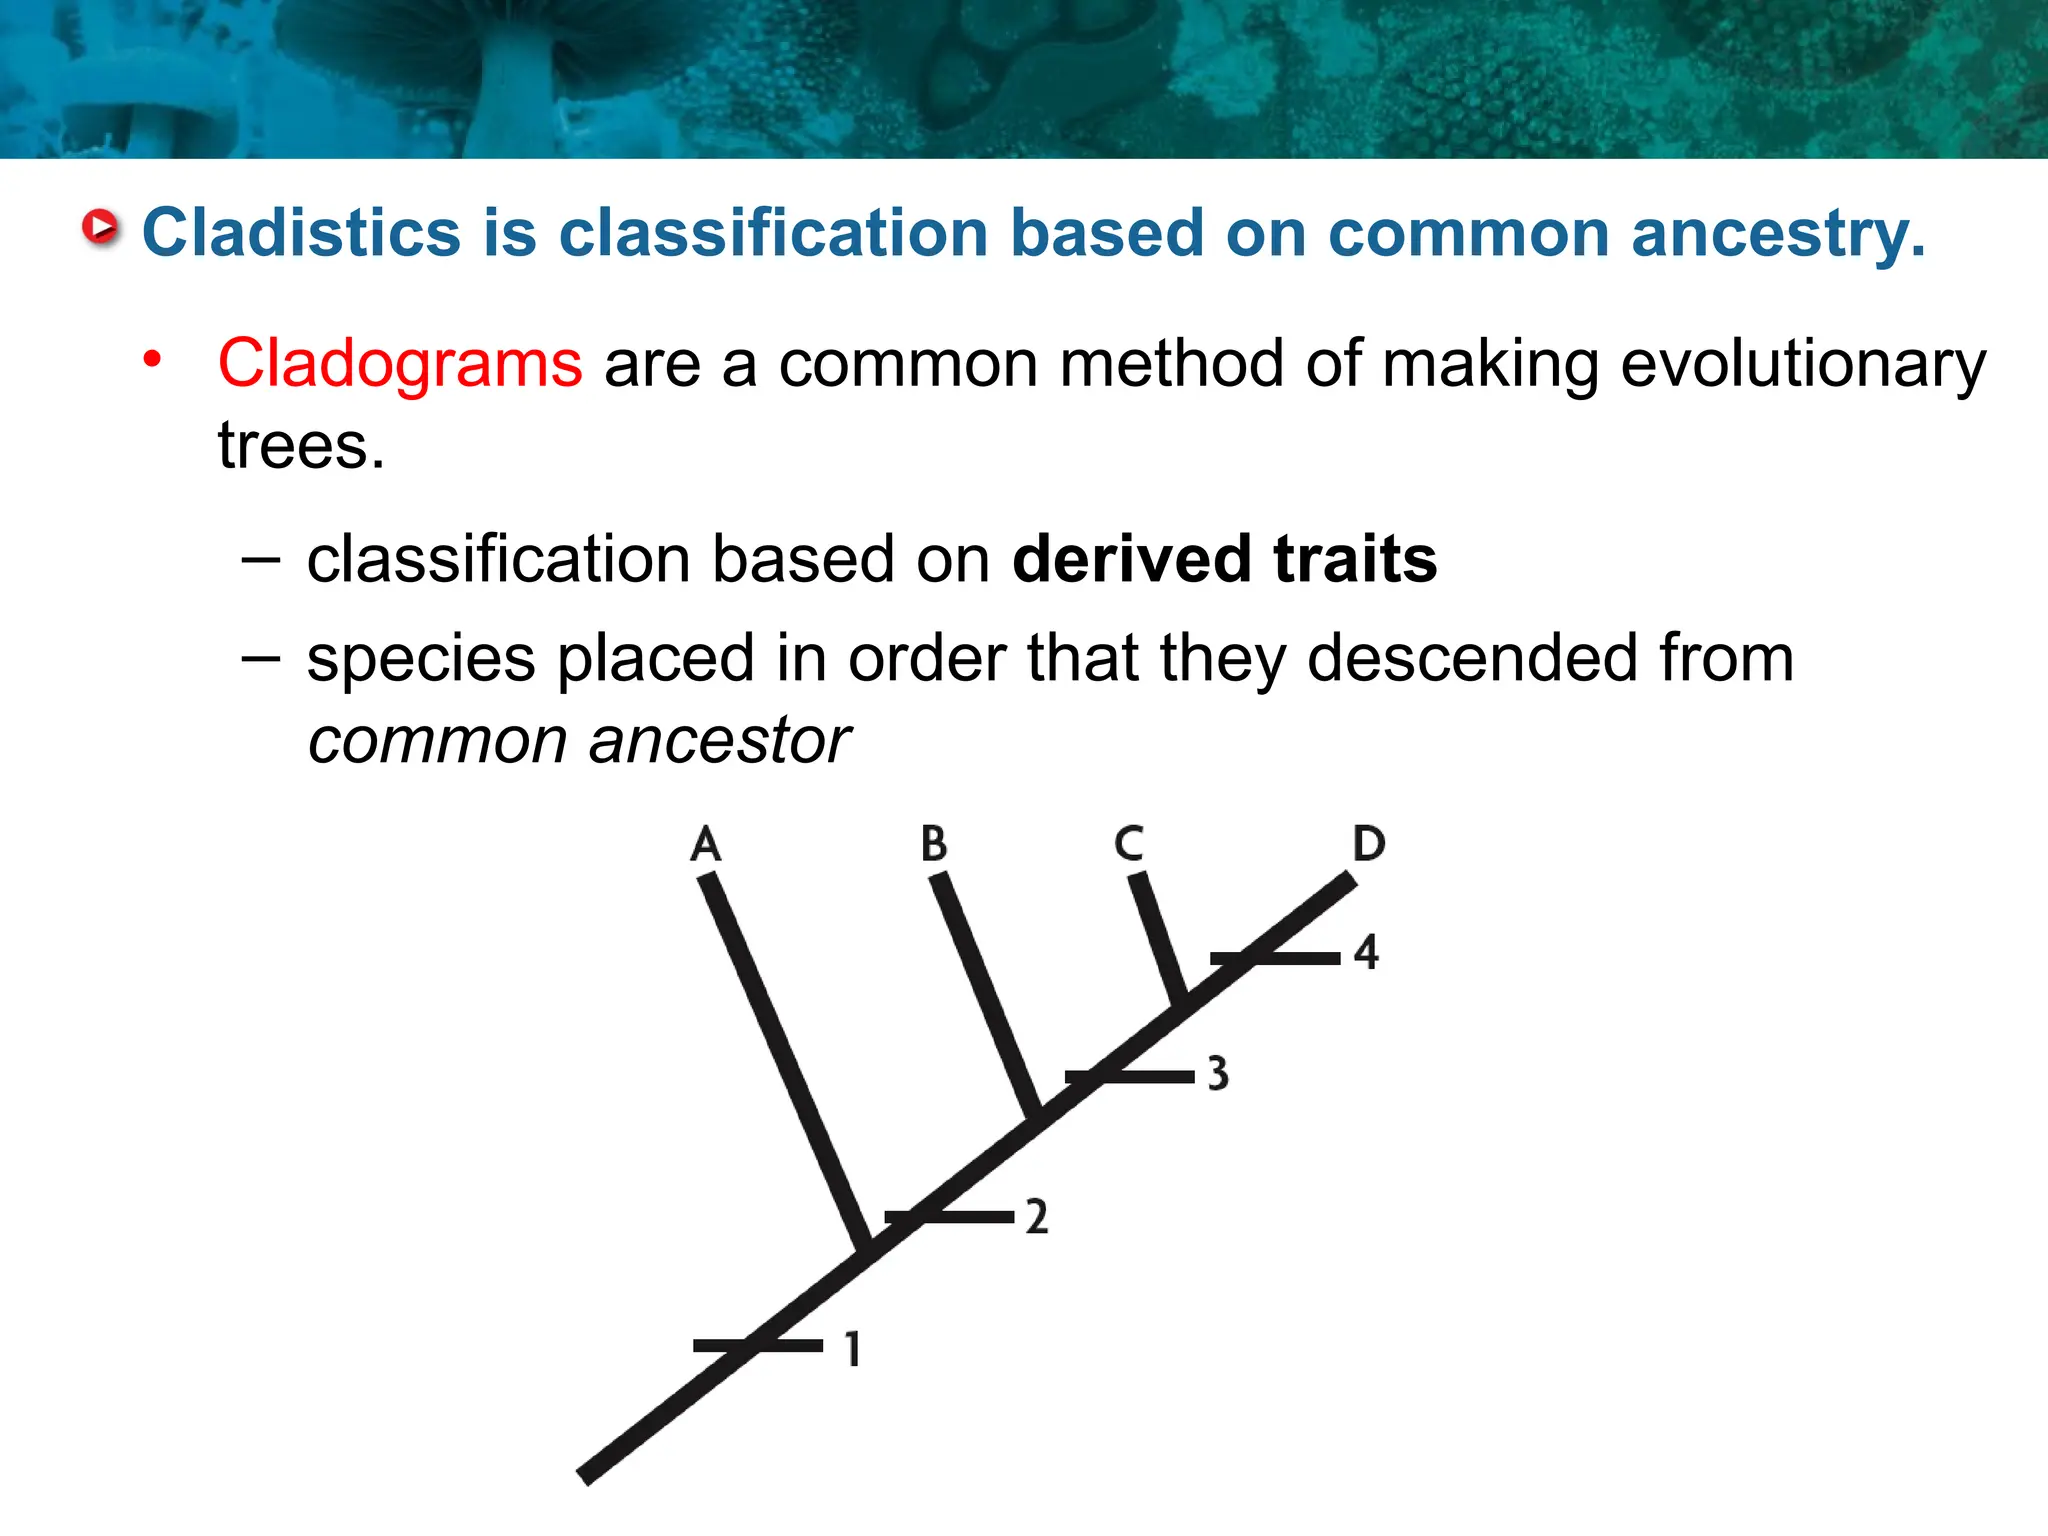
• Cladograms area common method of making evolutionary
trees.
– classification based on derived traits
– species placed in order that they descended from
common ancestor
Cladistics is classification based on common ancestry.
5.
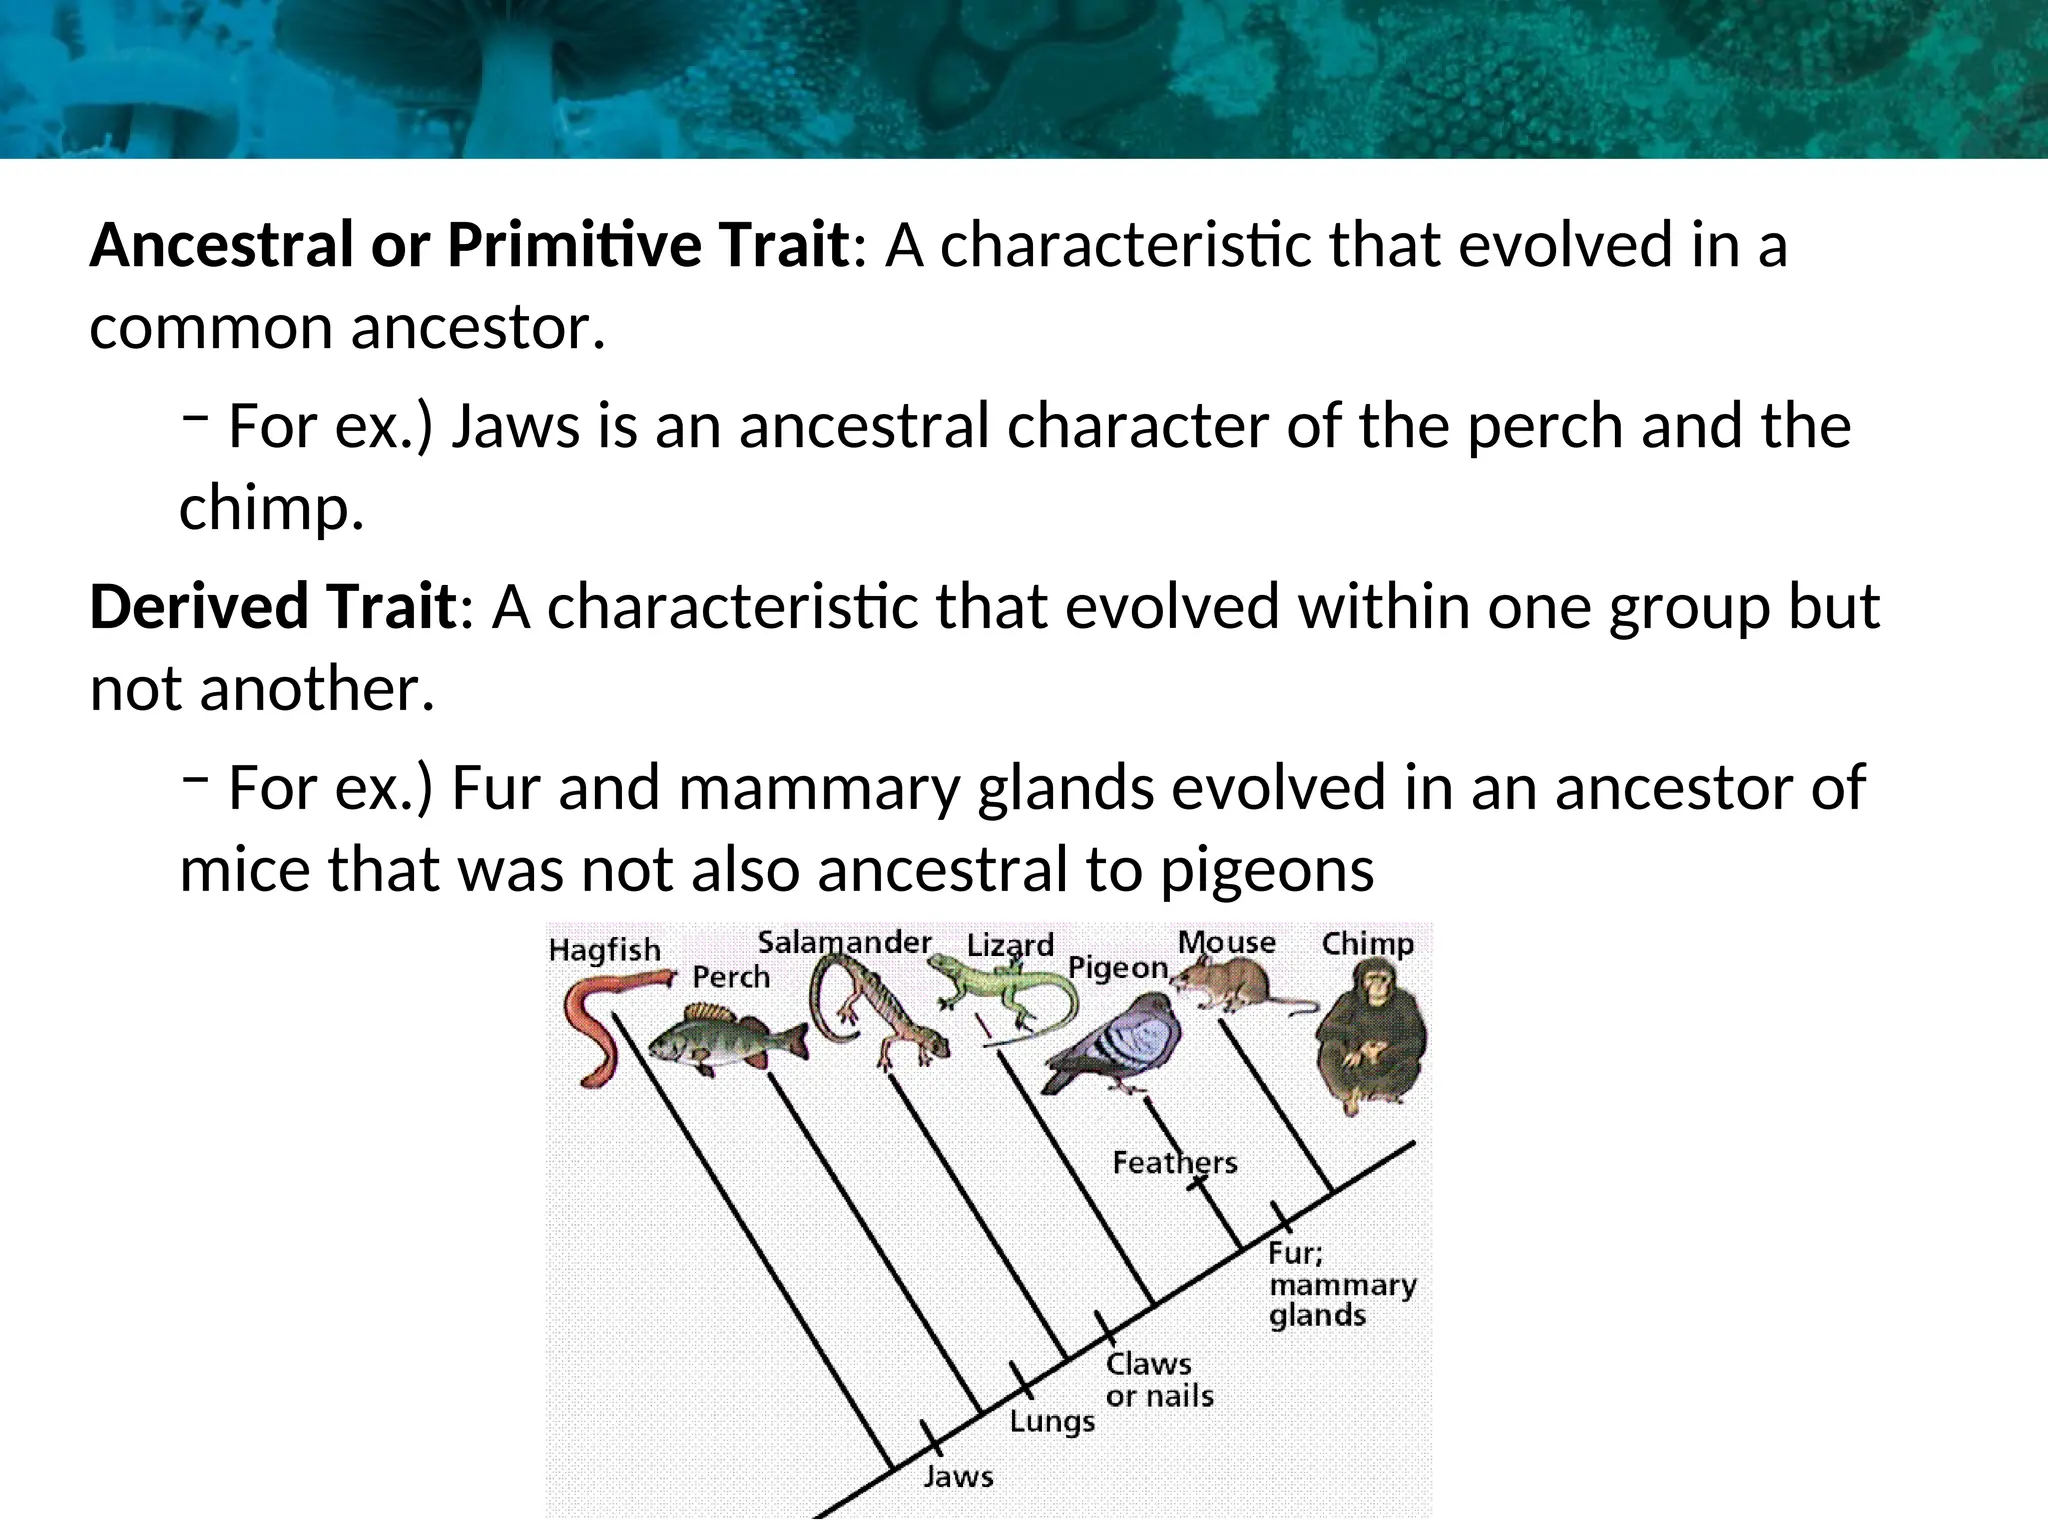
Ancestral or PrimitiveTrait: A characteristic that evolved in a
common ancestor.
– For ex.) Jaws is an ancestral character of the perch and the
chimp.
Derived Trait: A characteristic that evolved within one group but
not another.
– For ex.) Fur and mammary glands evolved in an ancestor of
mice that was not also ancestral to pigeons
5
6.
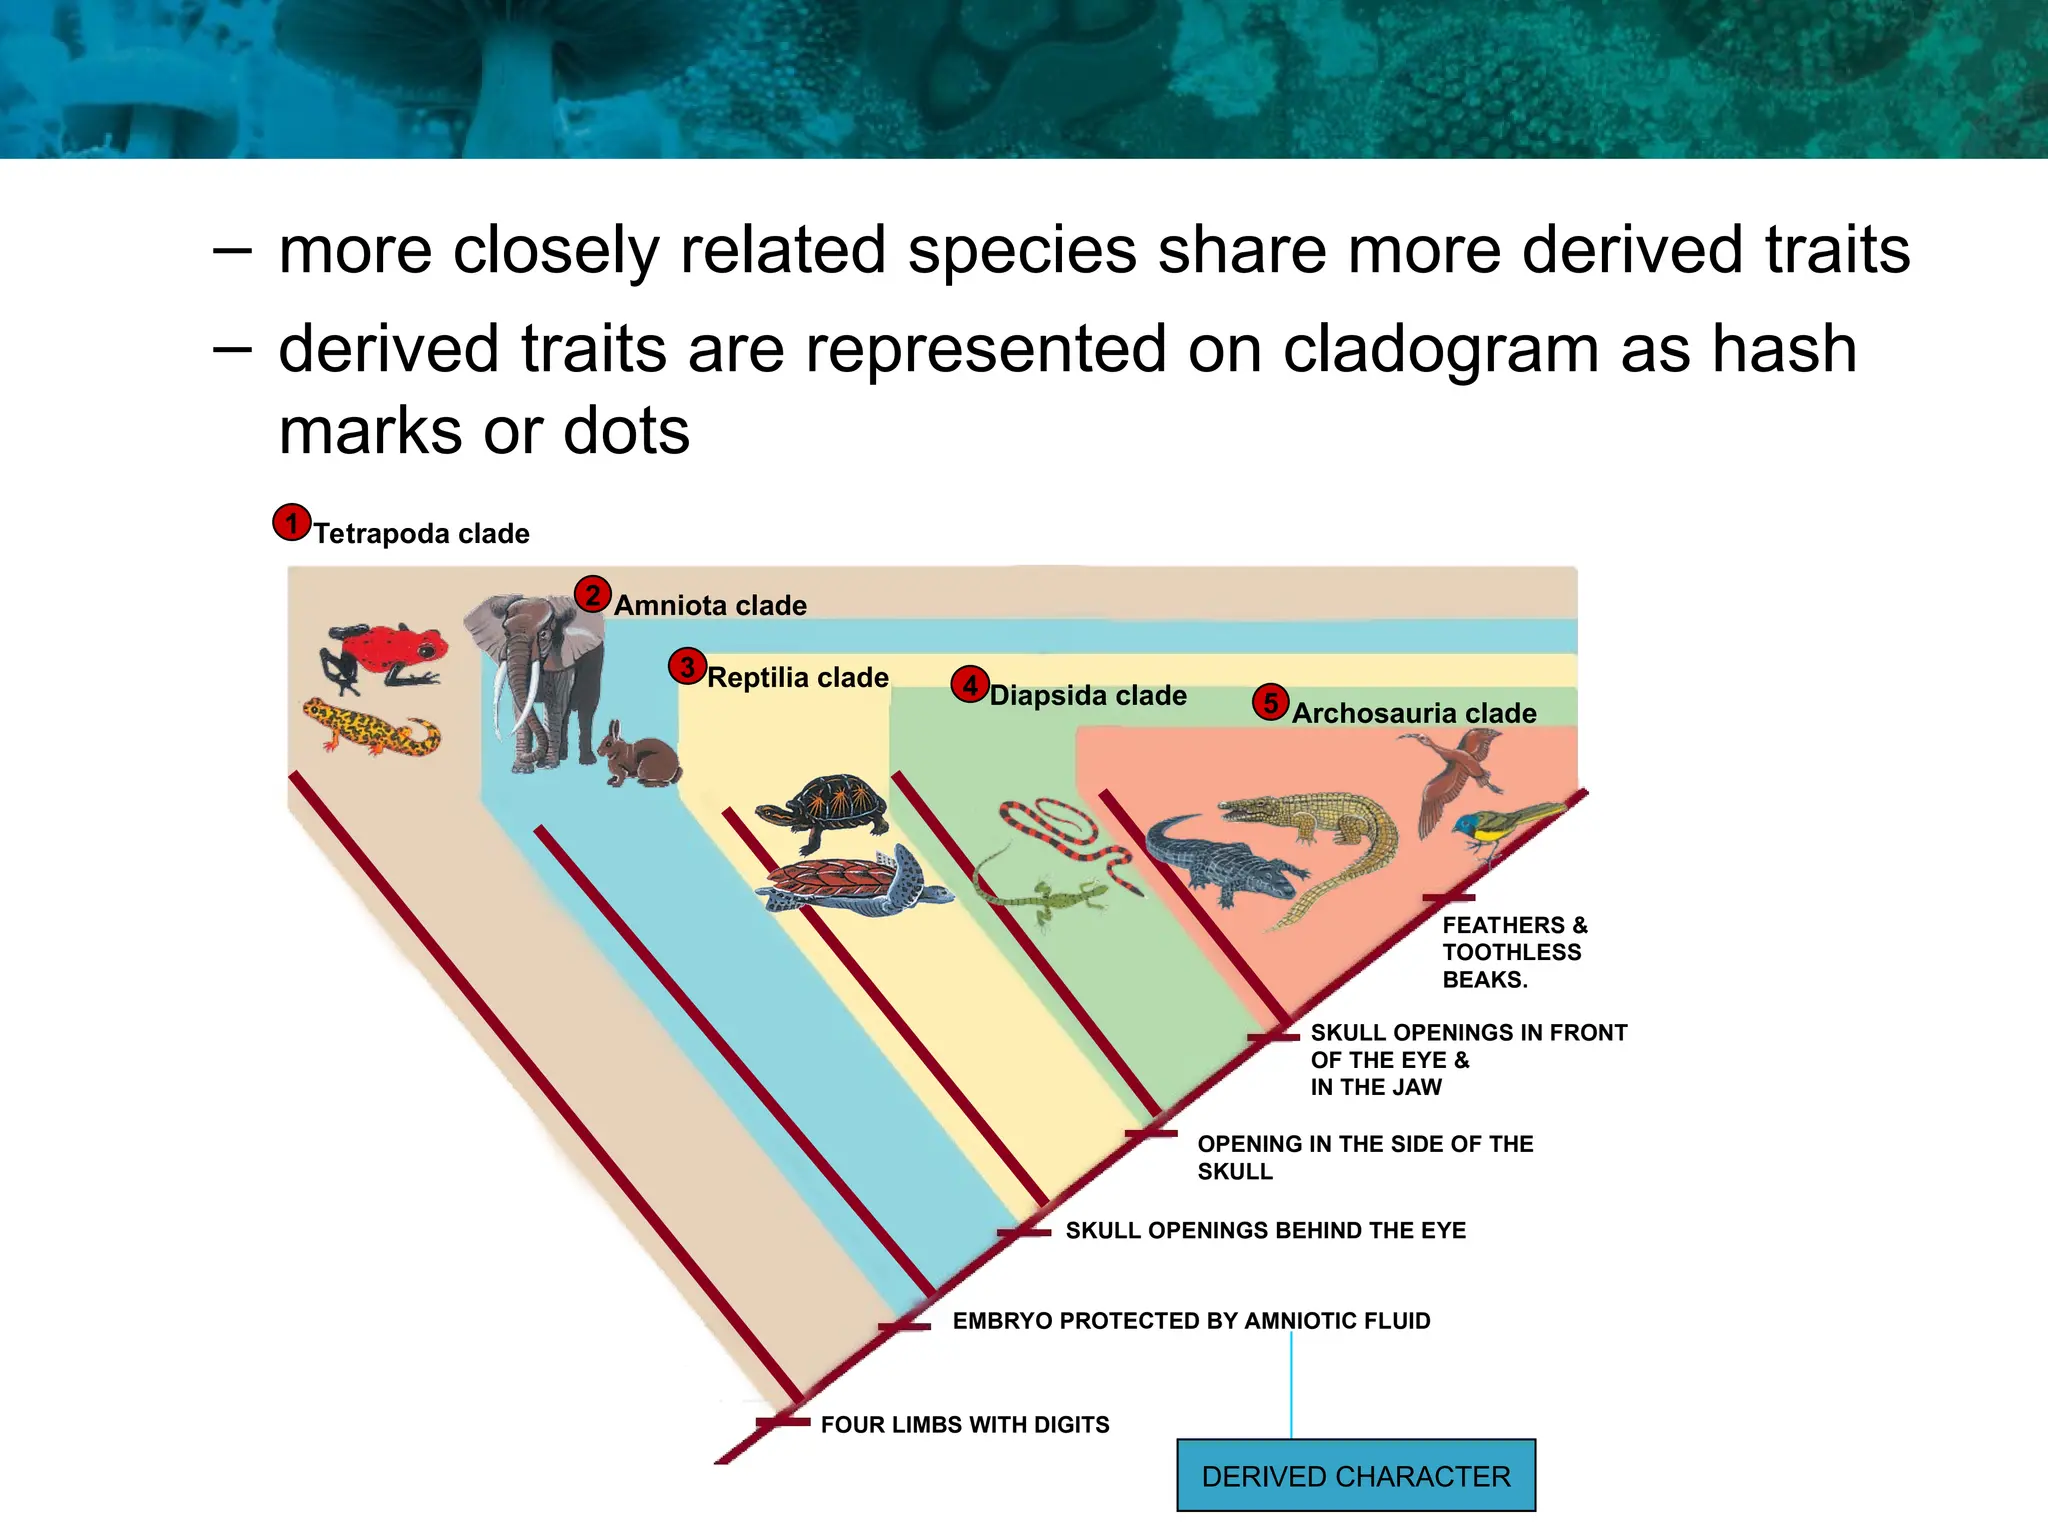
– more closelyrelated species share more derived traits
– derived traits are represented on cladogram as hash
marks or dots
FOUR LIMBS WITH DIGITS
Tetrapoda clade
1
Amniota clade
2
Reptilia clade
3
Diapsida clade
4
Archosauria clade
5
EMBRYO PROTECTED BY AMNIOTIC FLUID
OPENING IN THE SIDE OF THE
SKULL
SKULL OPENINGS IN FRONT
OF THE EYE &
IN THE JAW
FEATHERS &
TOOTHLESS
BEAKS.
SKULL OPENINGS BEHIND THE EYE
DERIVED CHARACTER
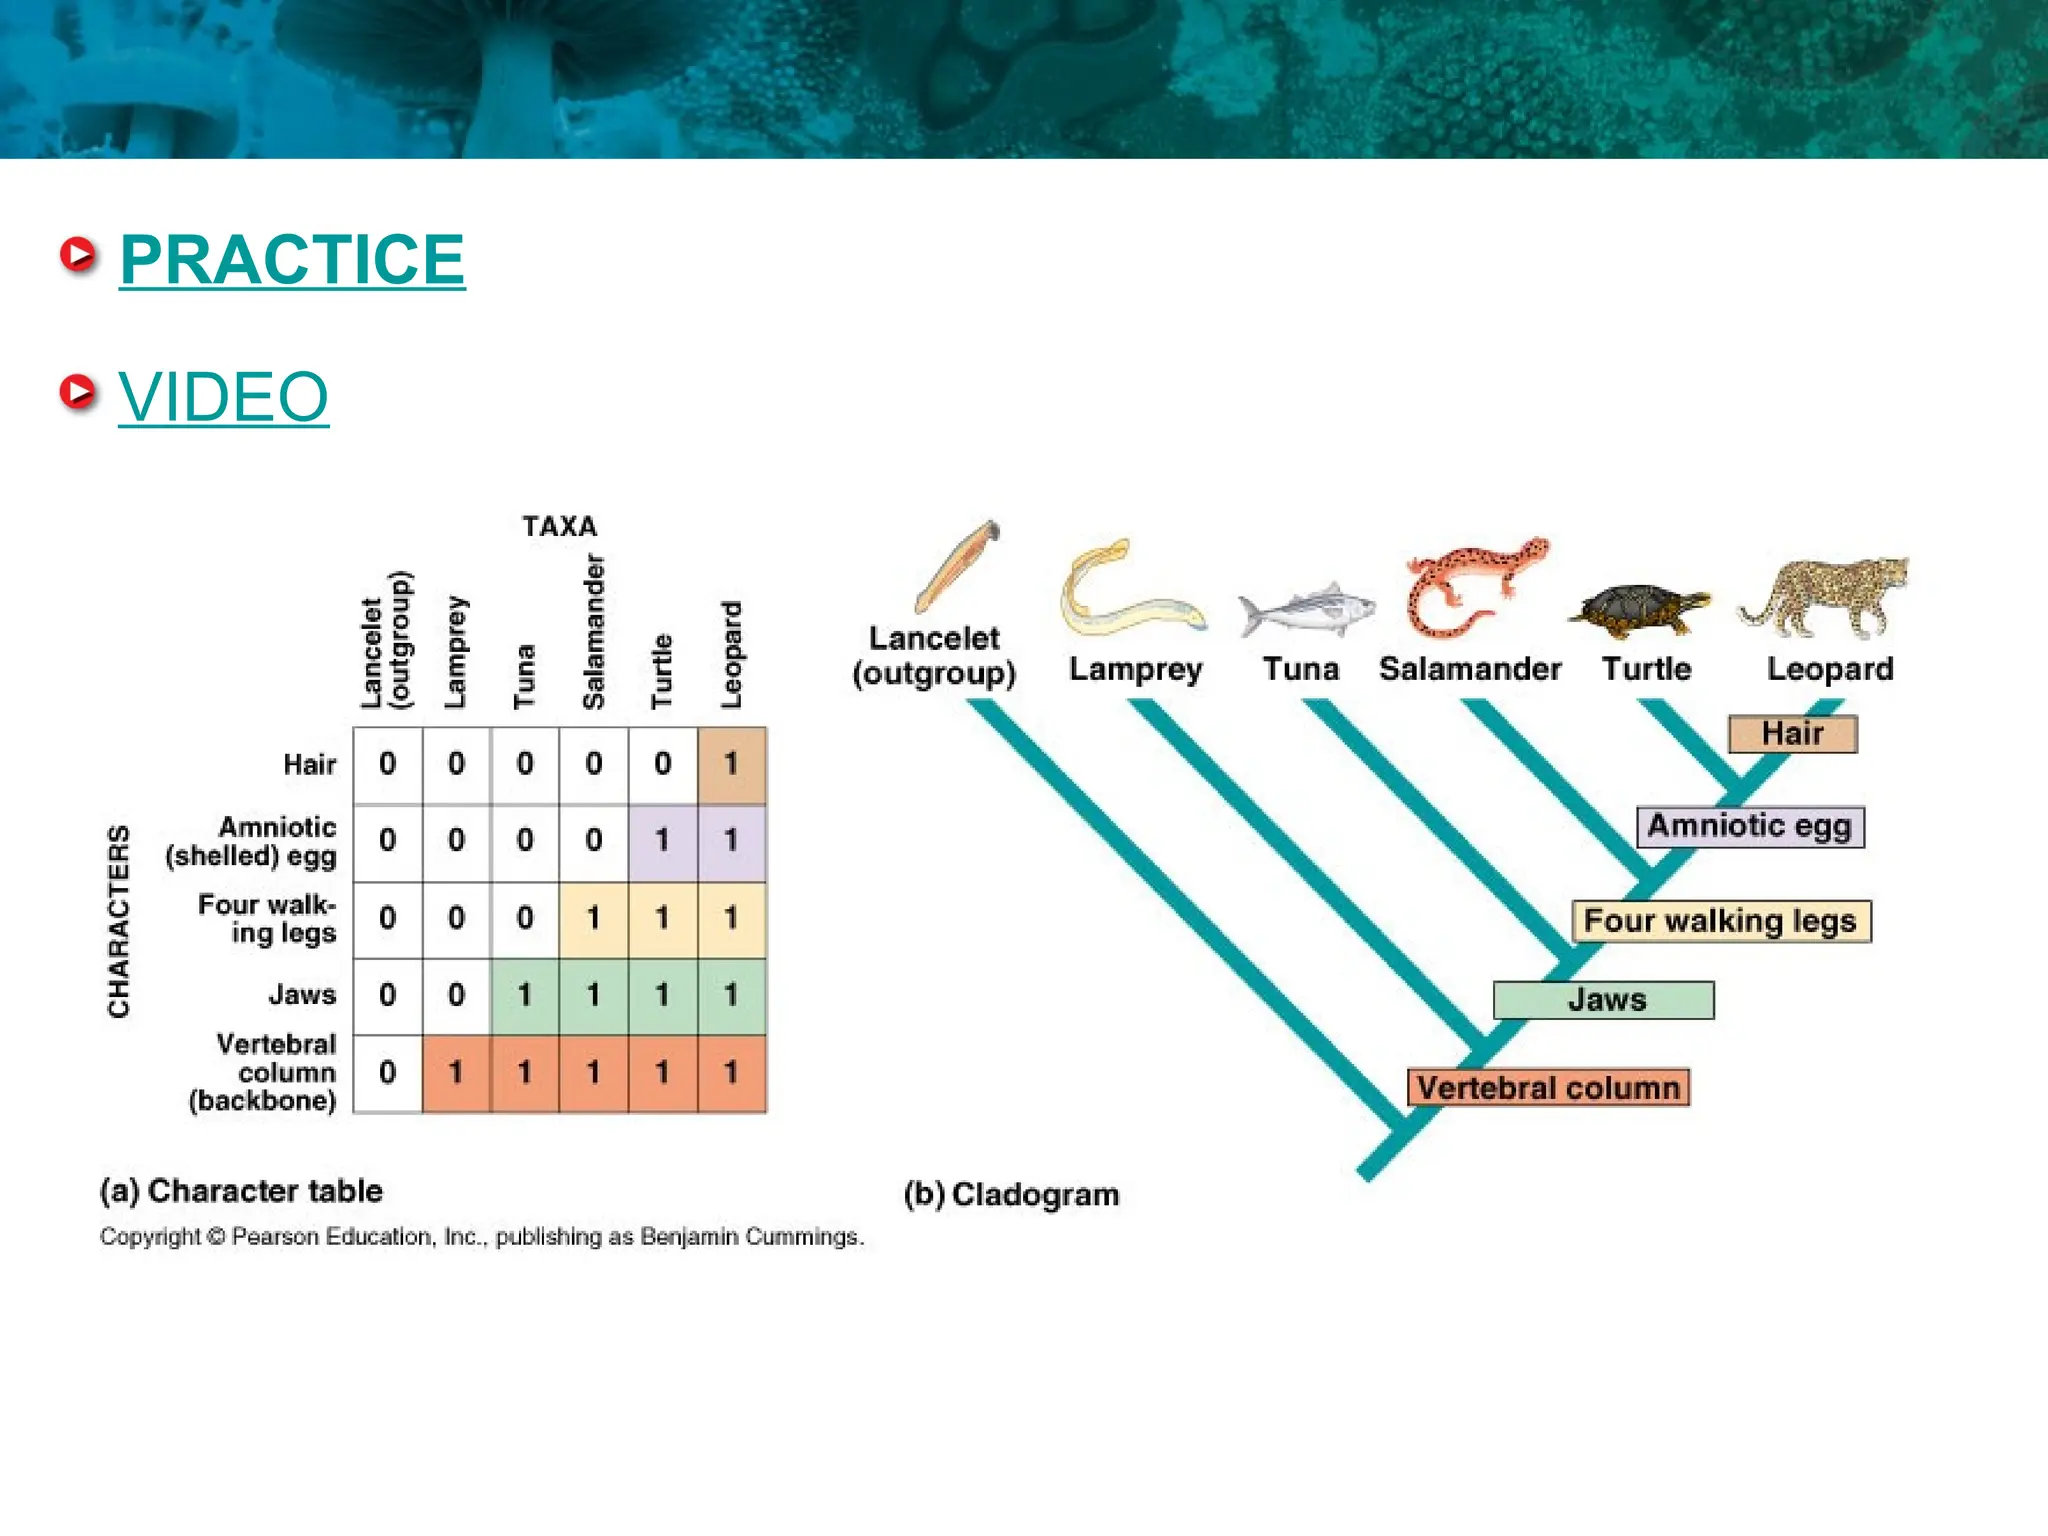
7.
Cladogram
• made upof dichotomous branches, with groups of organisms
or individual species at the ends of each branch.
• Each branching point, or node represents divergence from a
hypothetical common ancestor.
• A clade is a group of species that shares a common ancestor.
8.
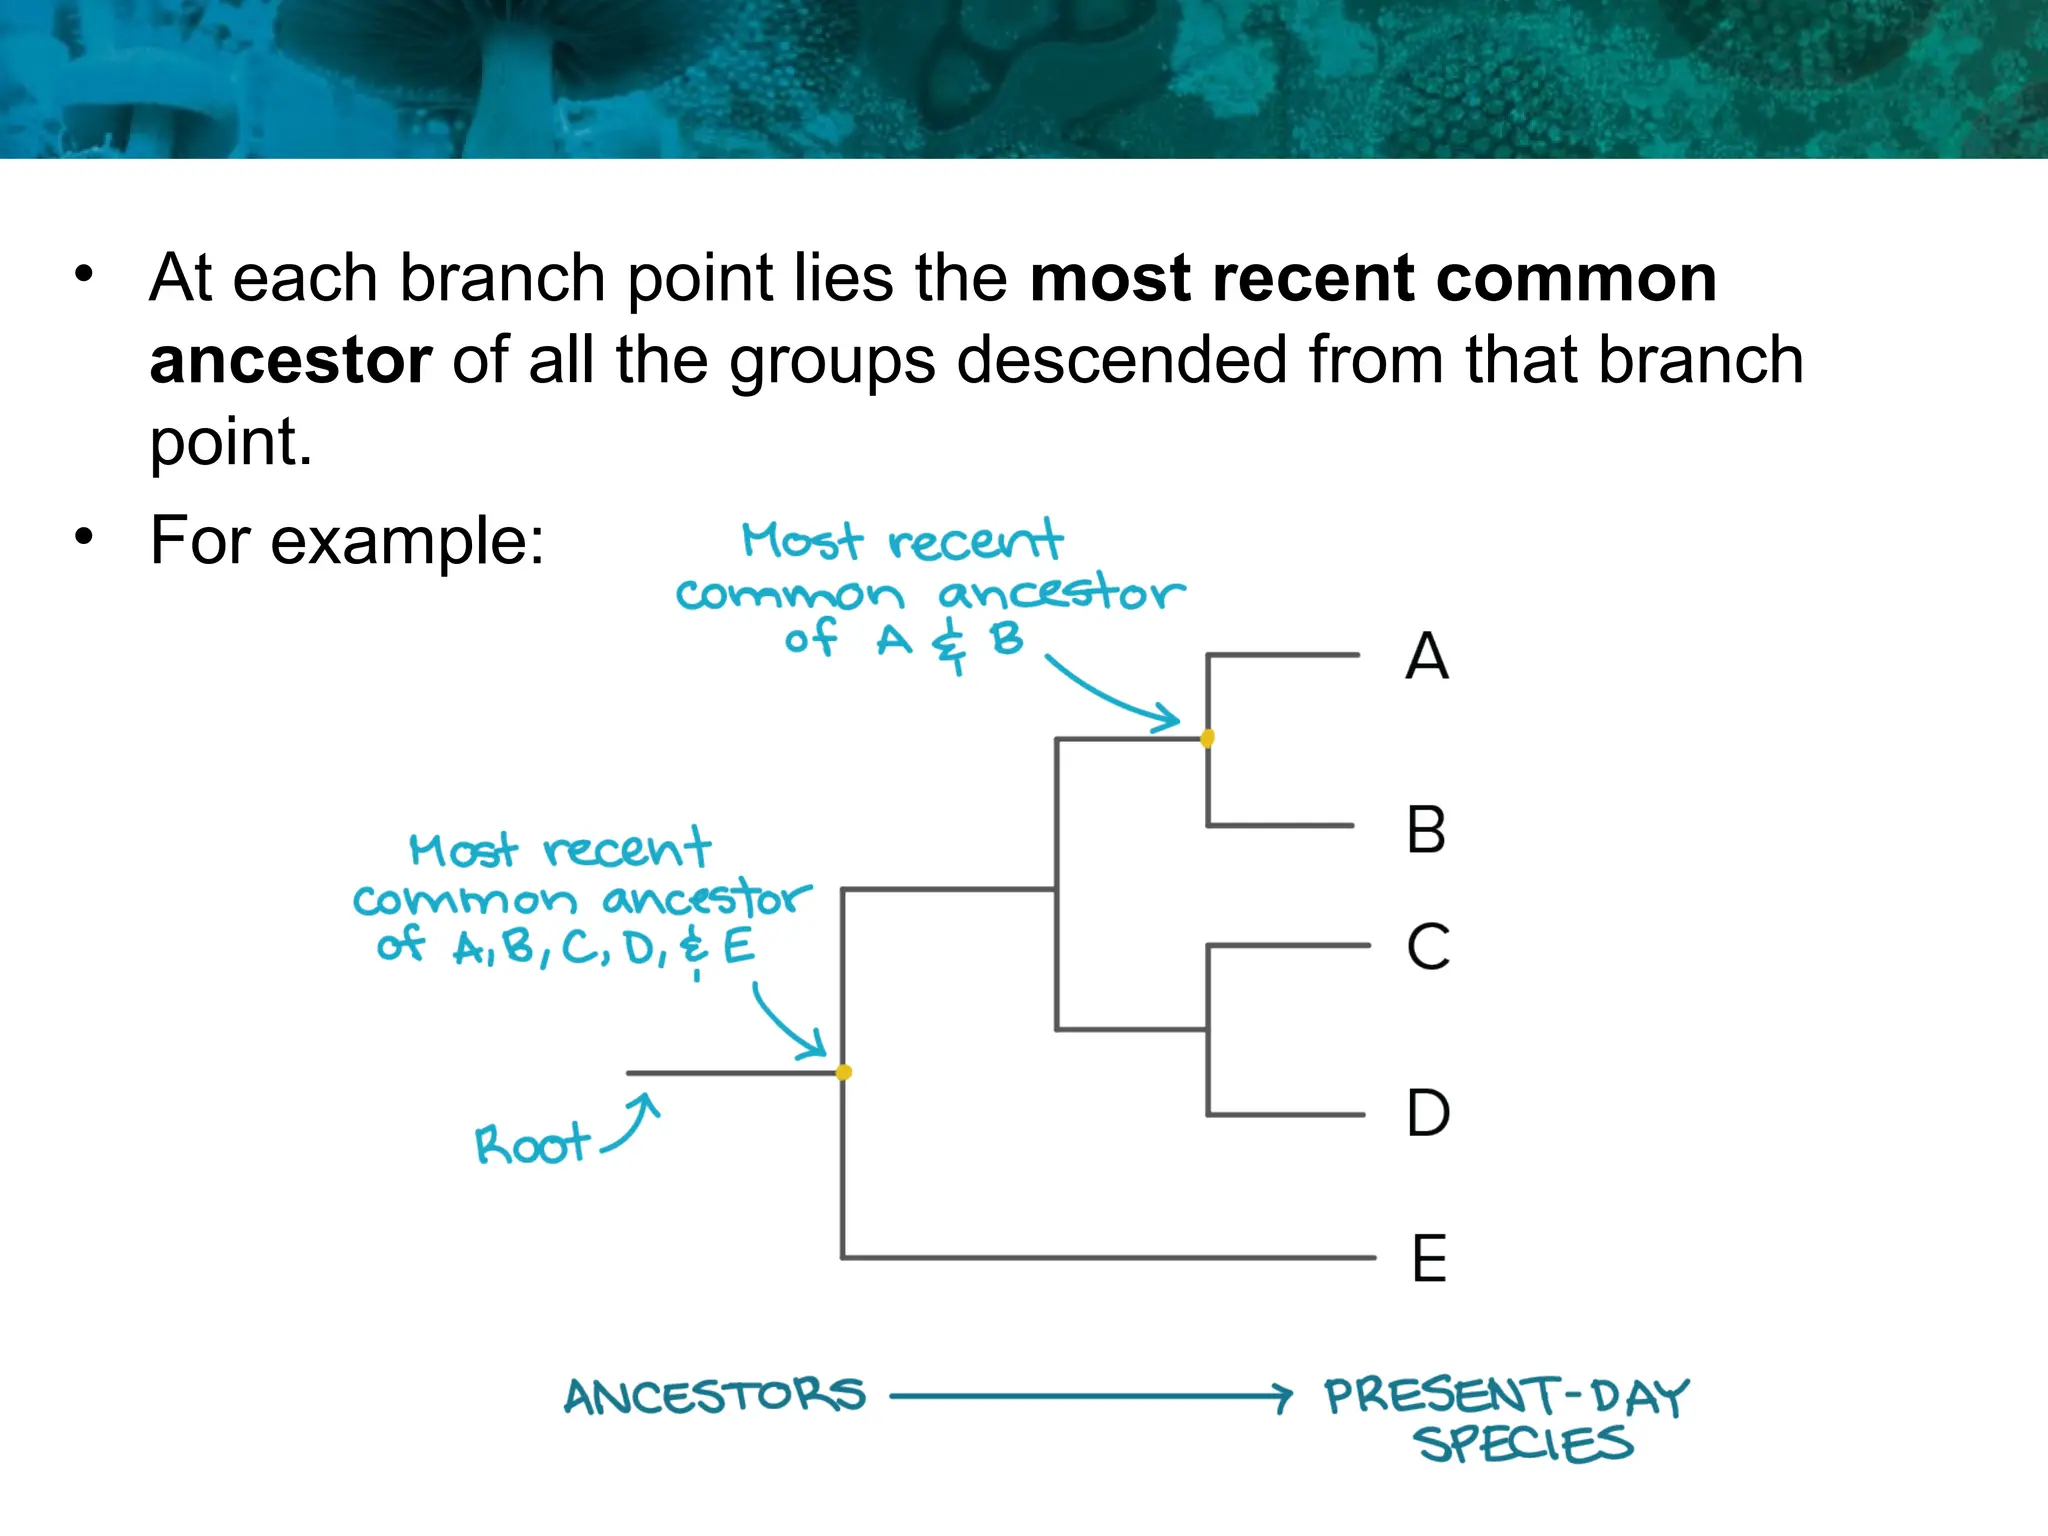
• At eachbranch point lies the most recent common
ancestor of all the groups descended from that branch
point.
• For example:
9.
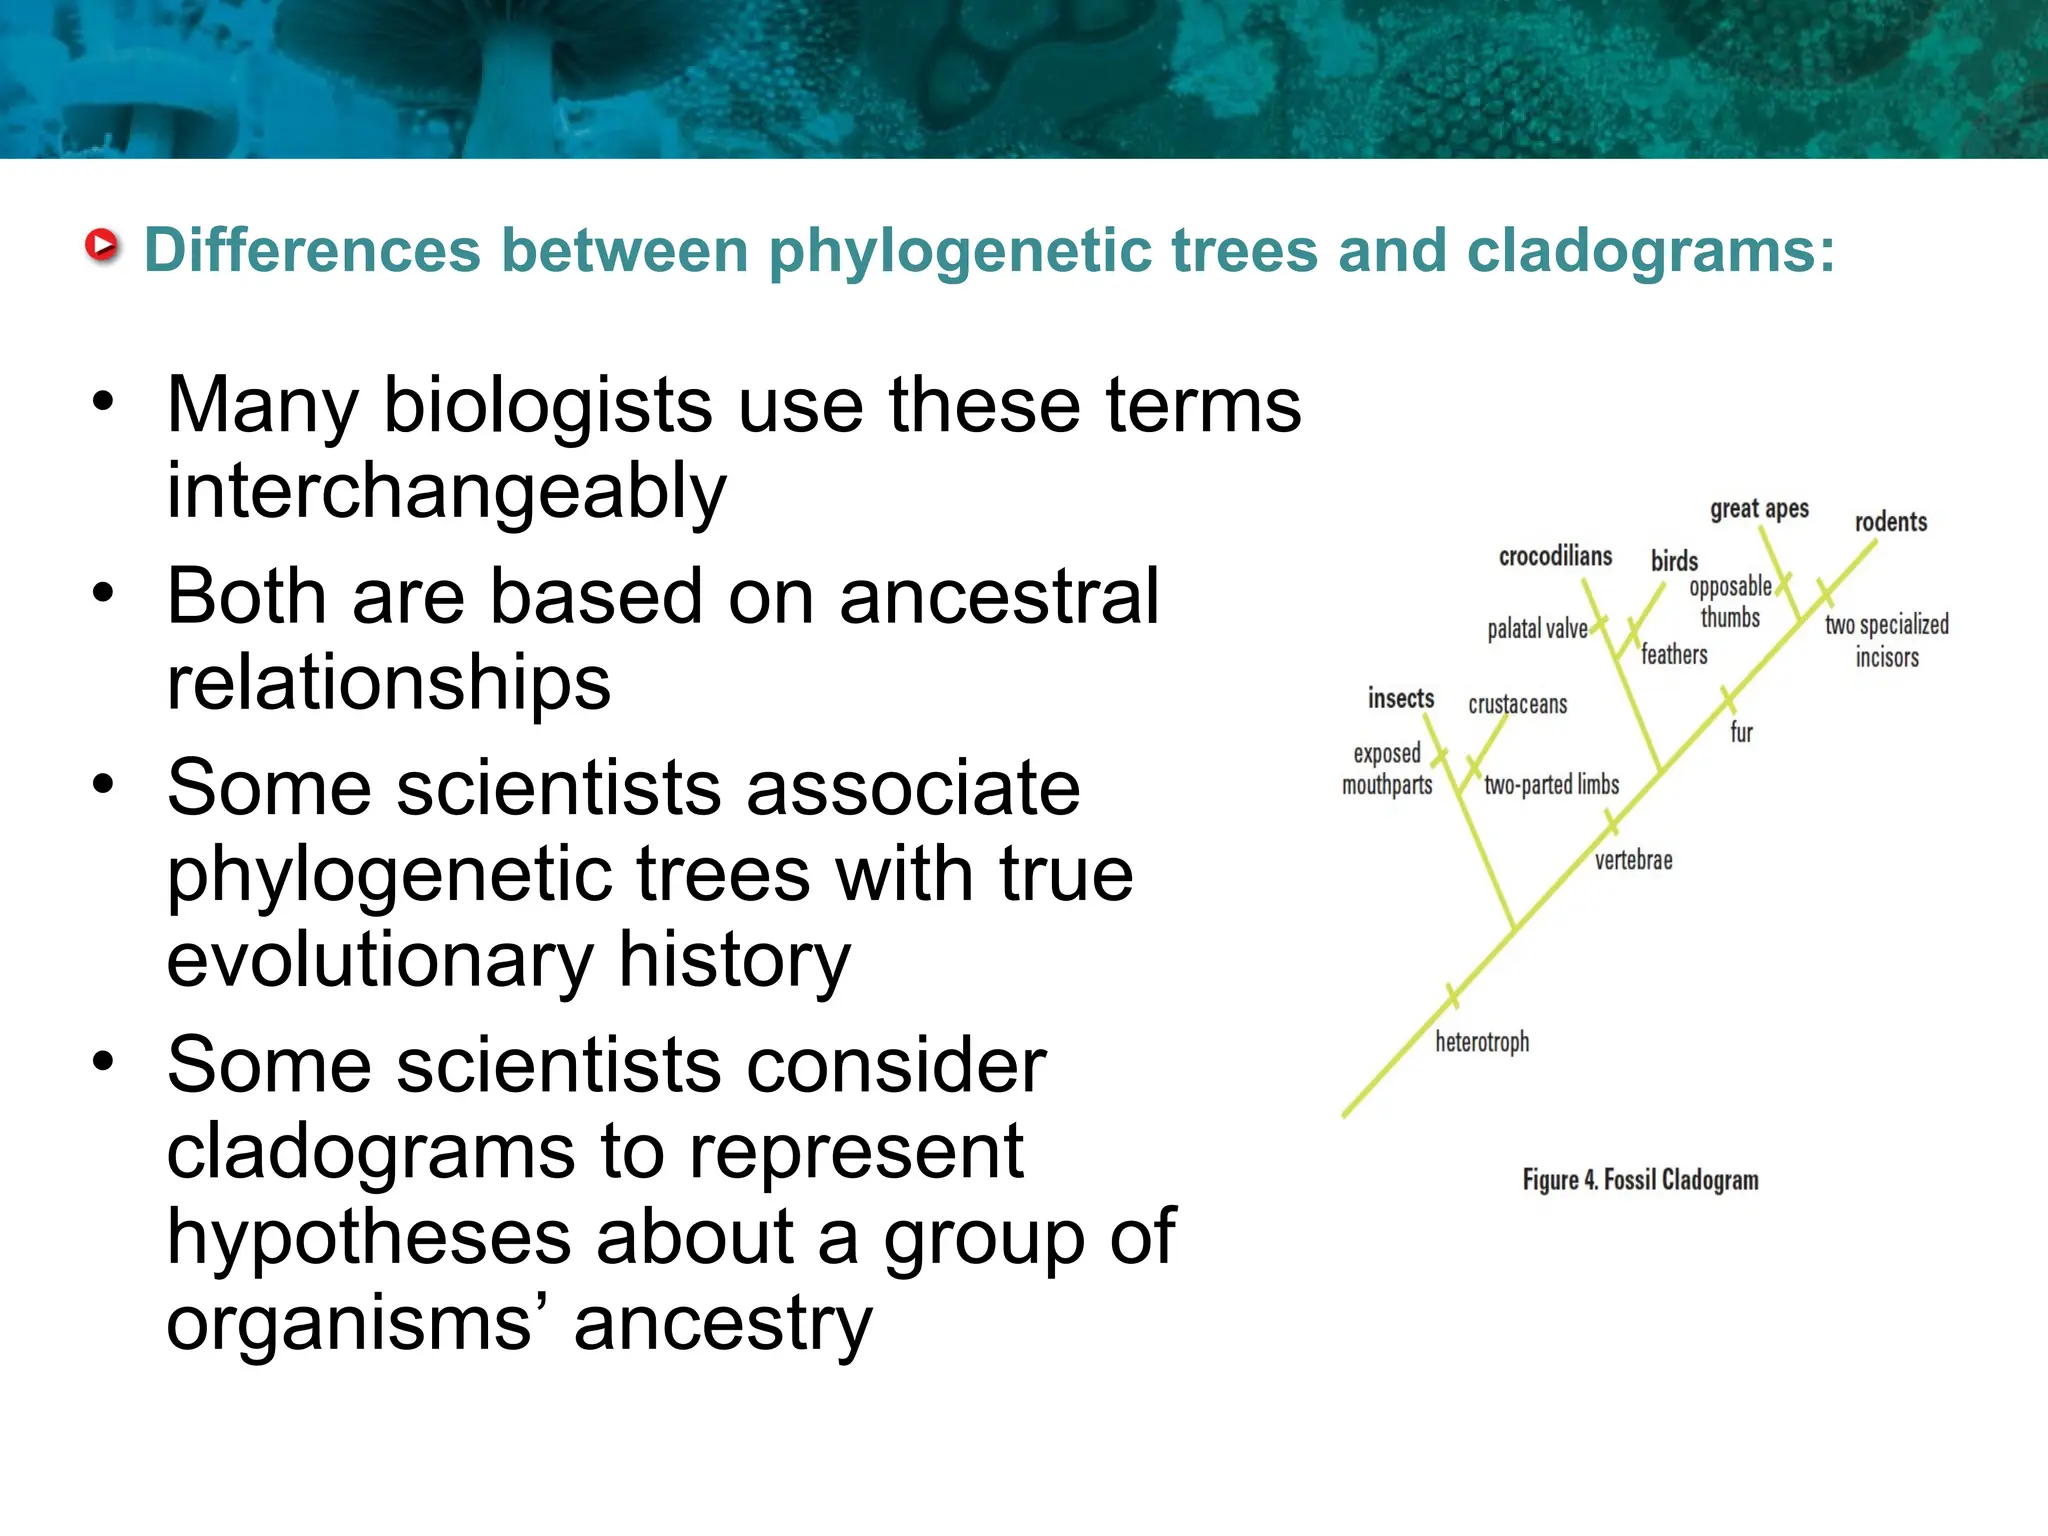
Differences between phylogenetictrees and cladograms:
• Many biologists use these terms
interchangeably
• Both are based on ancestral
relationships
• Some scientists associate
phylogenetic trees with true
evolutionary history
• Some scientists consider
cladograms to represent
hypotheses about a group of
organisms’ ancestry
10.
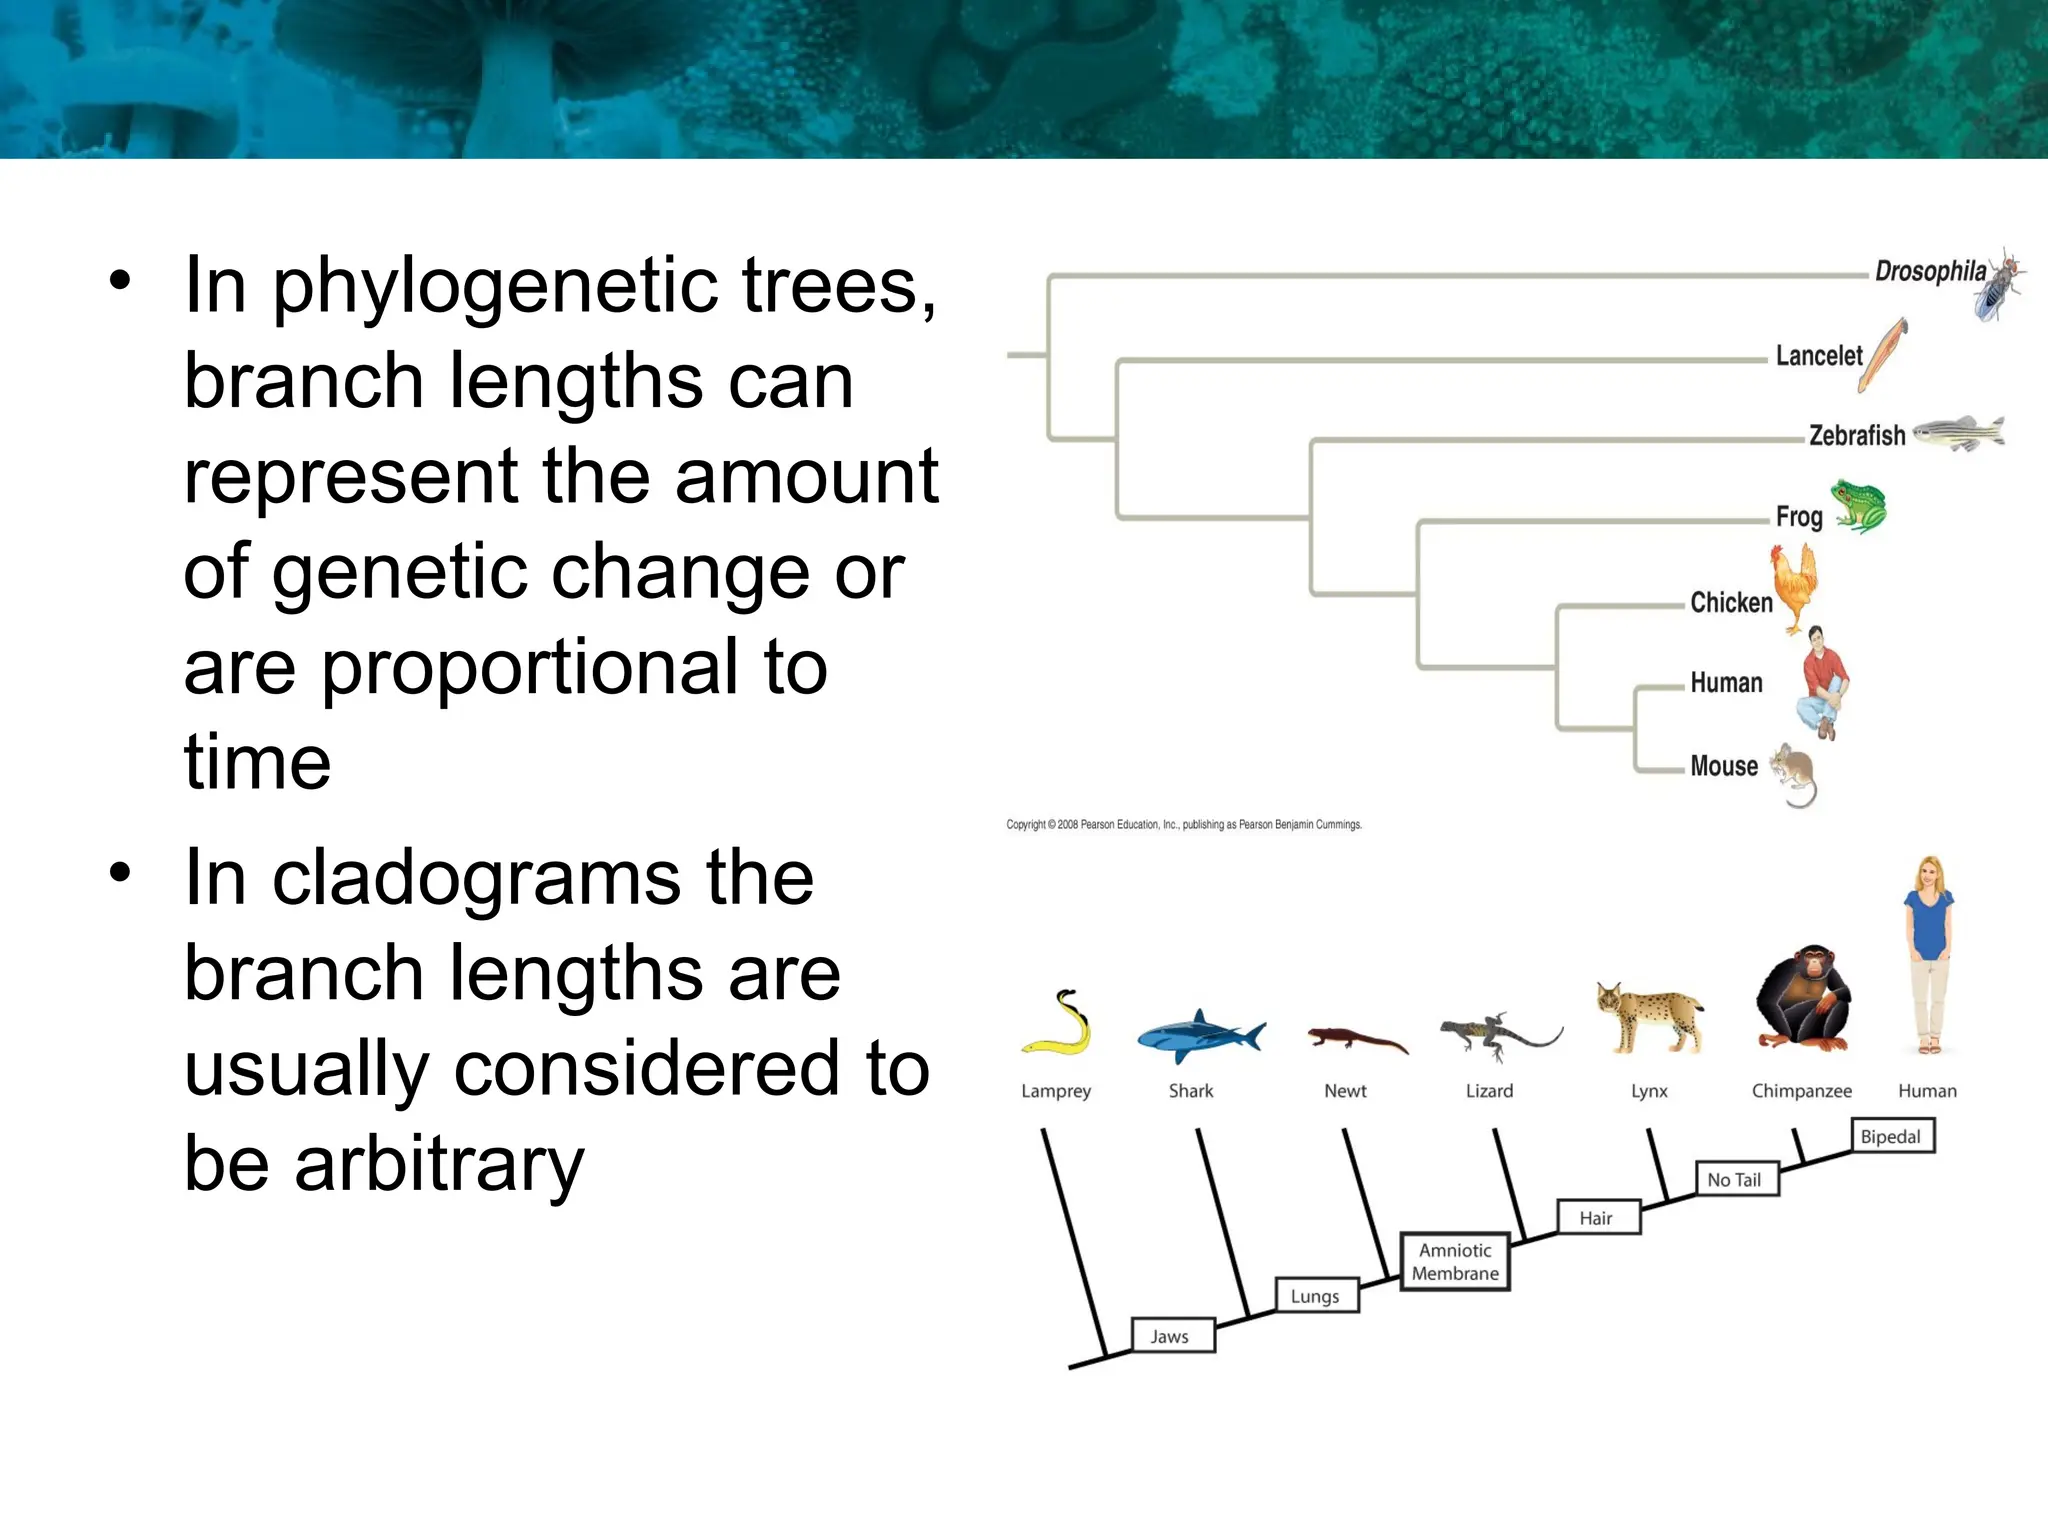
• In phylogenetictrees,
branch lengths can
represent the amount
of genetic change or
are proportional to
time
• In cladograms the
branch lengths are
usually considered to
be arbitrary