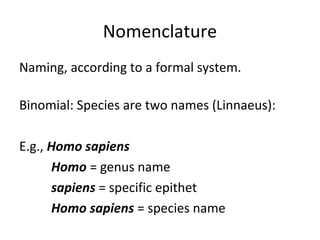
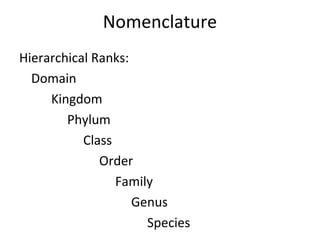
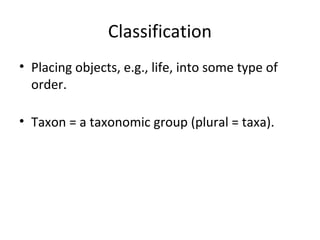
This document provides an overview of systematics and phylogeny, including:
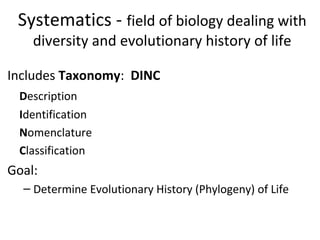
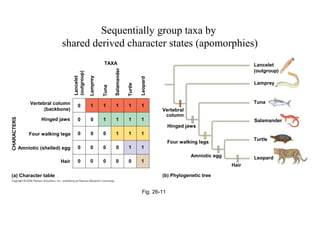
1) Systematics aims to determine the evolutionary history (phylogeny) of life through taxonomy, classification, and phylogenetic analysis.
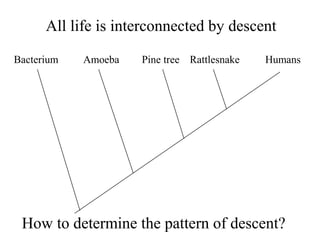
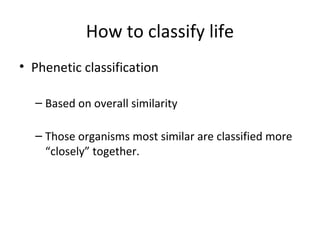
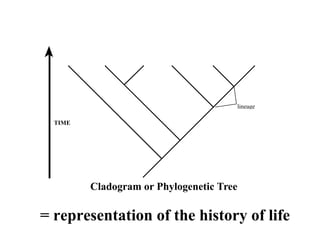
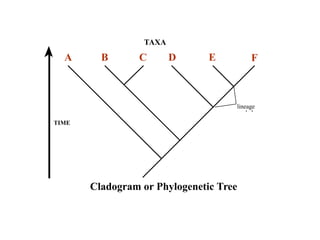
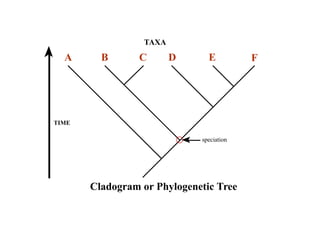
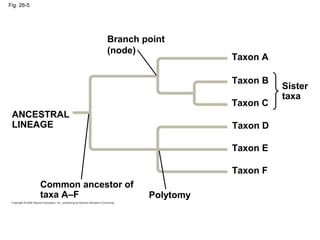
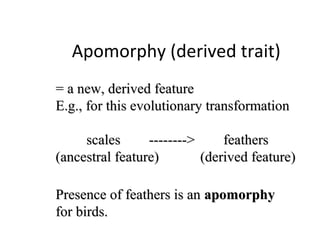
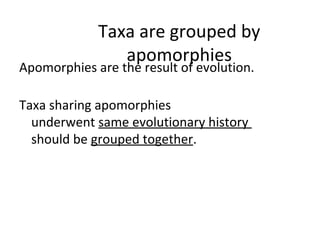
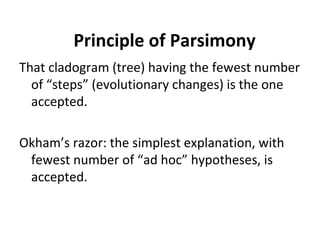
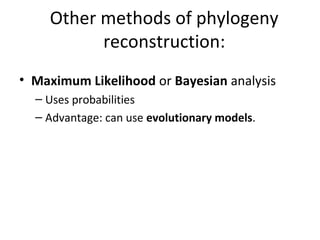
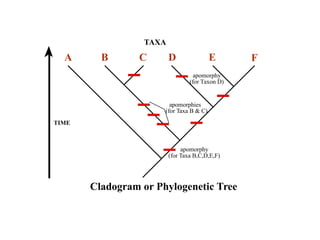
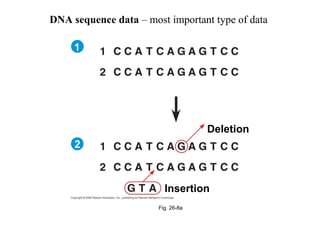
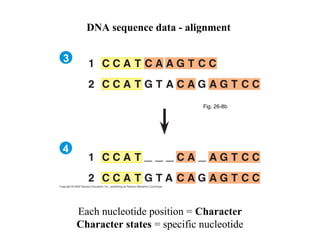
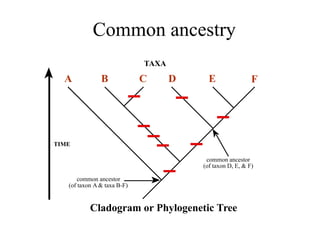
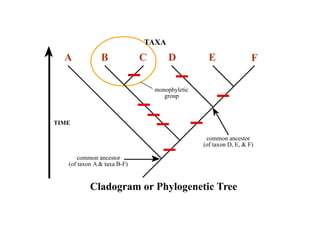
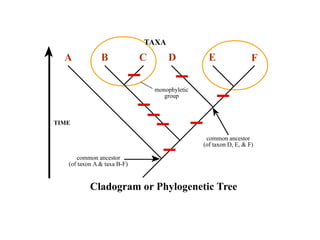
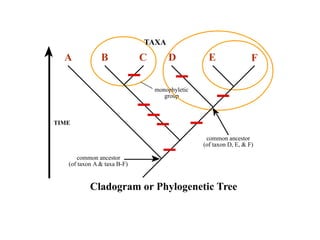
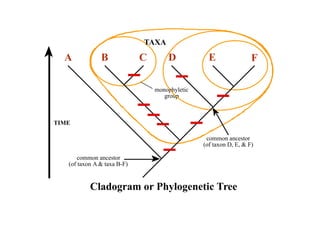
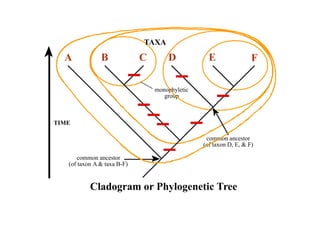
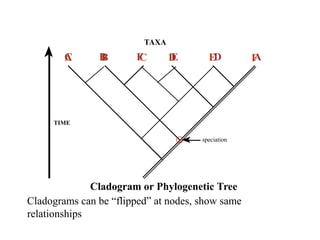
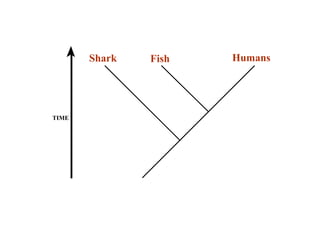
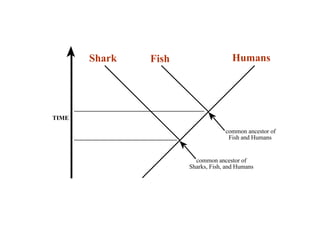
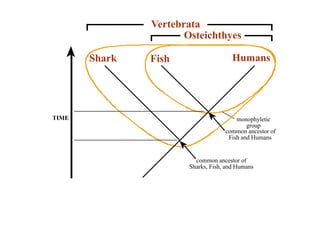
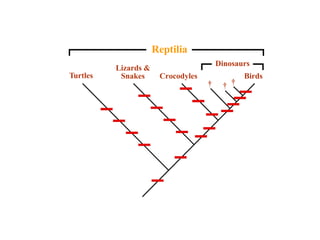
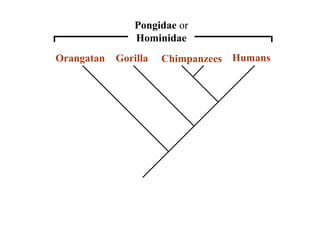
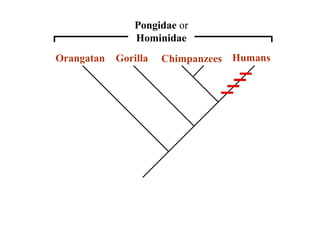
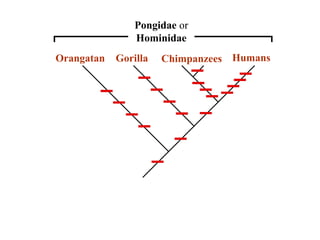
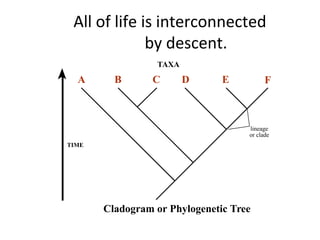
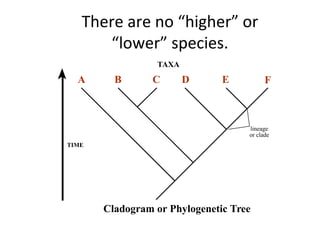
2) Phylogenetic analysis involves determining shared derived characters (apomorphies) between taxa and constructing cladograms to represent evolutionary relationships.
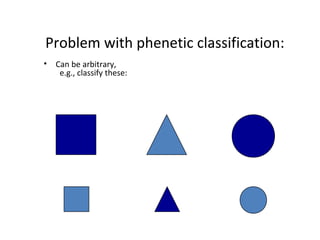
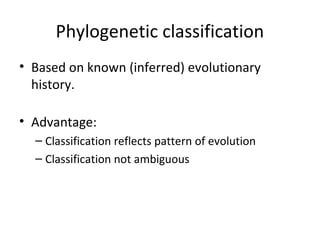
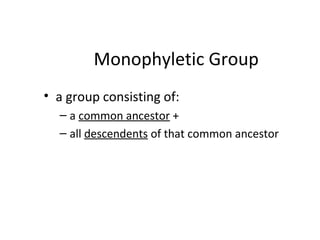
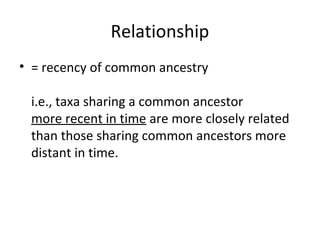
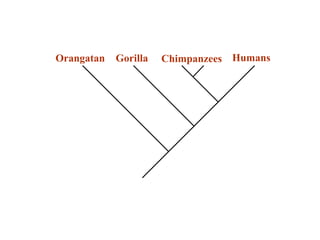
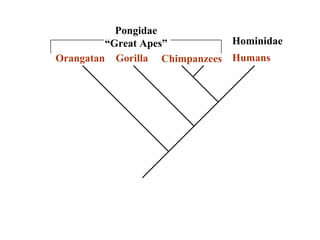
3) Phylogenetic classification reflects evolutionary history by grouping taxa based on shared ancestry, rather than just overall similarity.


![Classification%20 powerpoint[1]](https://cdn.slidesharecdn.com/ss_thumbnails/classification20powerpoint1-120420070331-phpapp01-thumbnail.jpg?width=640&height=640&fit=bounds)


