Download as PDF, PPTX
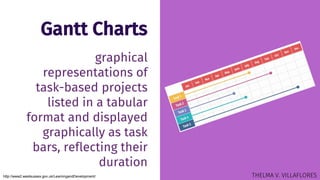


Gantt charts are graphical representations of project schedules that display tasks, milestones, dependencies, and progress. They list tasks in a tabular format and display them as horizontal bars against a timeline, showing when each task begins and ends. An example Gantt chart shows tasks for capstone research from February to June, with start and end dates for tasks like finalizing the research title, creating the Gantt chart, and conceptualizing a product design. Gantt charts are useful for determining time frames, identifying task order and dependencies, keeping track of progress, and making necessary schedule adjustments.