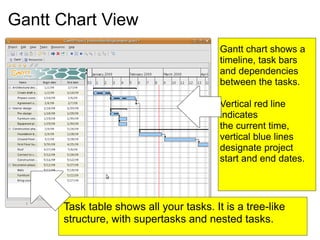
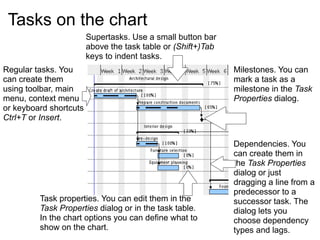
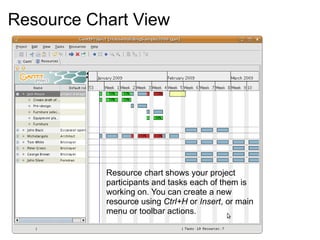
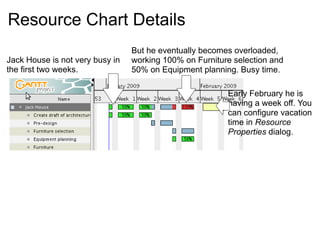
Gantt Project
quick introduction
Gantt Chart View
Task table shows all your tasks. It is a tree-like
structure, with supertasks and nested tasks.
Gantt chart shows a
timeline, task bars
and dependencies
between the tasks.
Vertical red line
indicates
the current time,
vertical blue lines
designate project
start and end dates.
Tasks on the chart
Regular tasks. You
can create them
using toolbar, main
menu, context menu
or keyboard shortcuts
Ctrl+T or Insert.
Supertasks. Use a small button bar
above the task table or (Shift+)Tab
keys to indent tasks.
Milestones. You can
mark a task as a
milestone in the Task
Properties dialog.
Dependencies. You
can create them in
the Task Properties
dialog or just
dragging a line from a
predecessor to a
successor task. The
dialog lets you
choose dependency
types and lags.
Task properties. You can edit them in the
Task Properties dialog or in the task table.
In the chart options you can define what to
show on the chart.
Resource Chart View
Resource chart shows your project
participants and tasks each of them is
working on. You can create a new
resource using Ctrl+H or Insert, or main
menu or toolbar actions.
Resource Chart Details
Jack House is not very busy in
the first two weeks.
But he eventually becomes overloaded,
working 100% on Furniture selection and
50% on Equipment planning. Busy time.
Early February he is
having a week off. You
can configure vacation
time in Resource
Properties dialog.

gantt.ppt-------------------------------

  • 1.
  • 2.
    Gantt Chart View Tasktable shows all your tasks. It is a tree-like structure, with supertasks and nested tasks. Gantt chart shows a timeline, task bars and dependencies between the tasks. Vertical red line indicates the current time, vertical blue lines designate project start and end dates.
  • 3.
    Tasks on thechart Regular tasks. You can create them using toolbar, main menu, context menu or keyboard shortcuts Ctrl+T or Insert. Supertasks. Use a small button bar above the task table or (Shift+)Tab keys to indent tasks. Milestones. You can mark a task as a milestone in the Task Properties dialog. Dependencies. You can create them in the Task Properties dialog or just dragging a line from a predecessor to a successor task. The dialog lets you choose dependency types and lags. Task properties. You can edit them in the Task Properties dialog or in the task table. In the chart options you can define what to show on the chart.
  • 4.
    Resource Chart View Resourcechart shows your project participants and tasks each of them is working on. You can create a new resource using Ctrl+H or Insert, or main menu or toolbar actions.
  • 5.
    Resource Chart Details JackHouse is not very busy in the first two weeks. But he eventually becomes overloaded, working 100% on Furniture selection and 50% on Equipment planning. Busy time. Early February he is having a week off. You can configure vacation time in Resource Properties dialog.