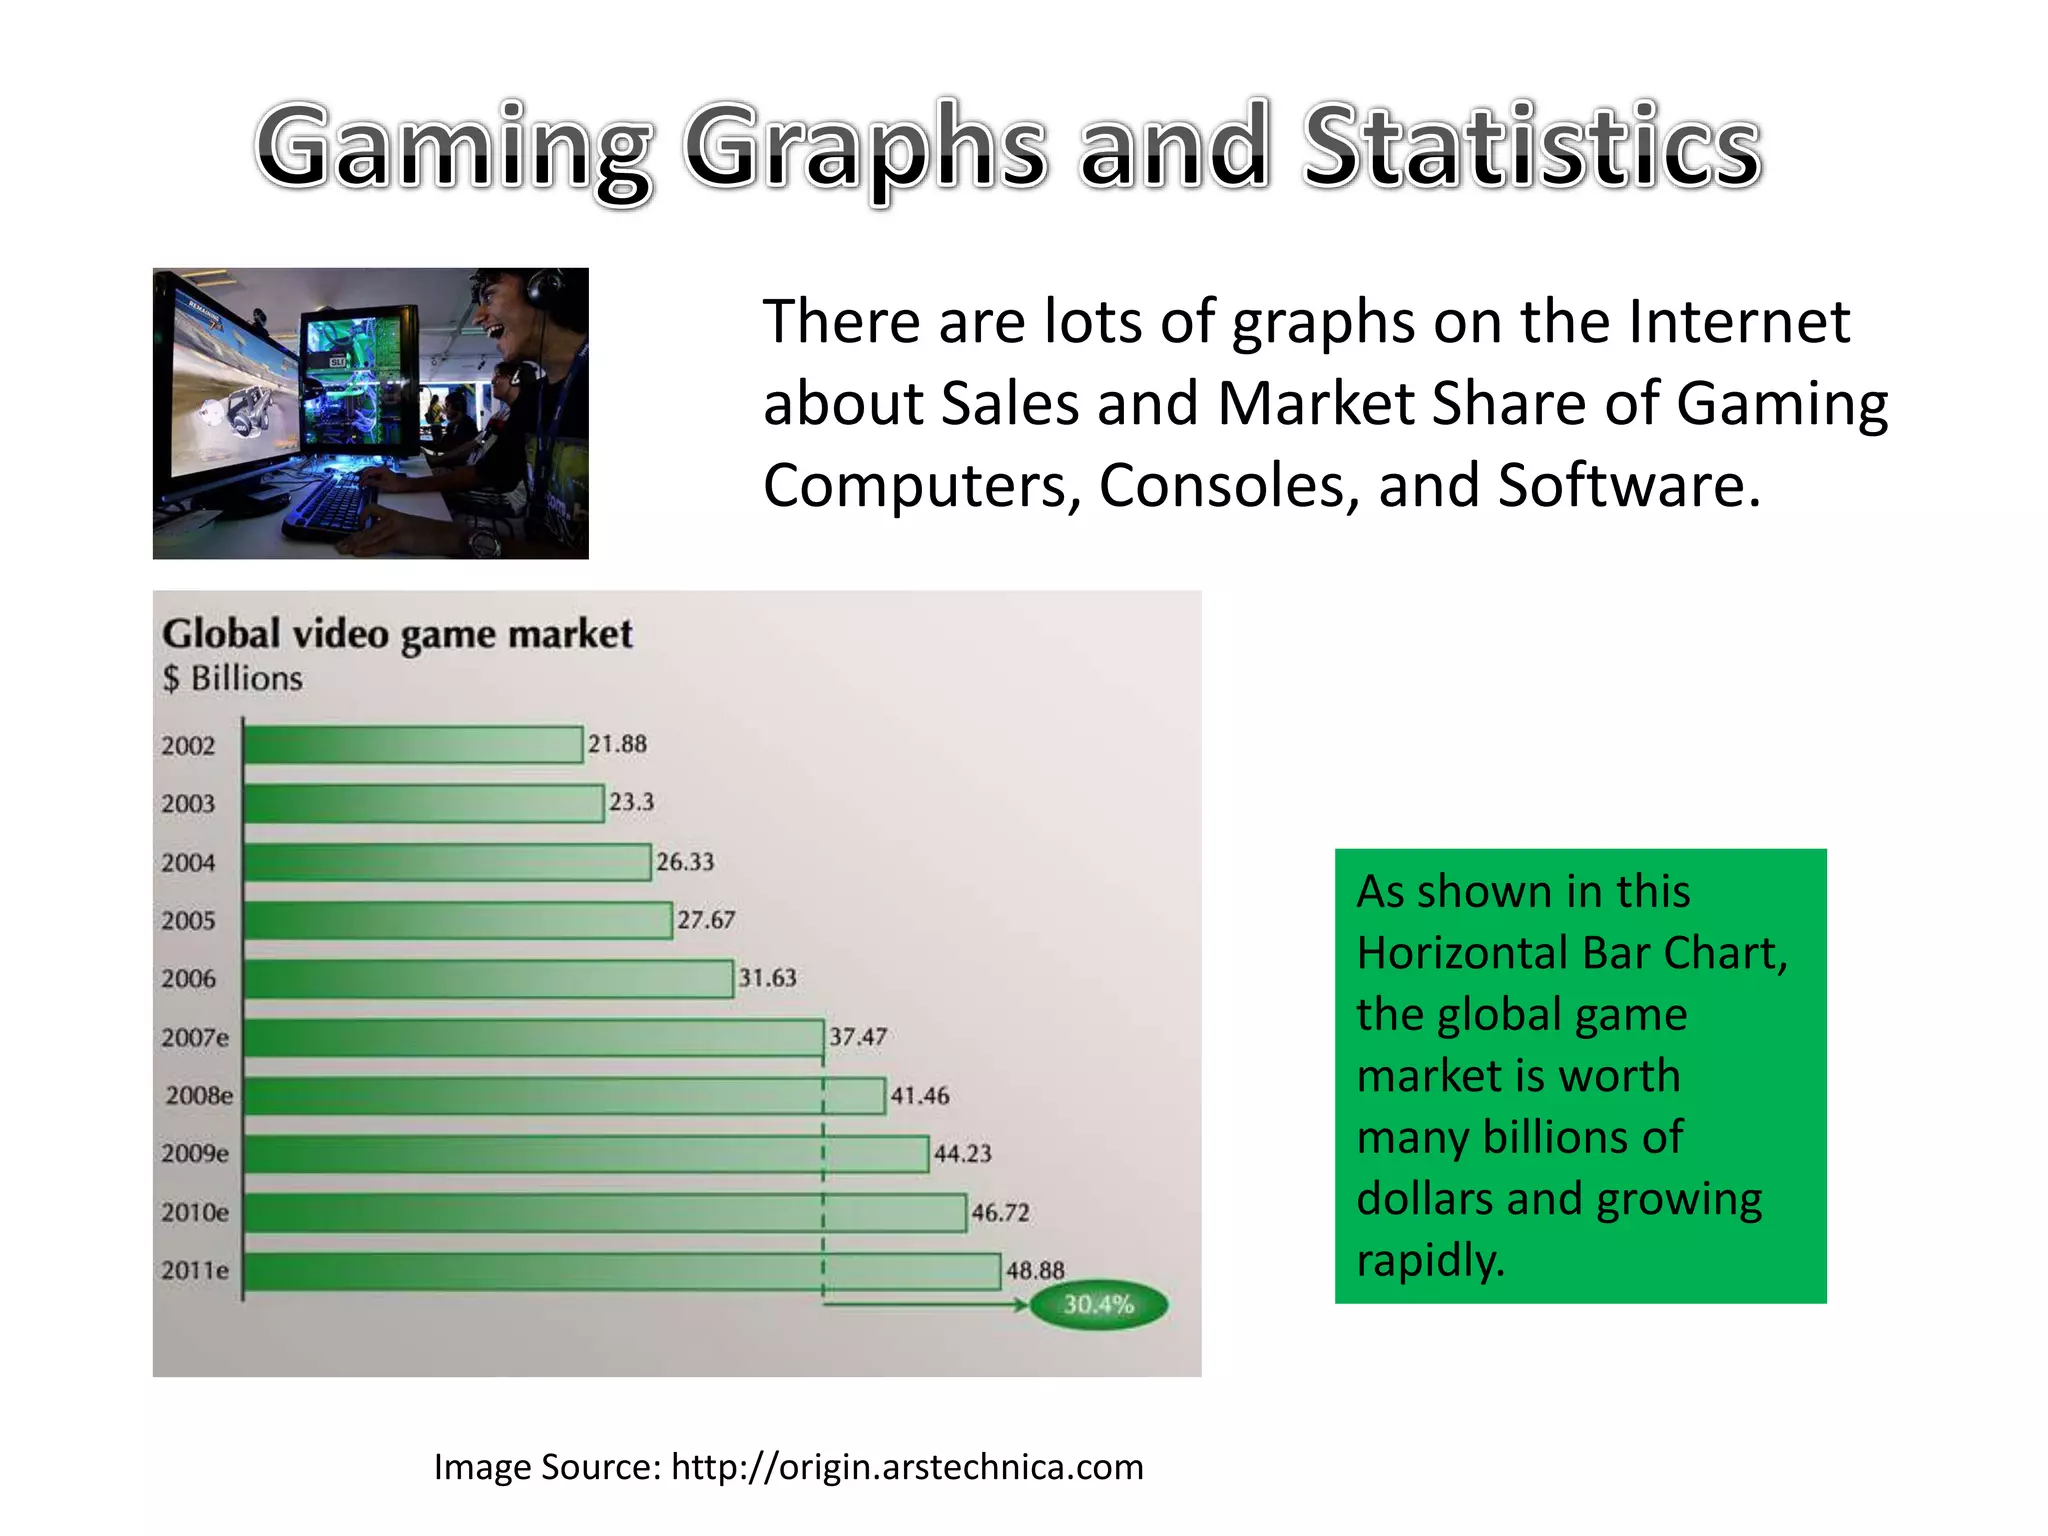
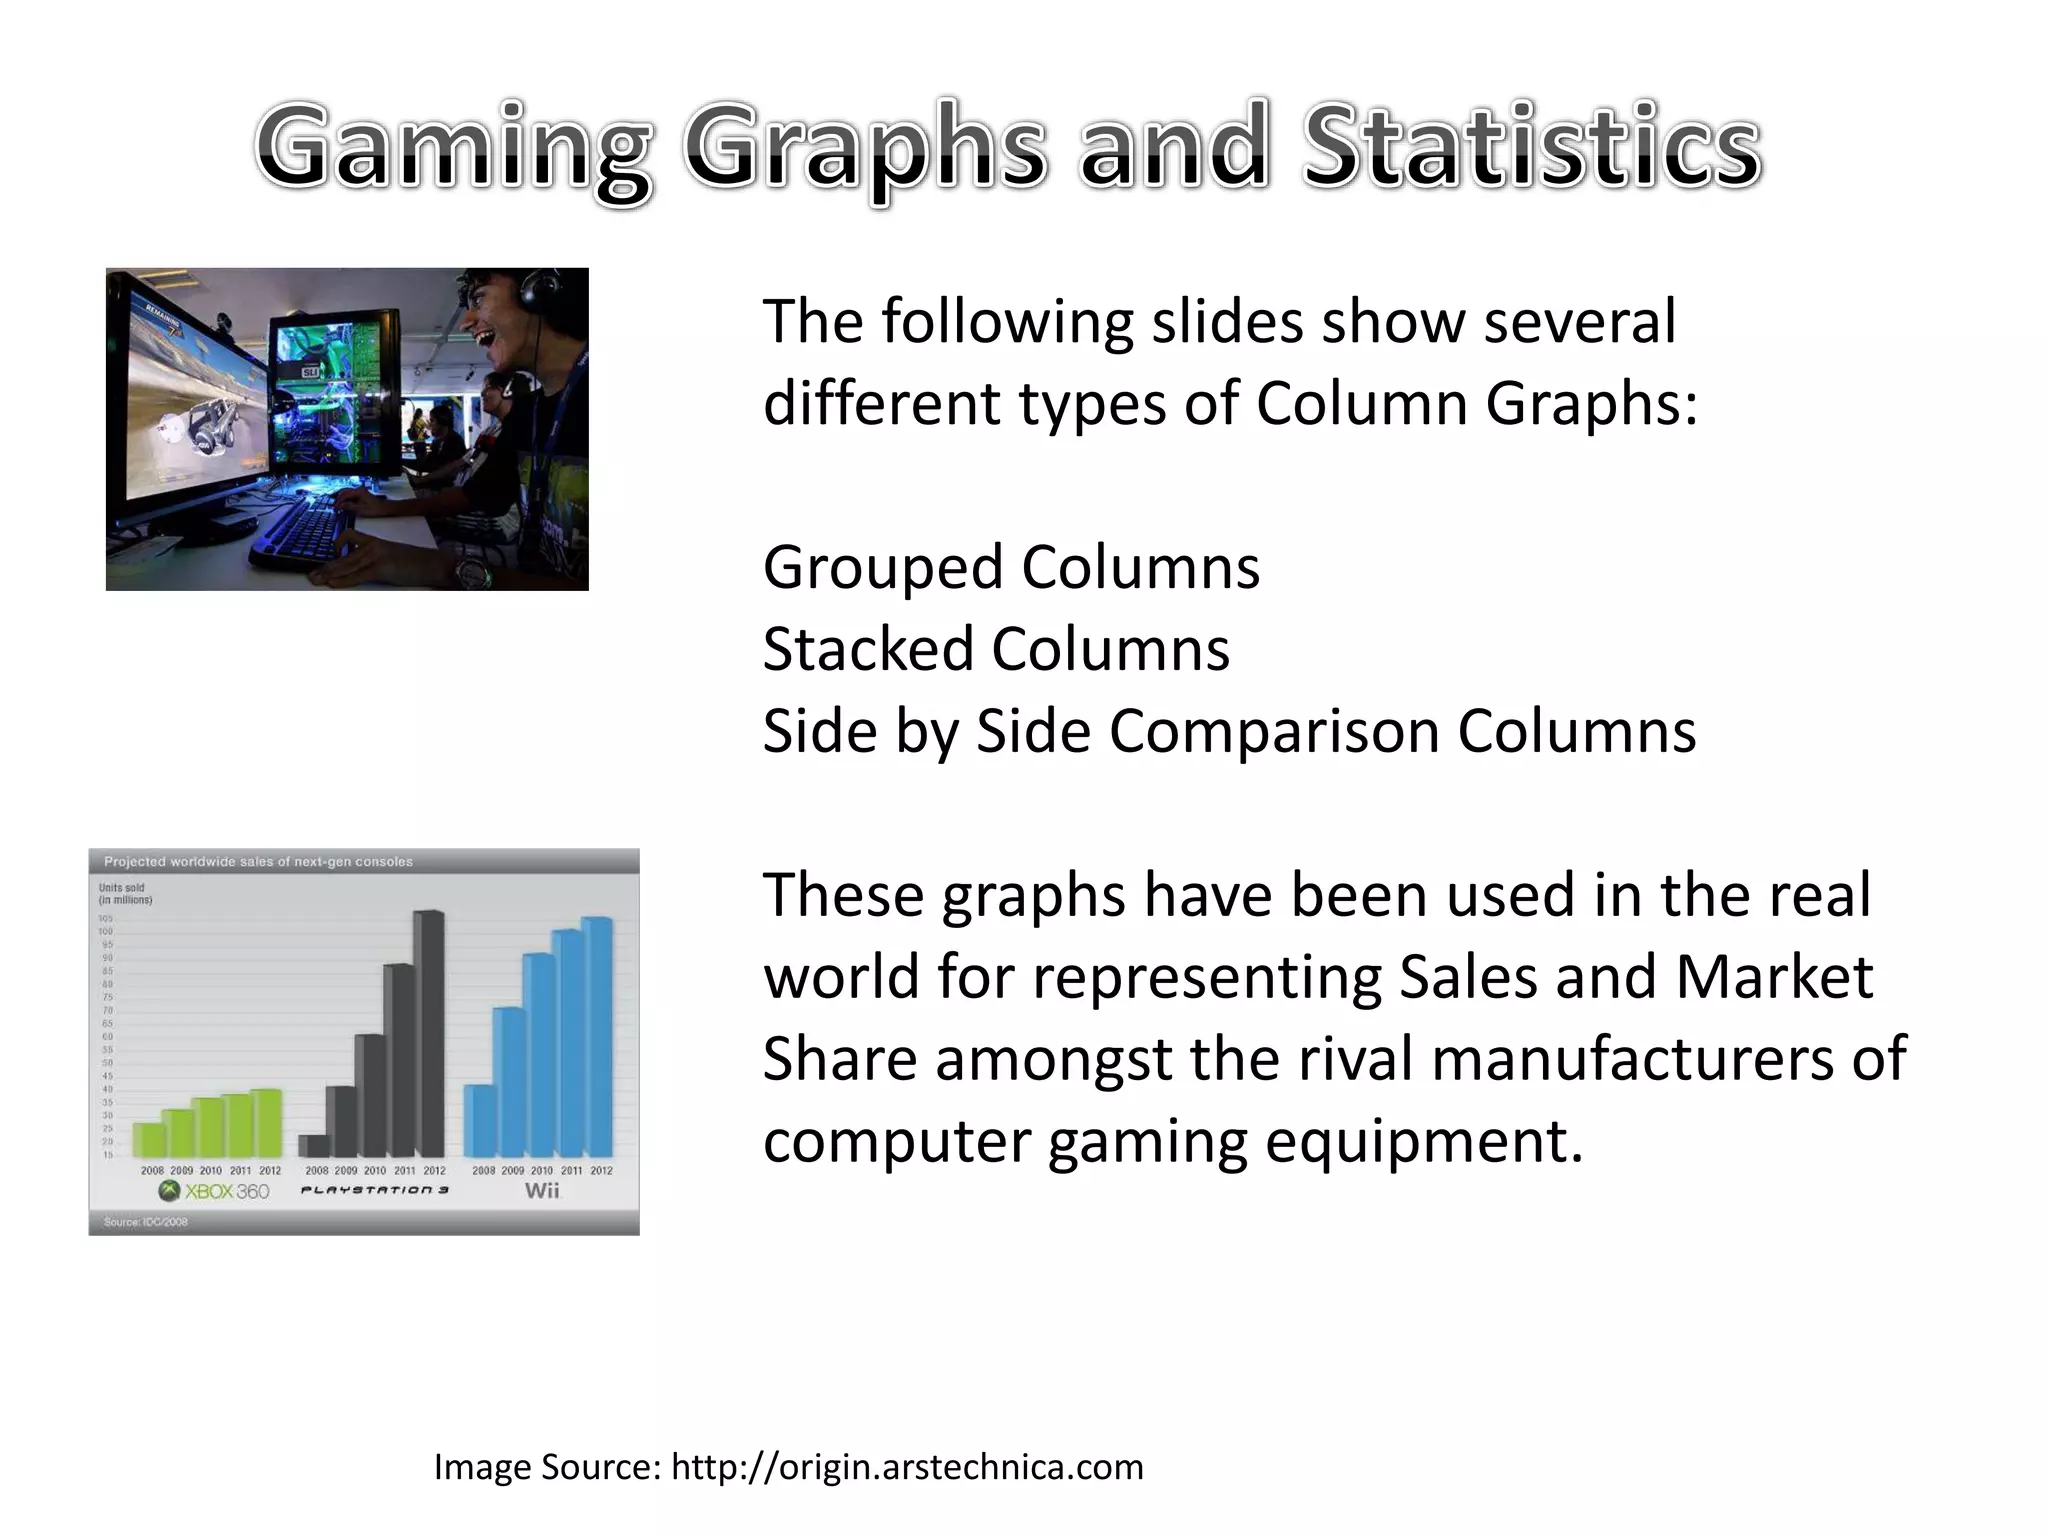
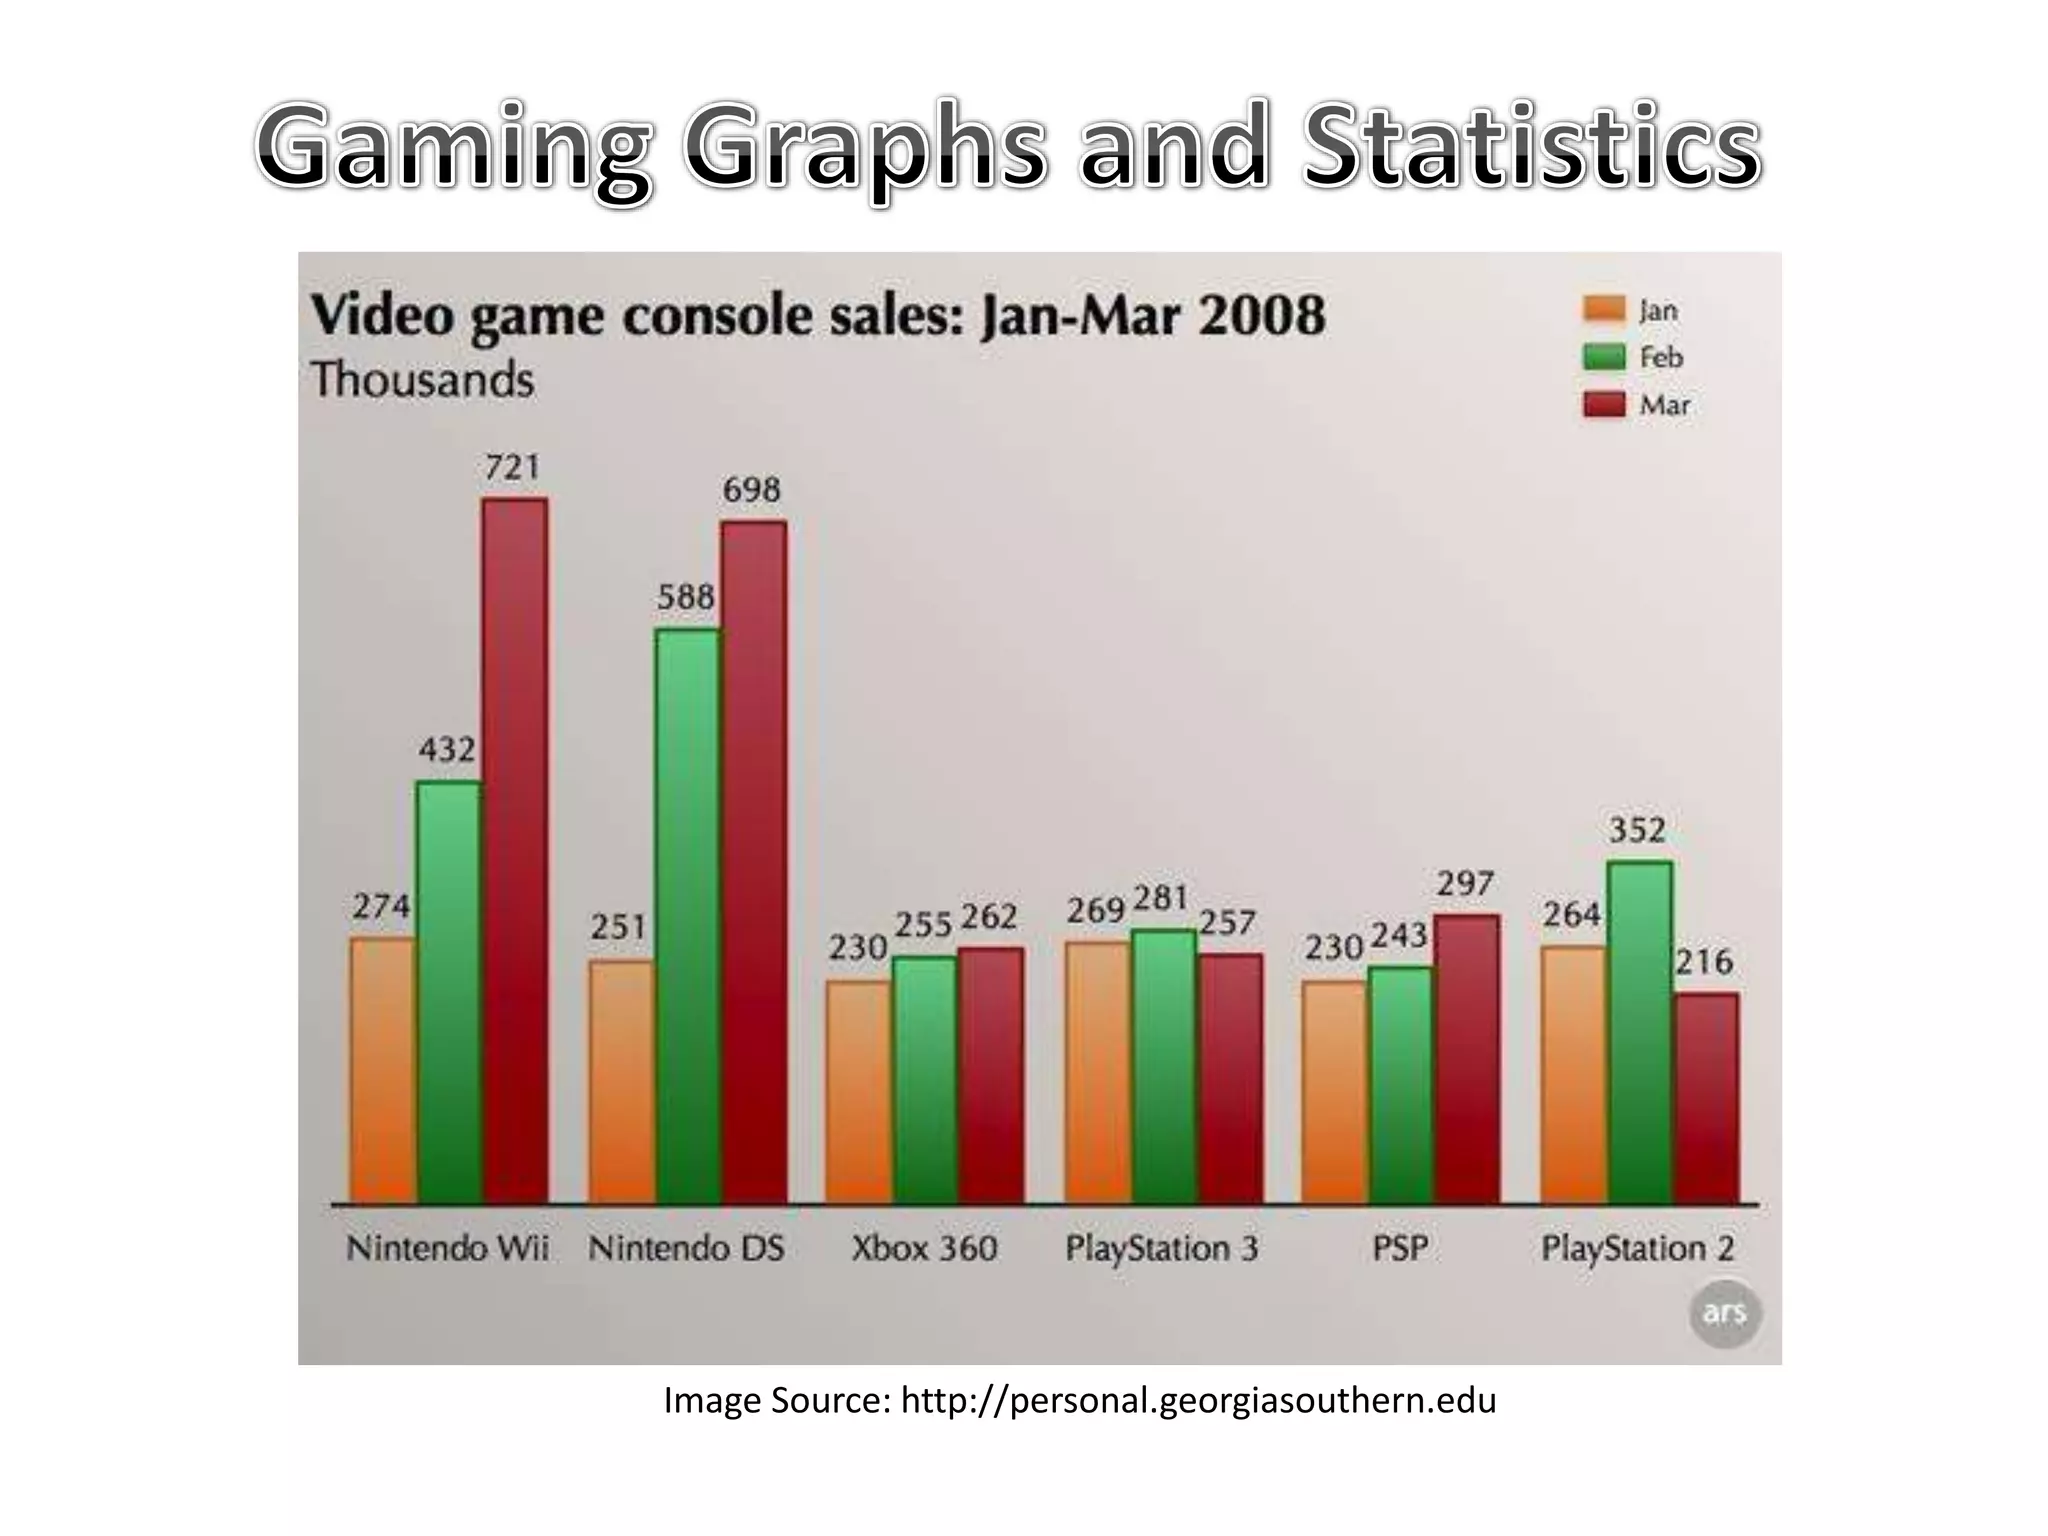
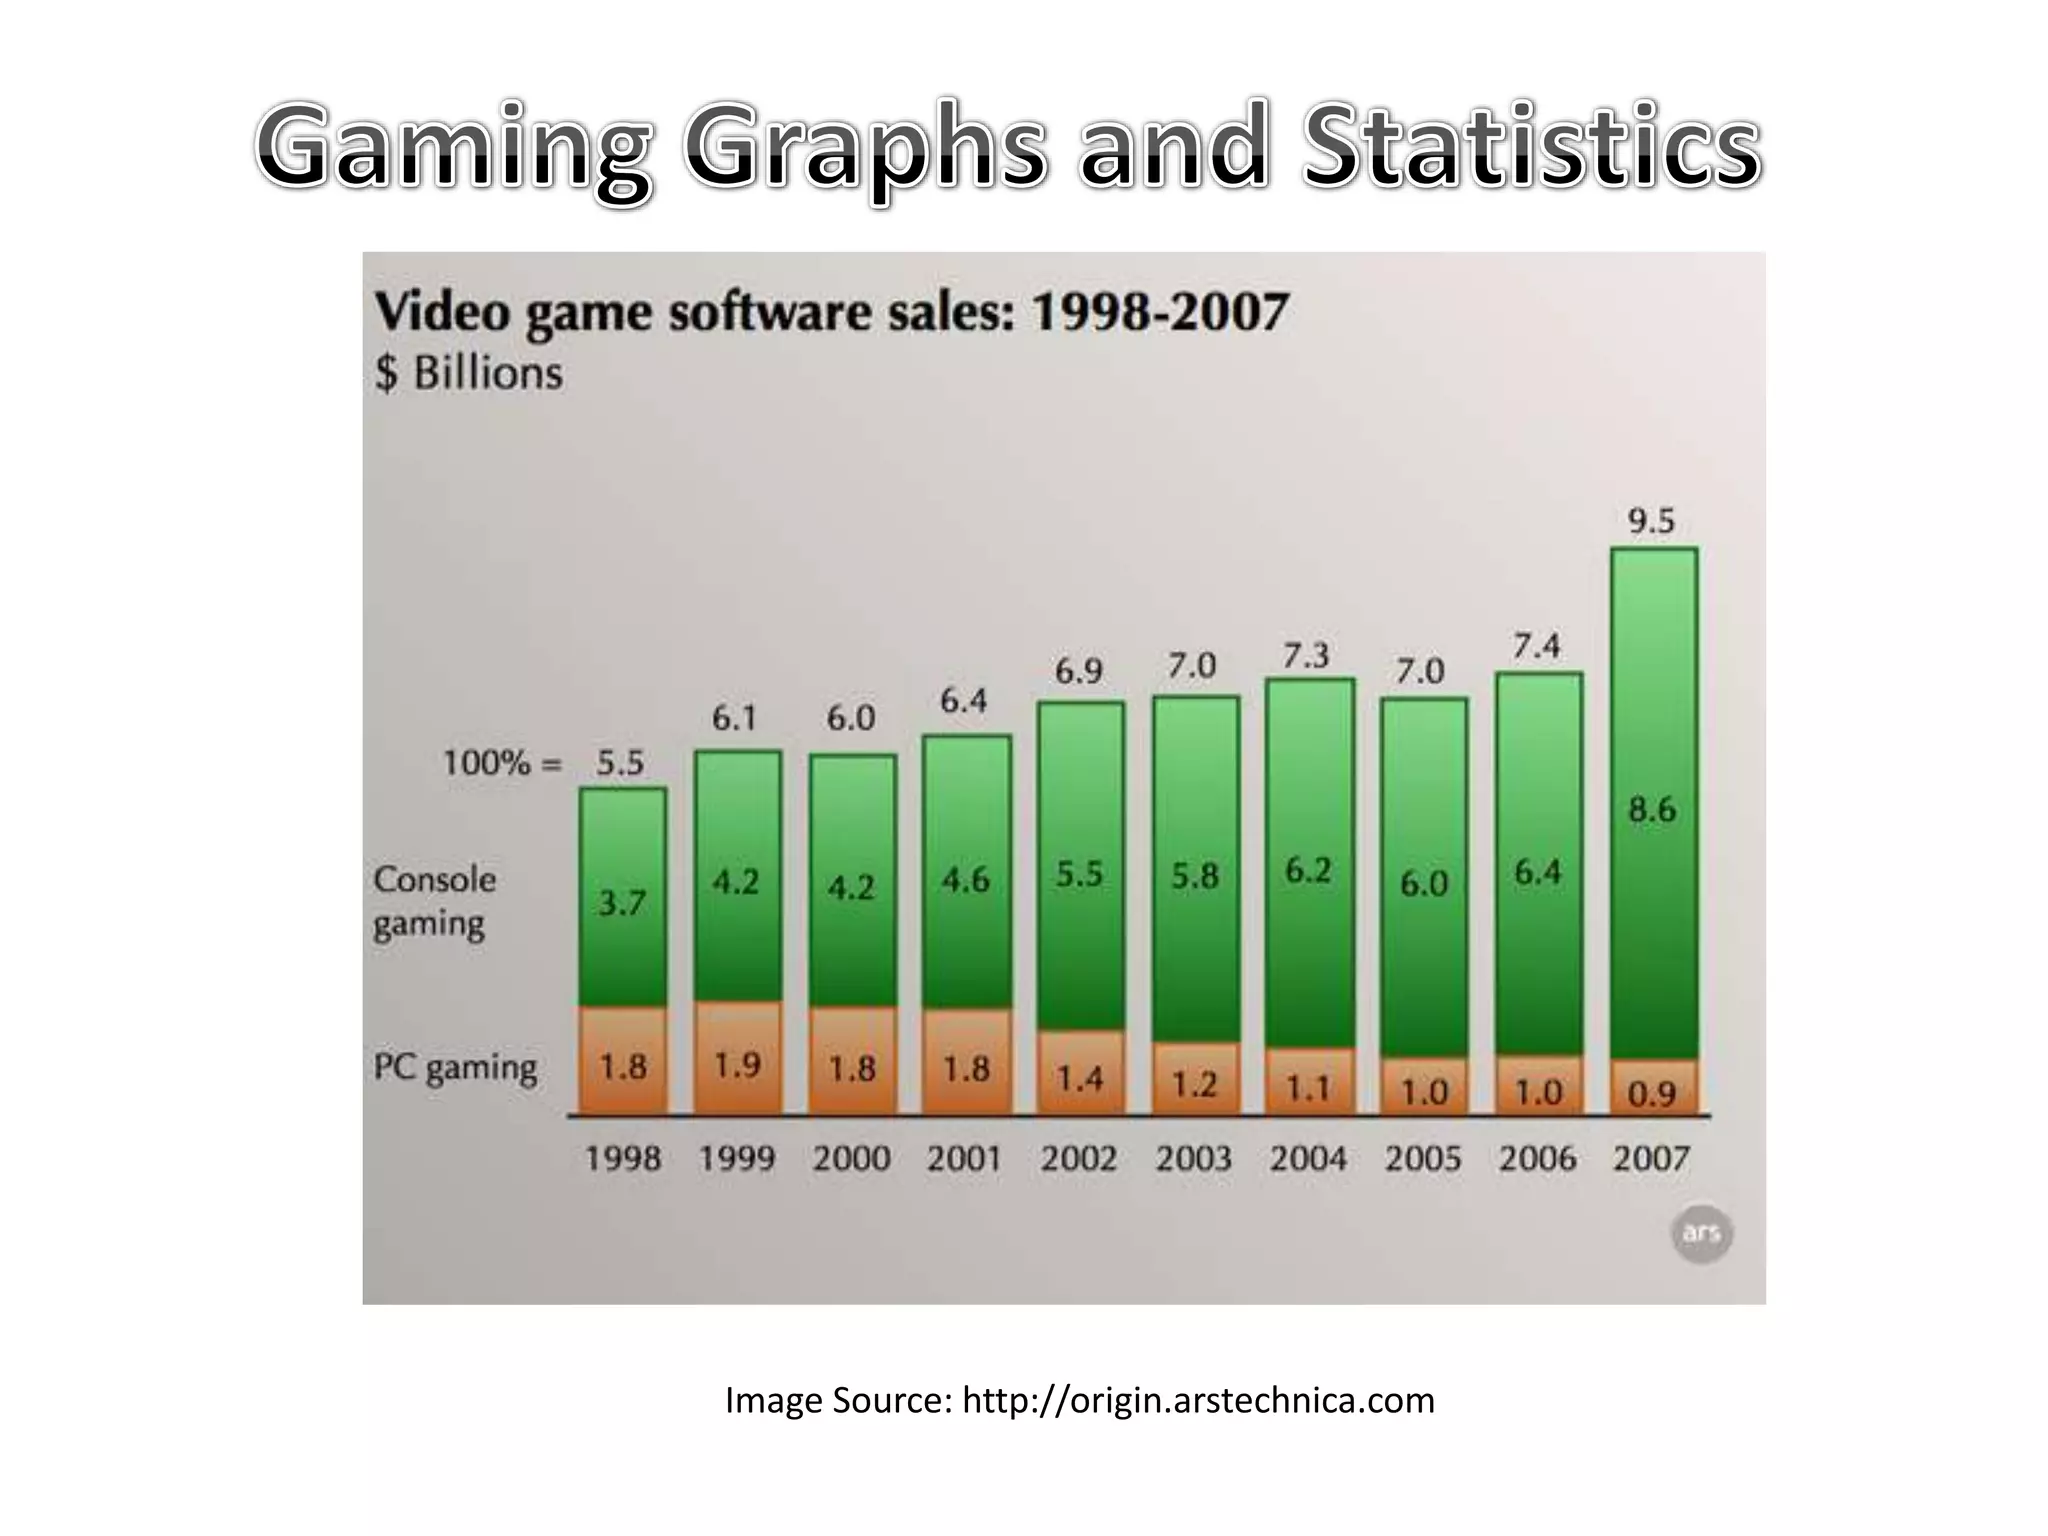
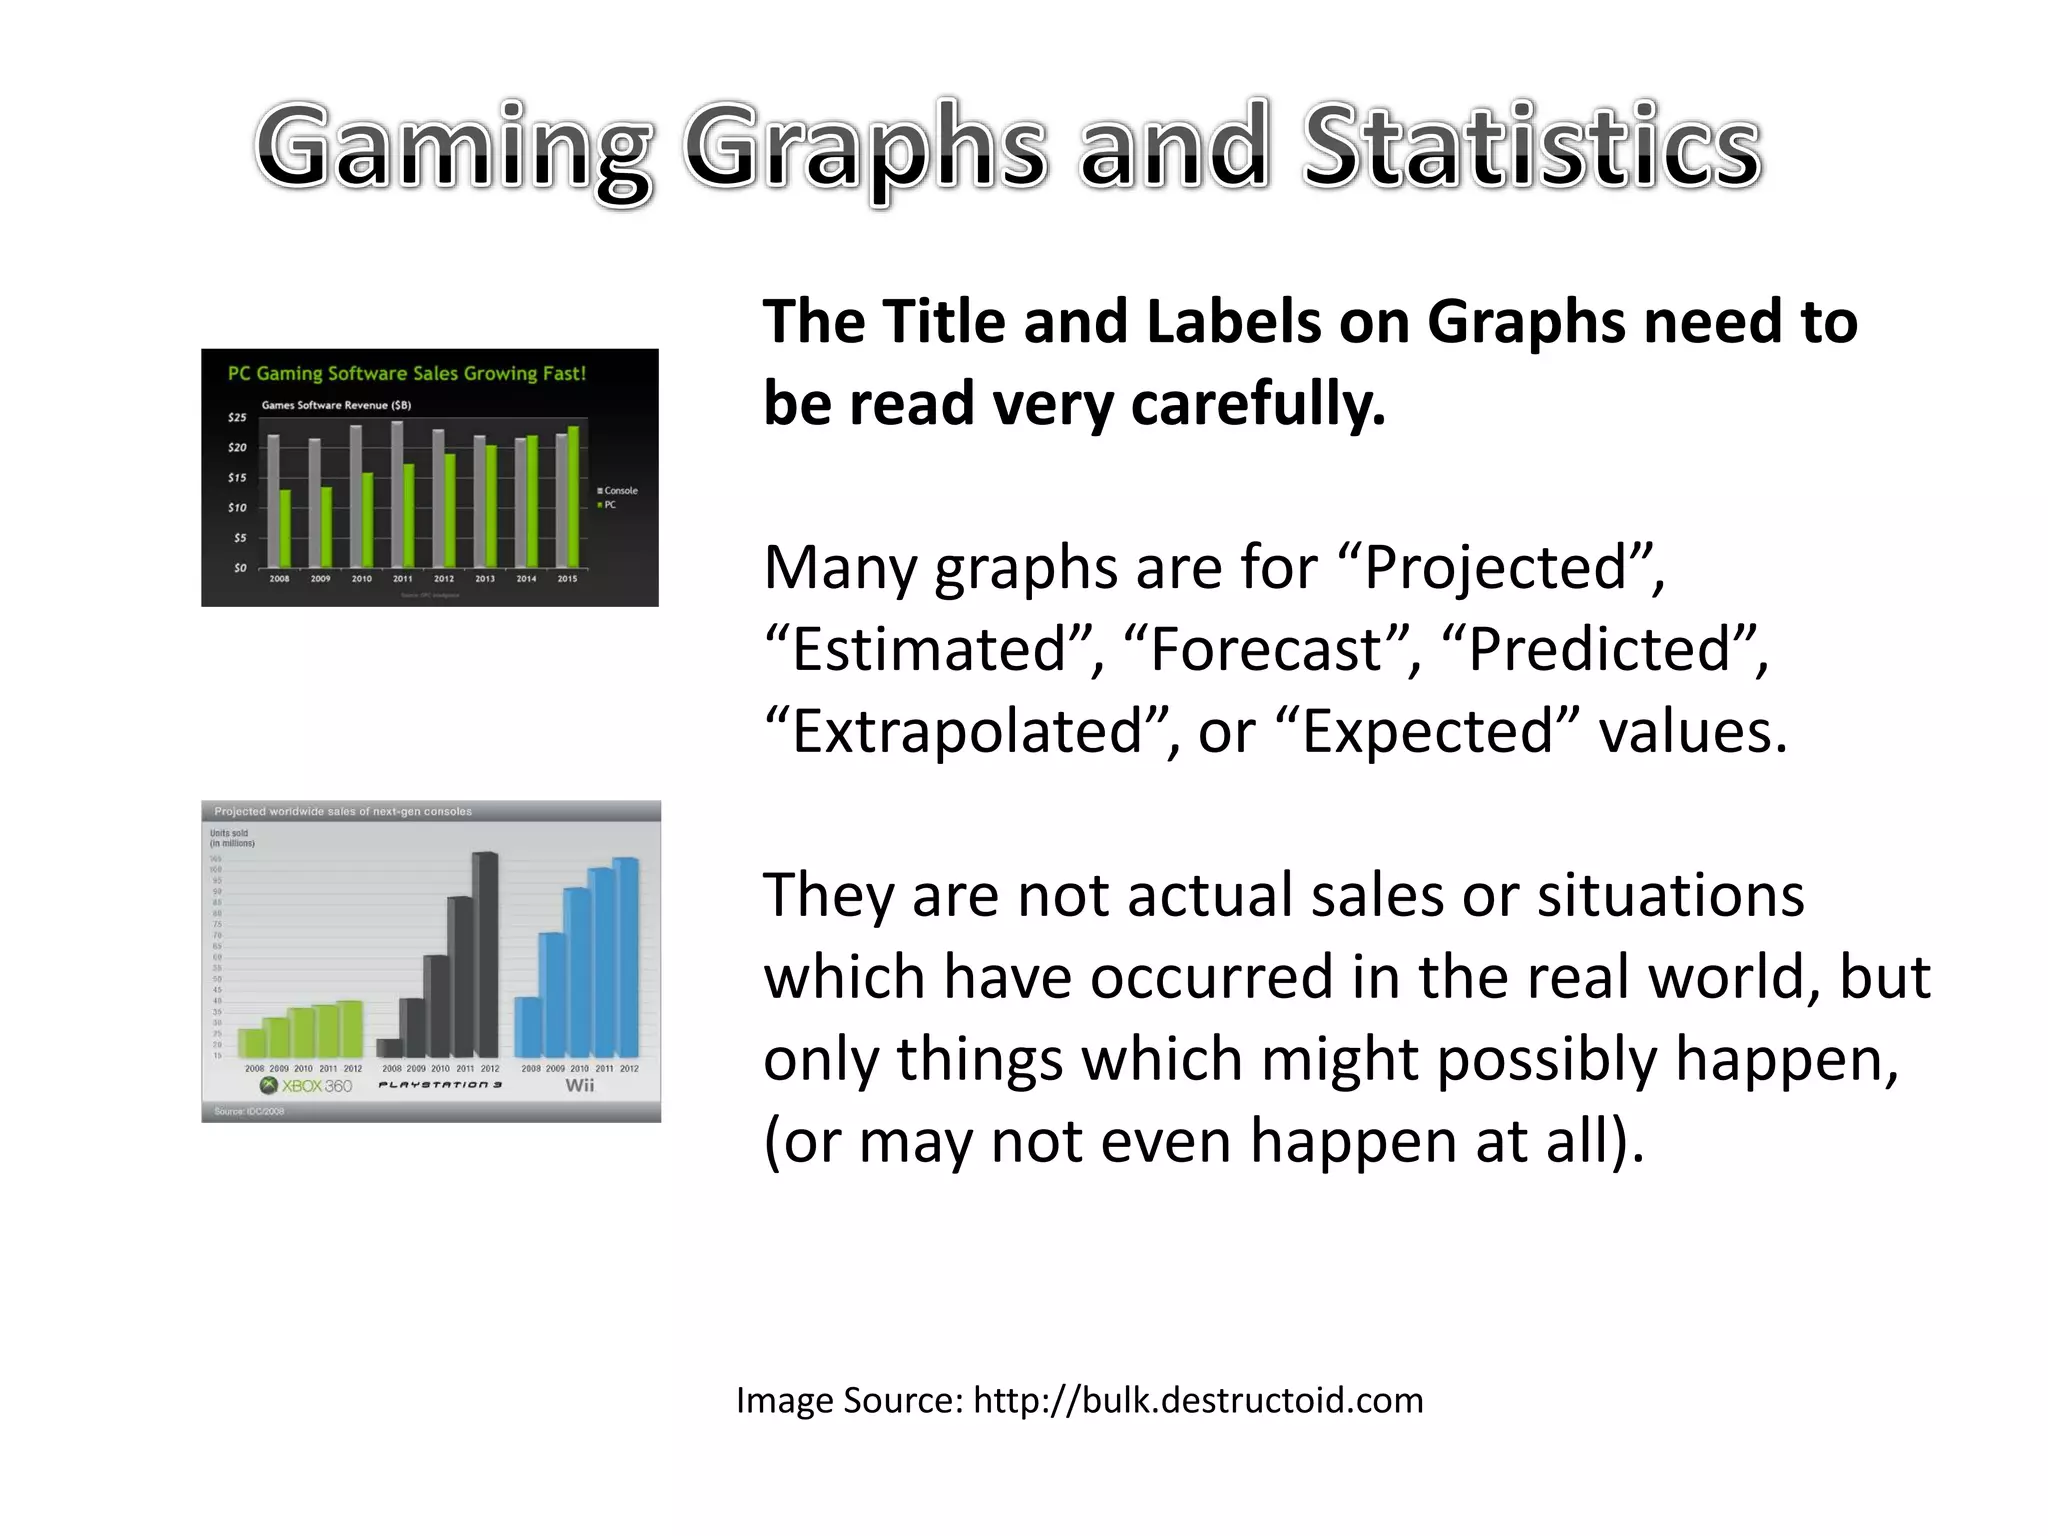
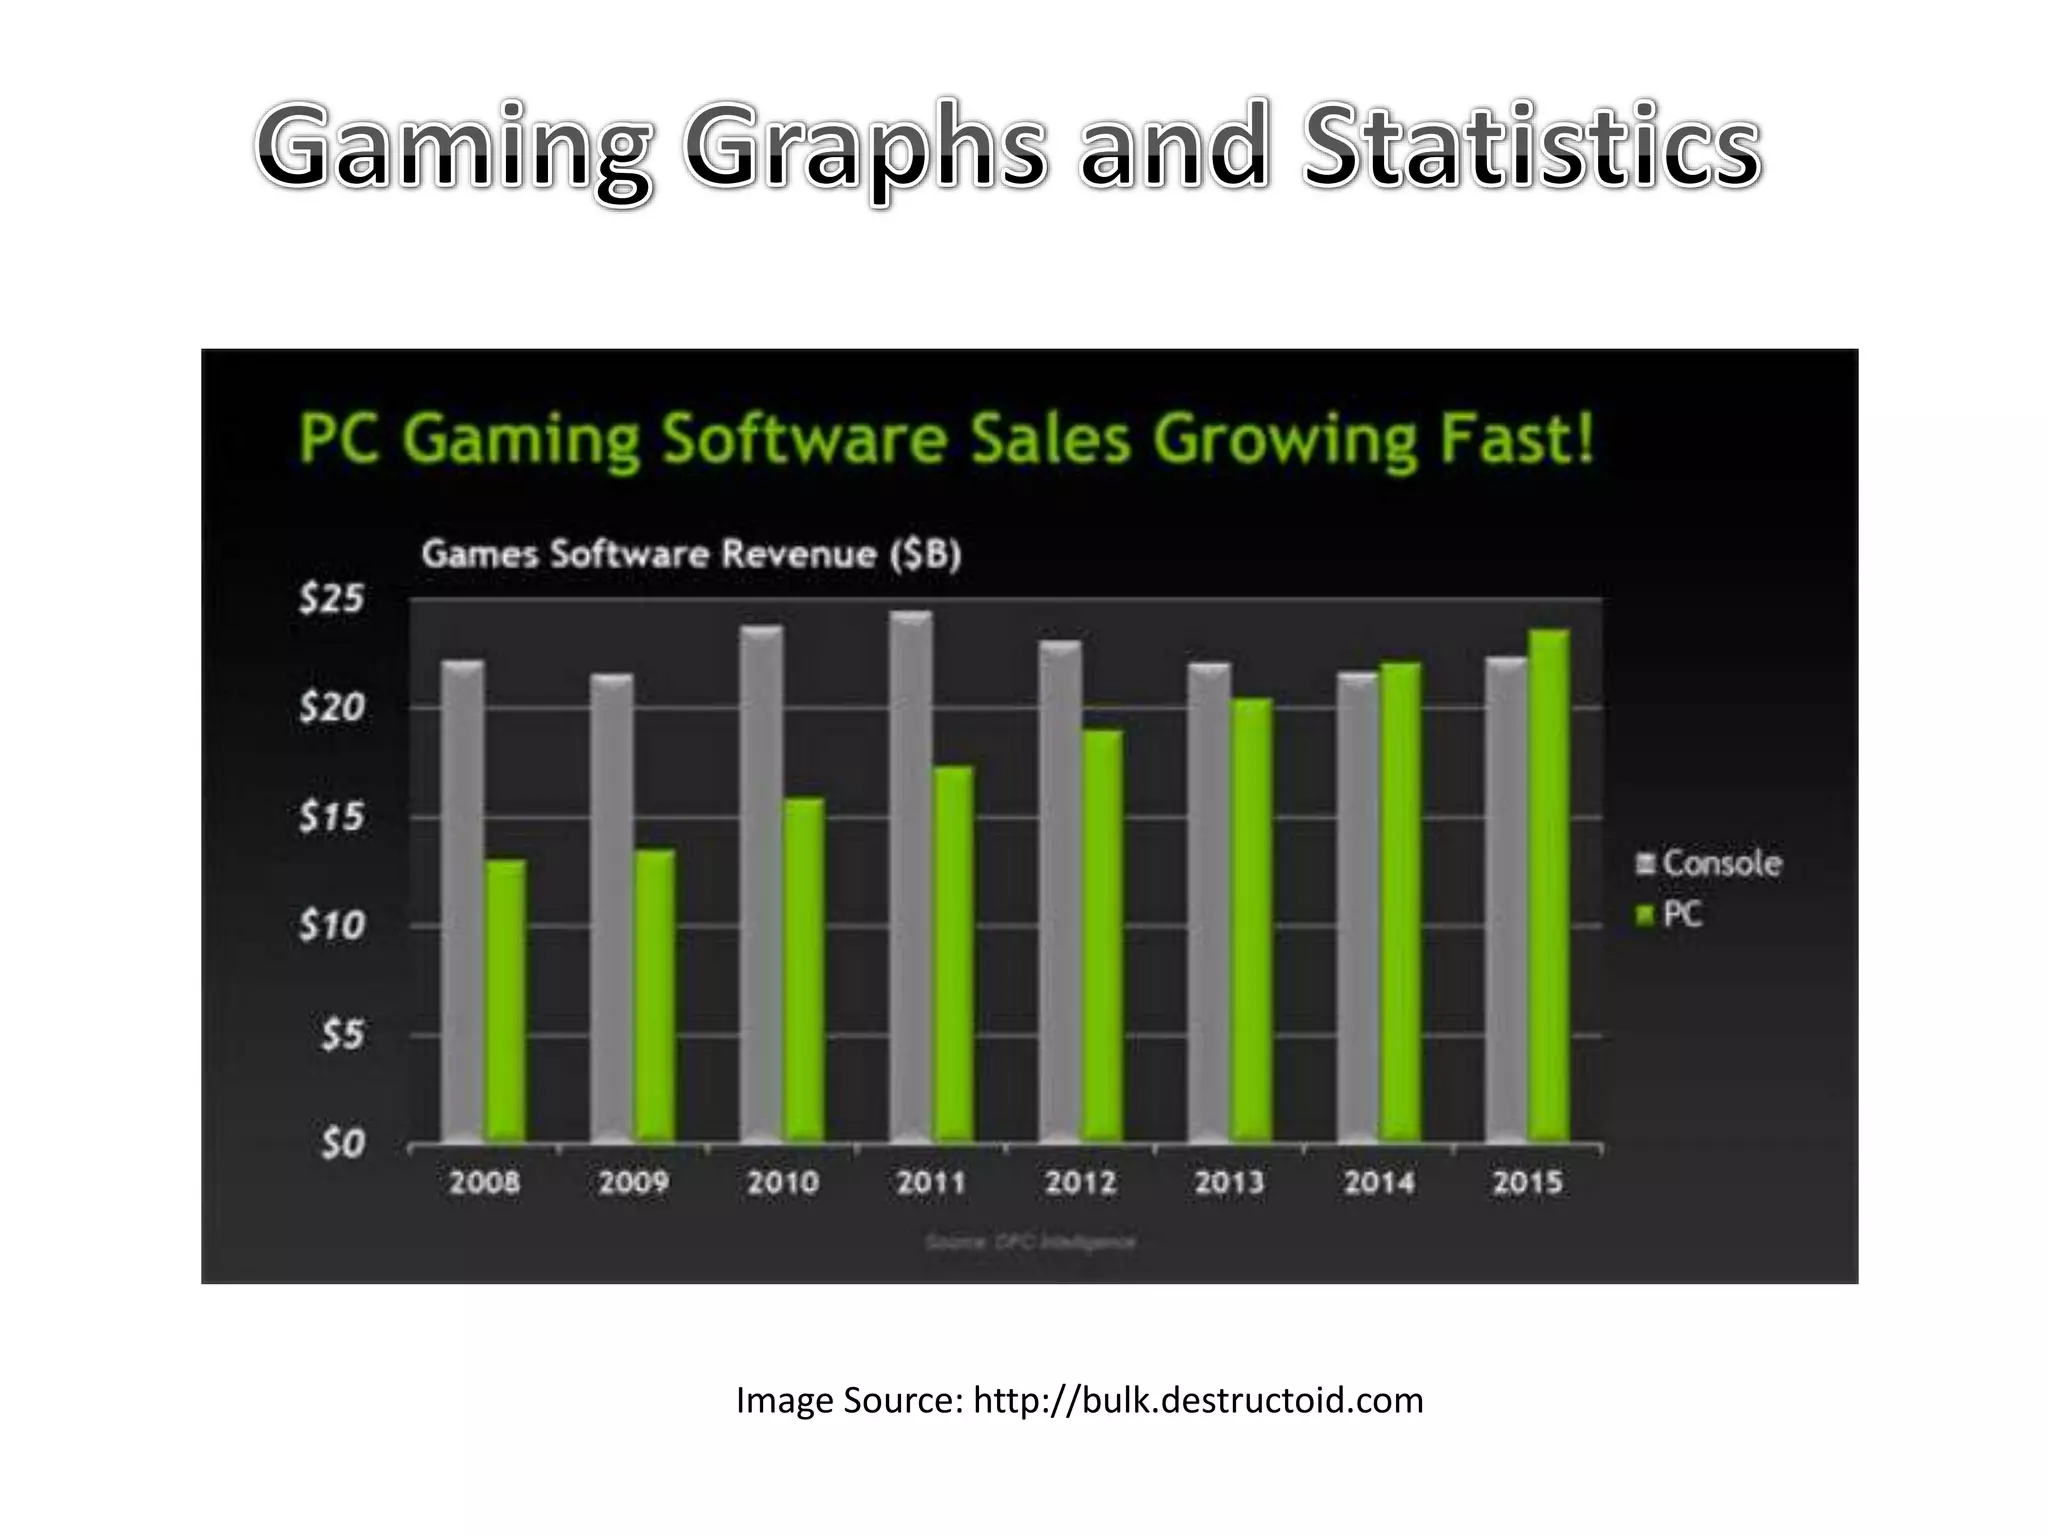
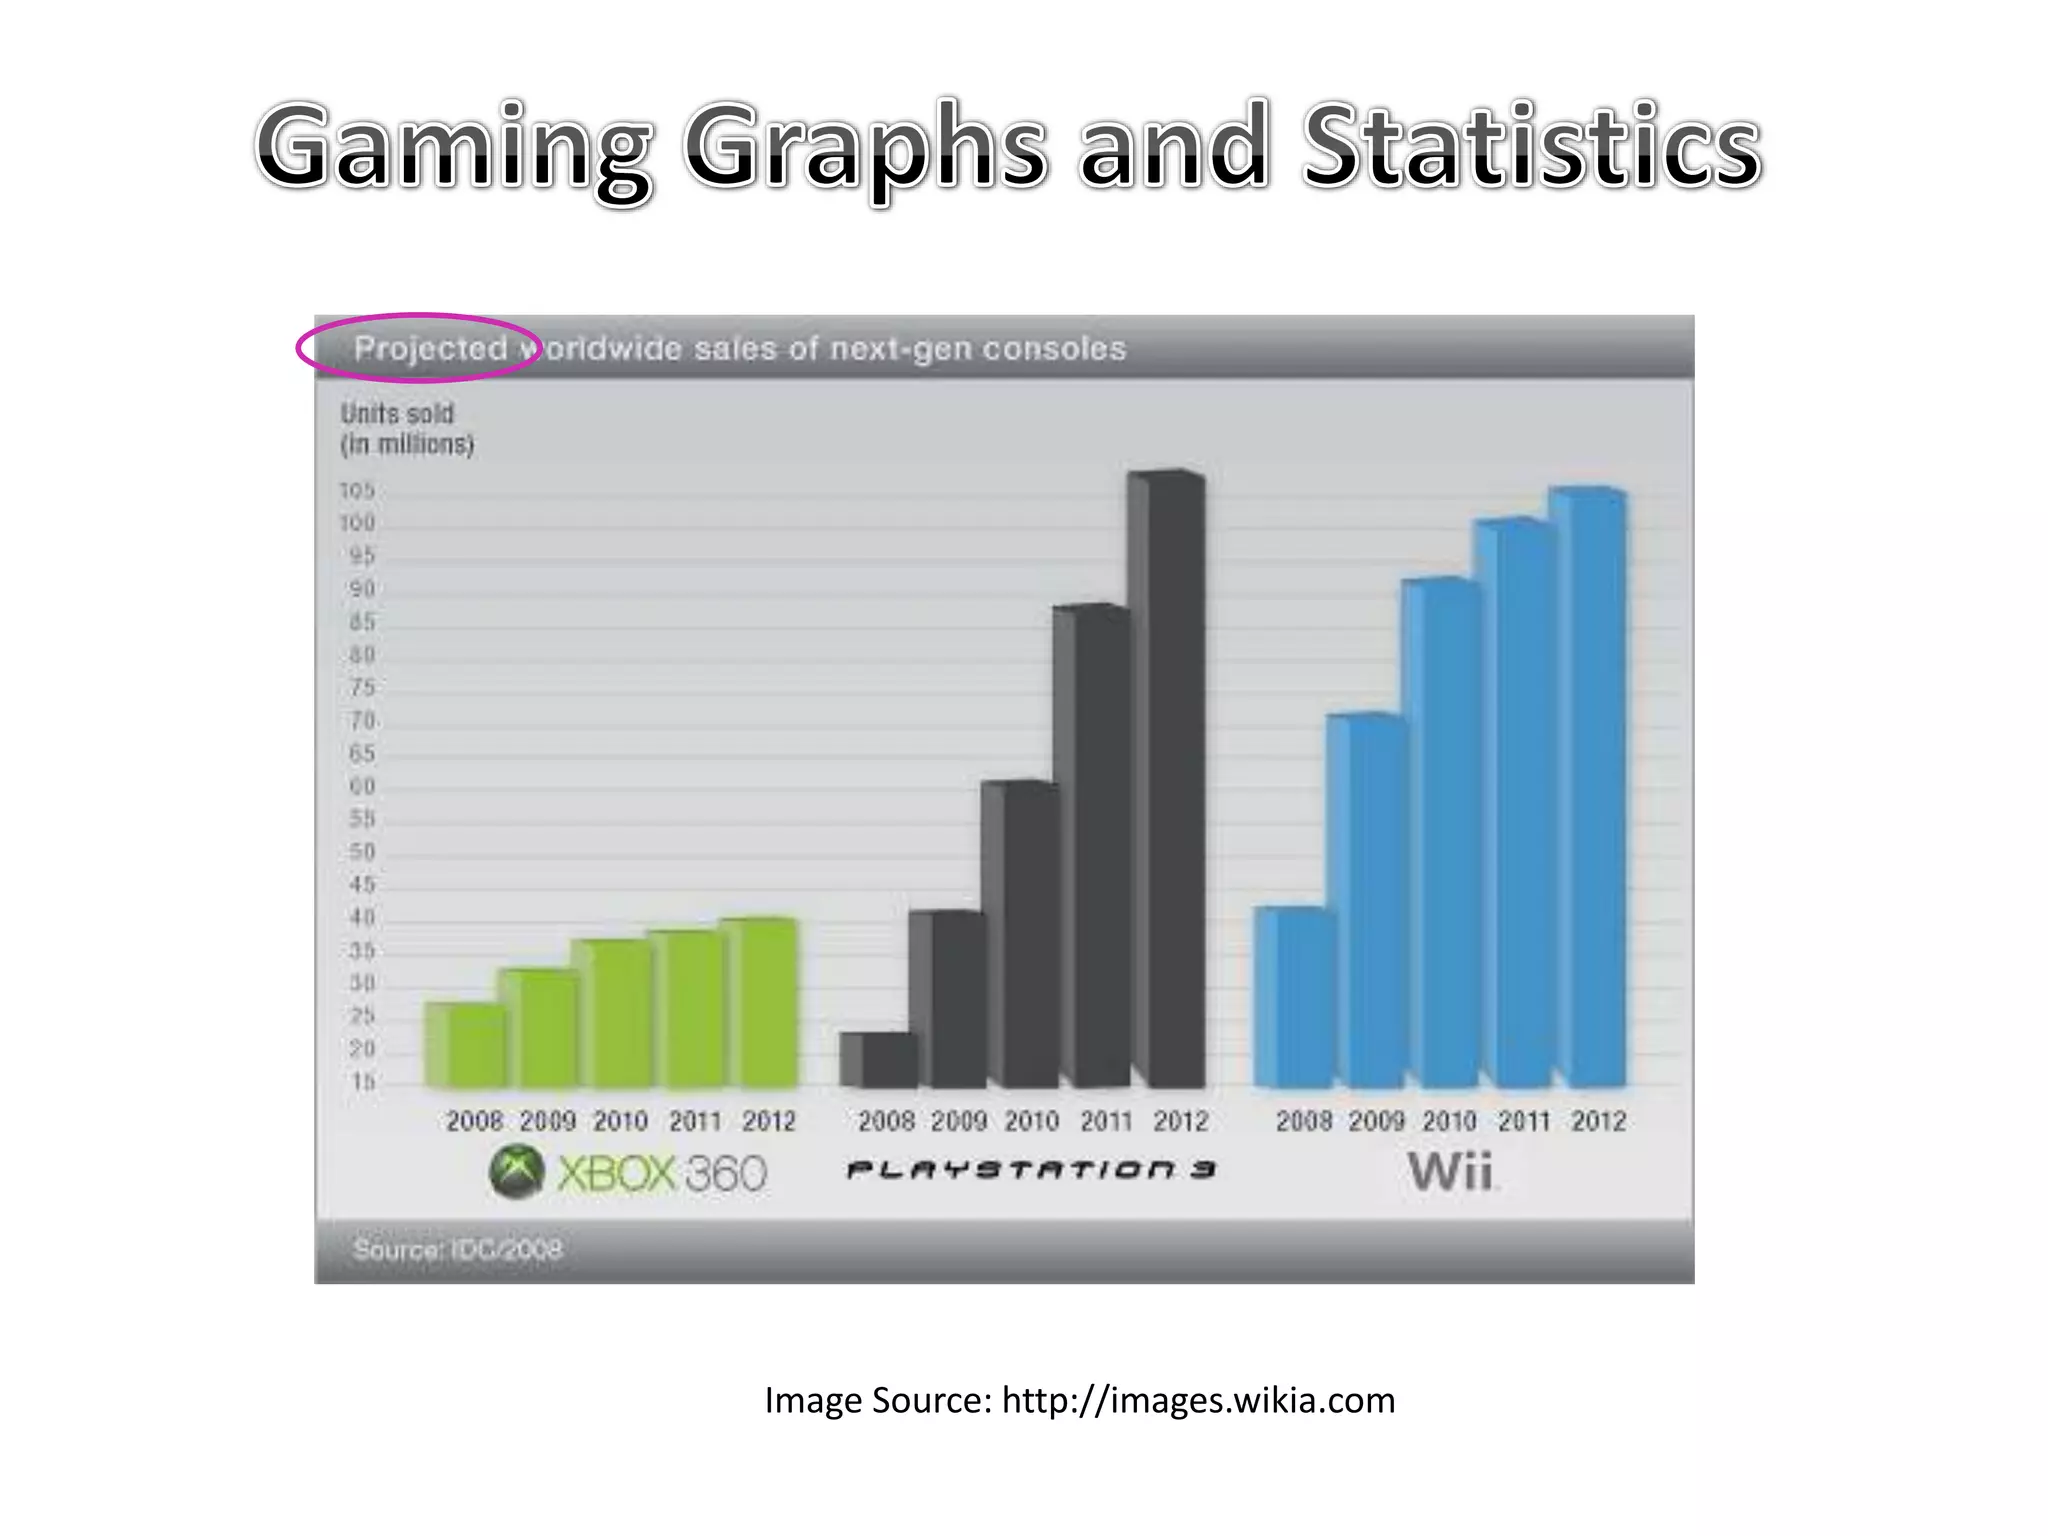
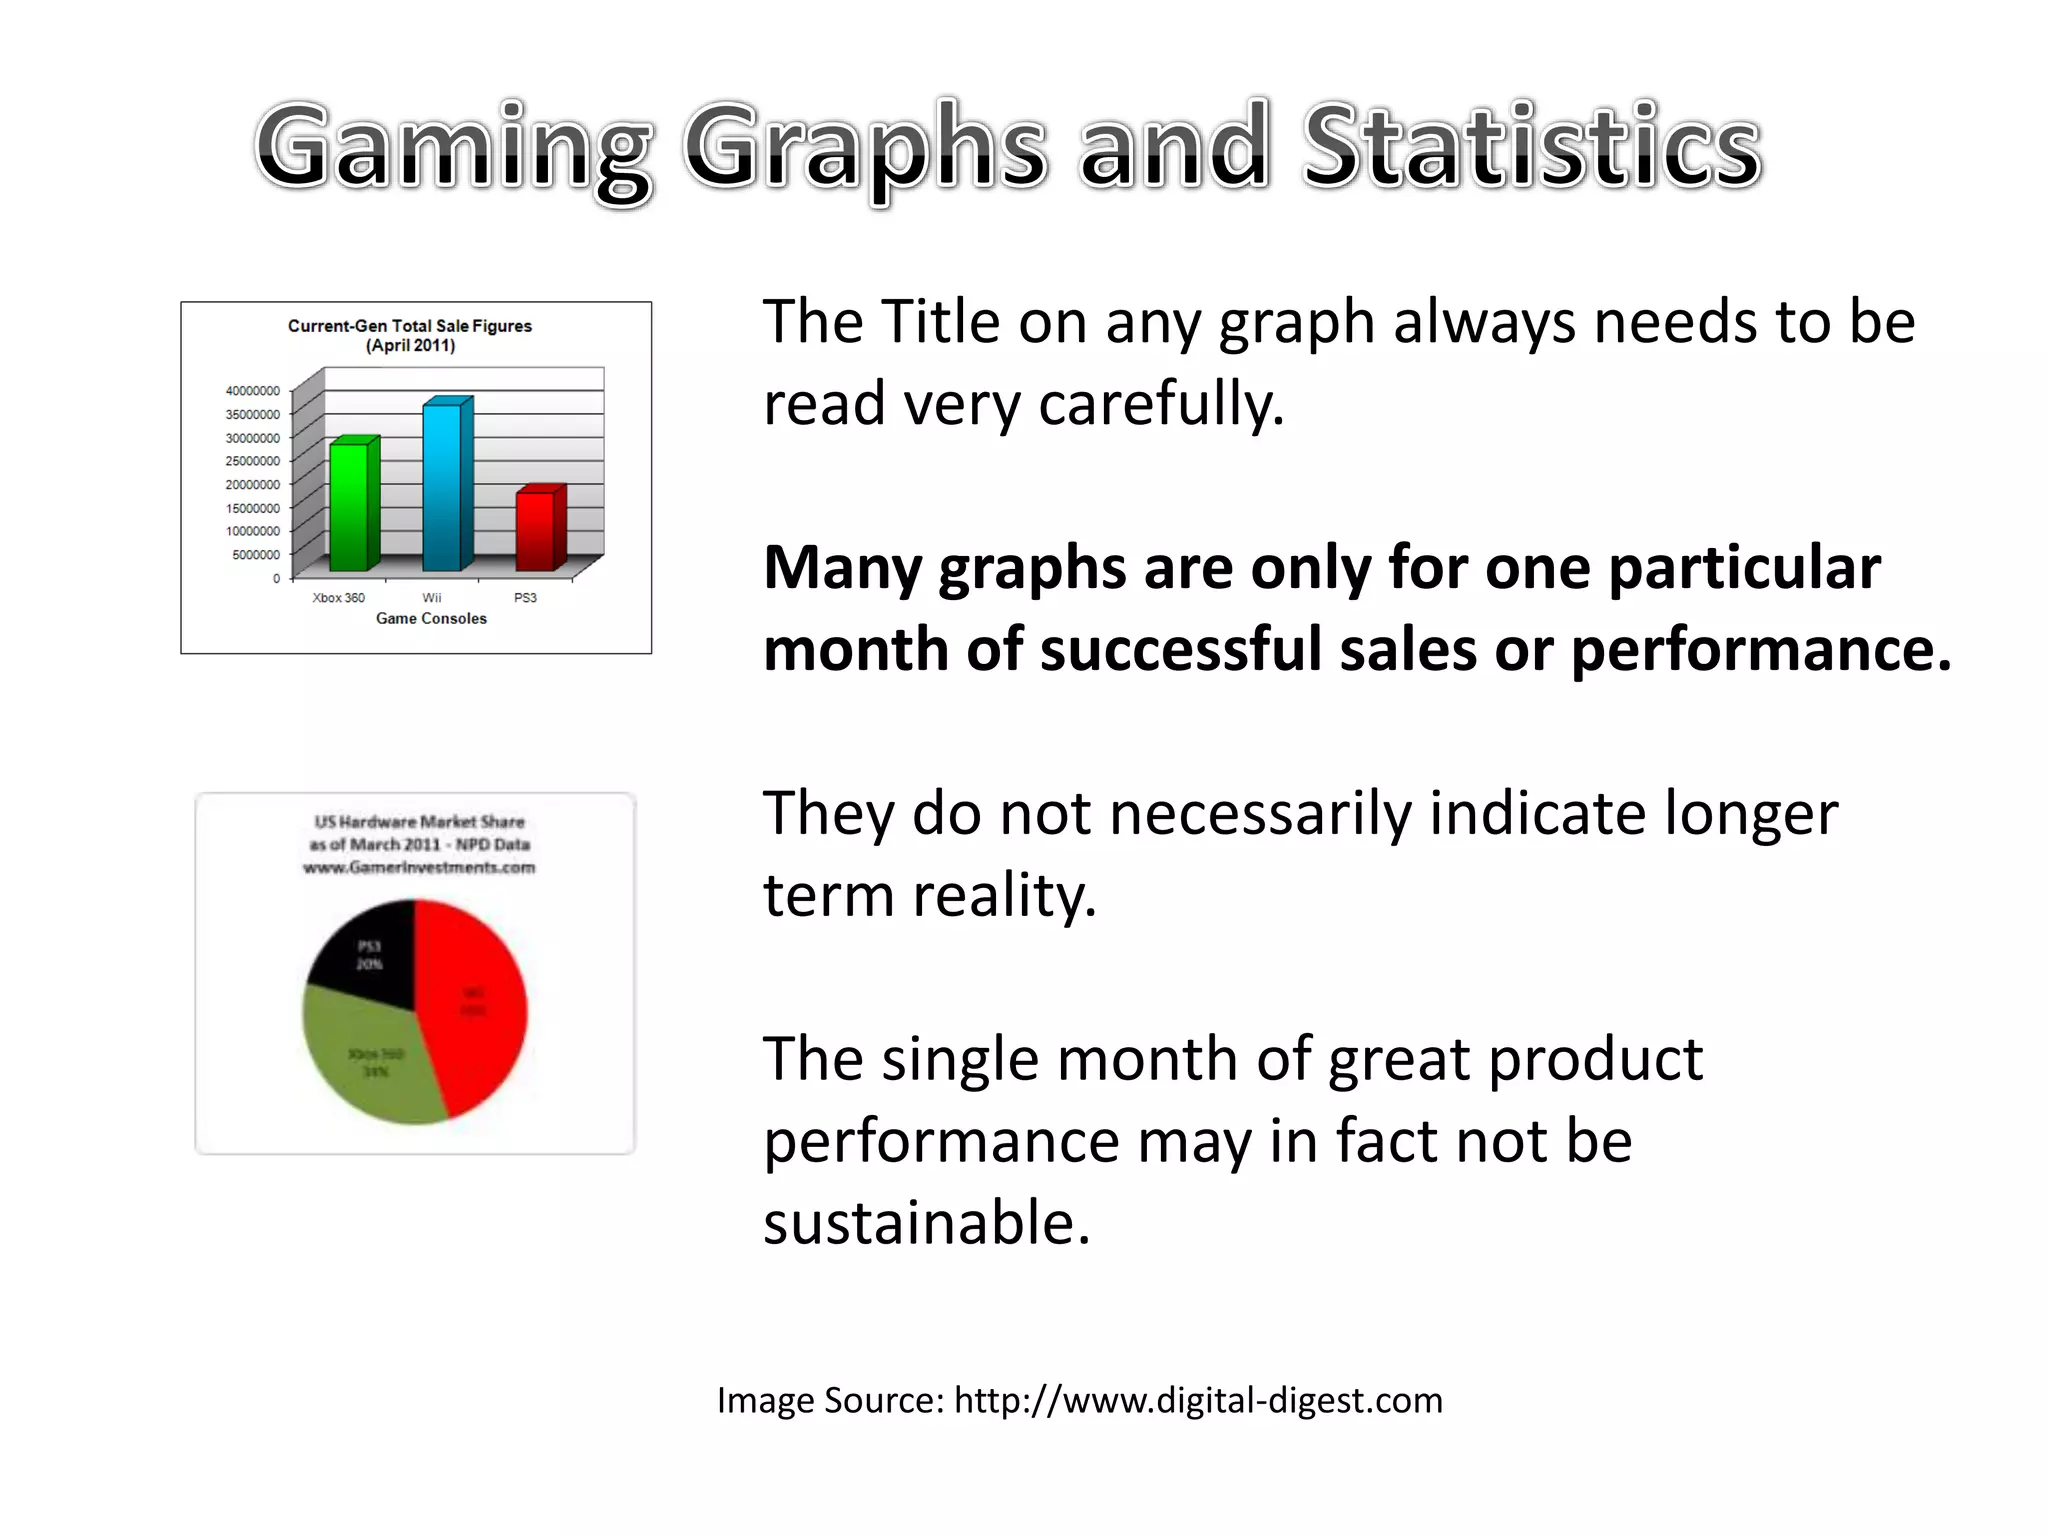
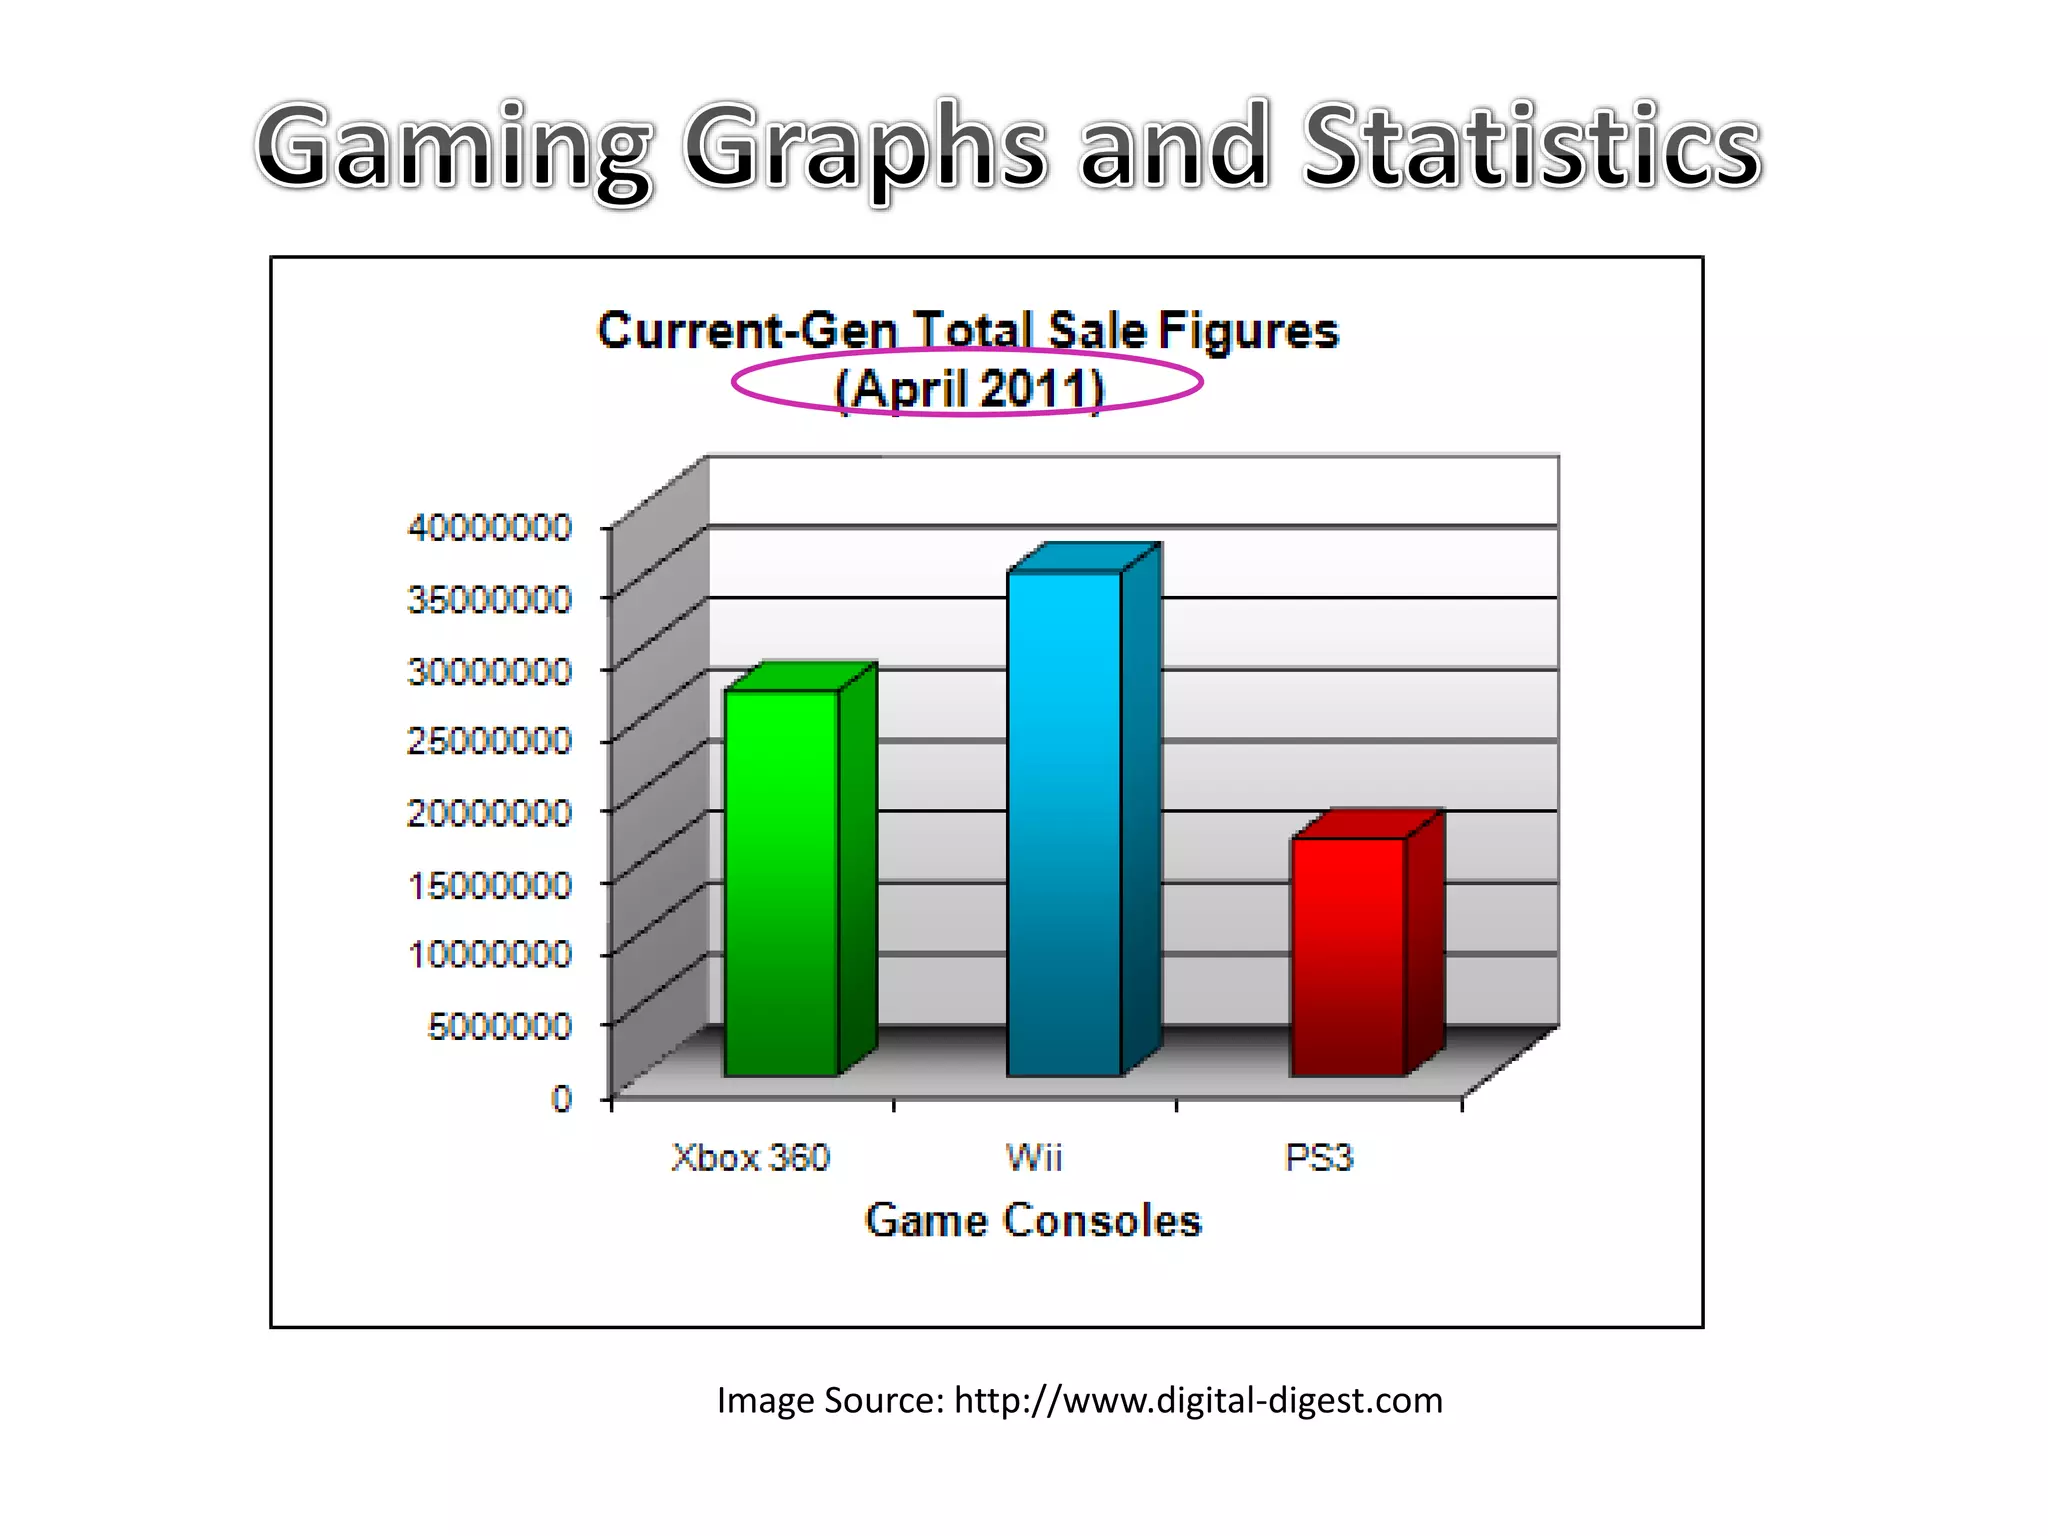
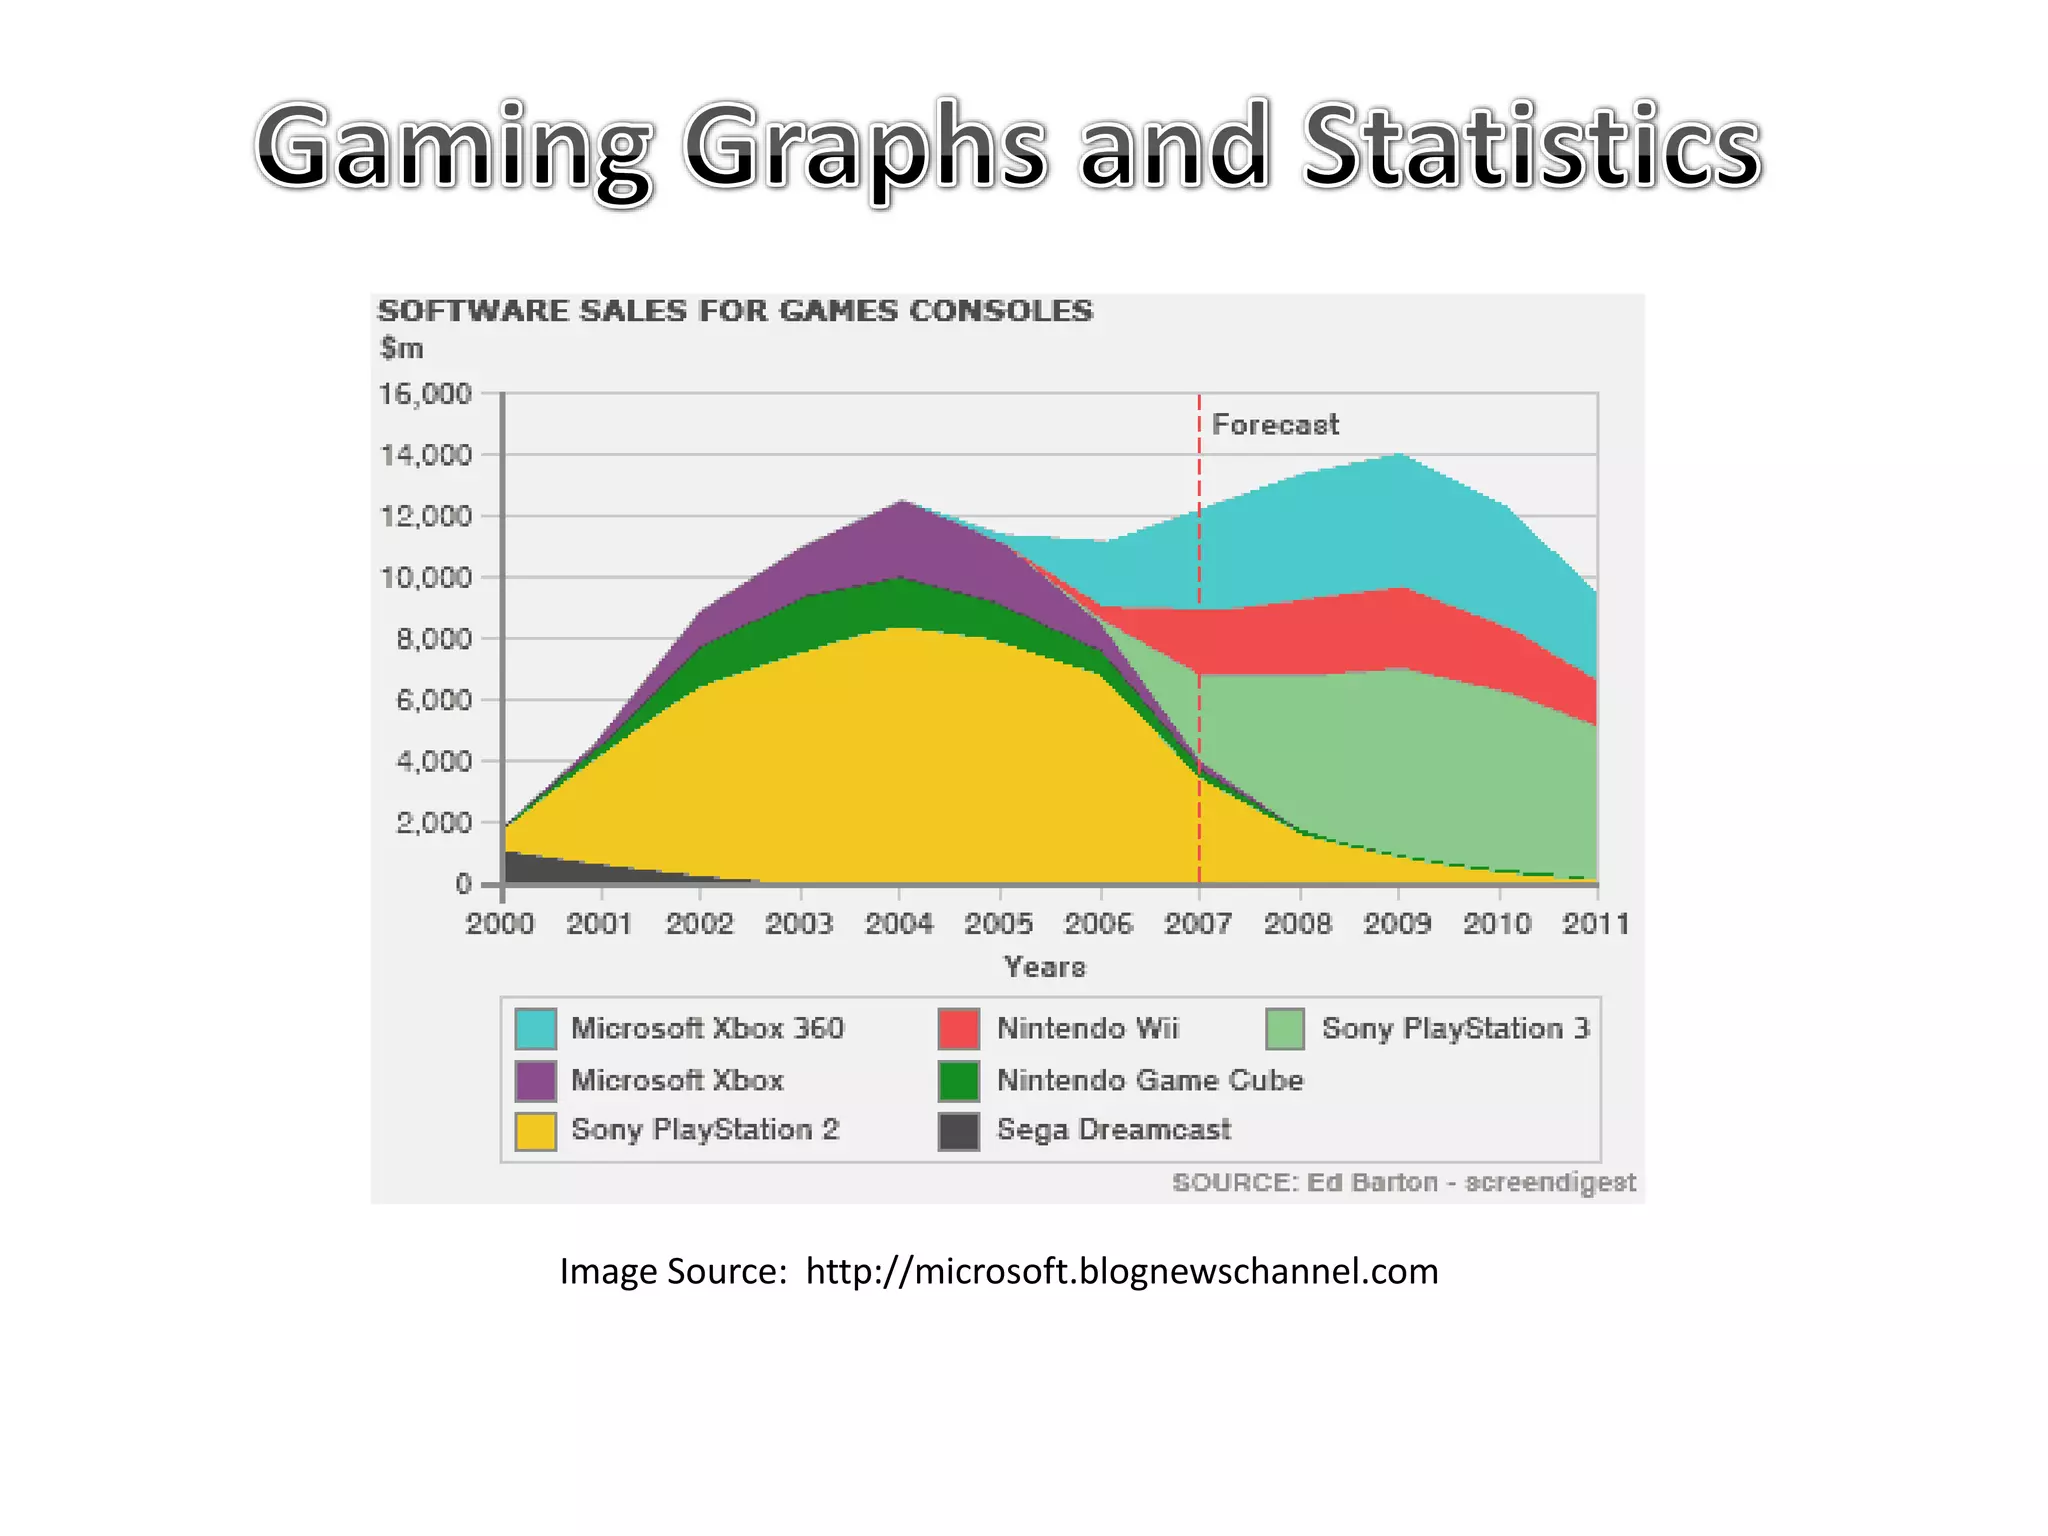
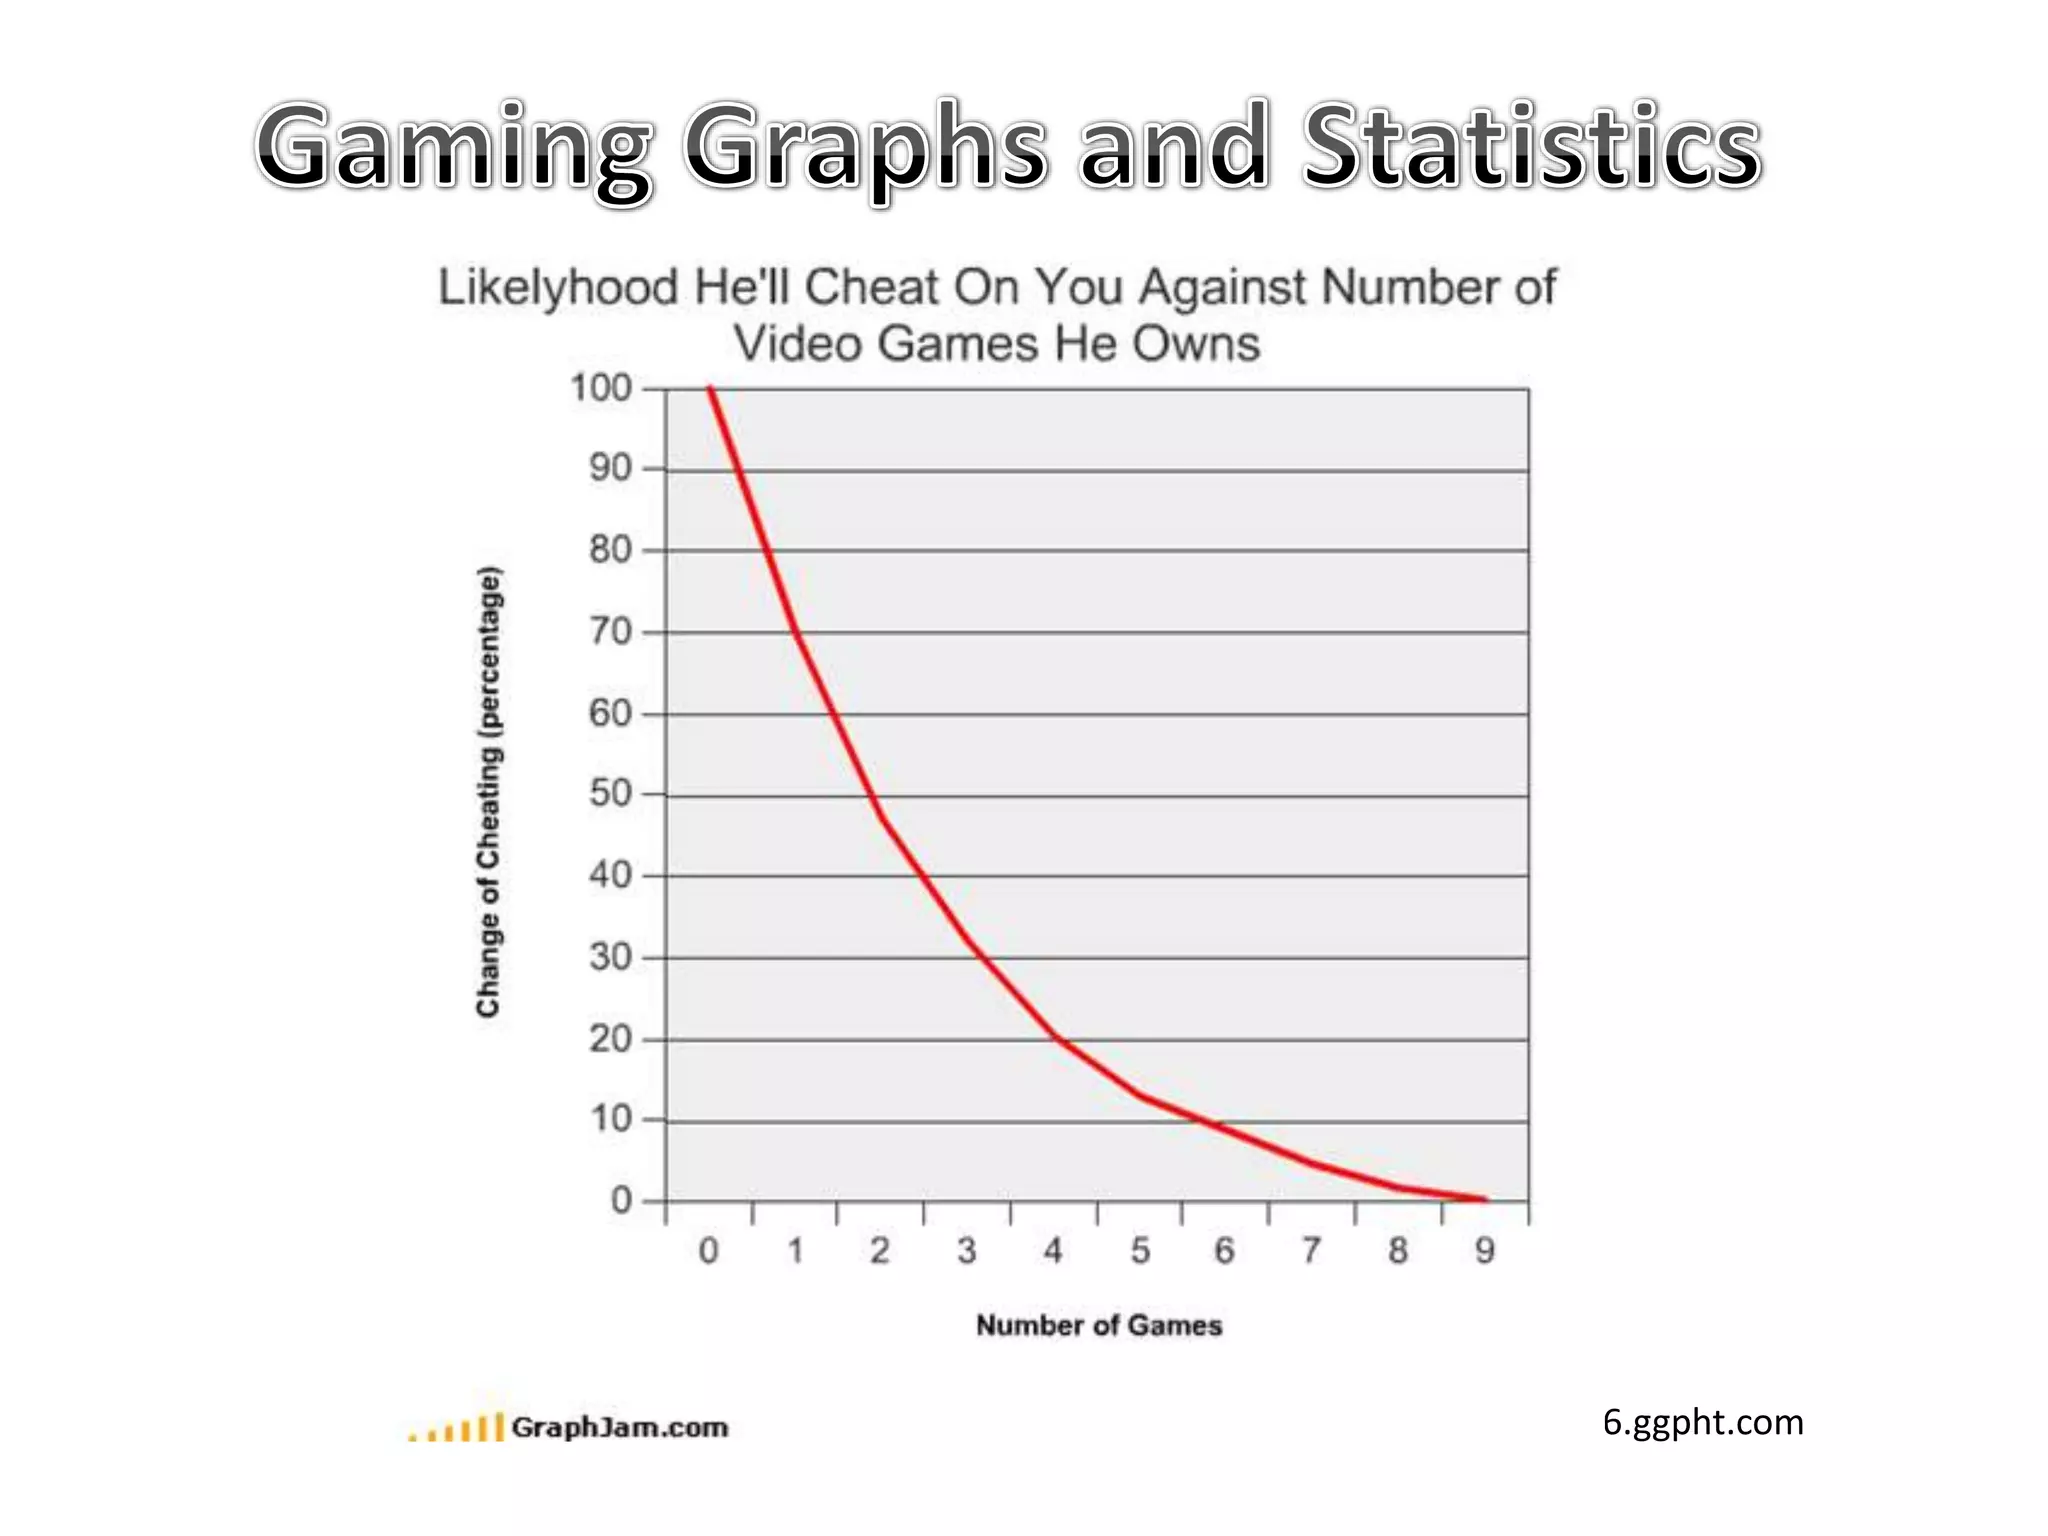
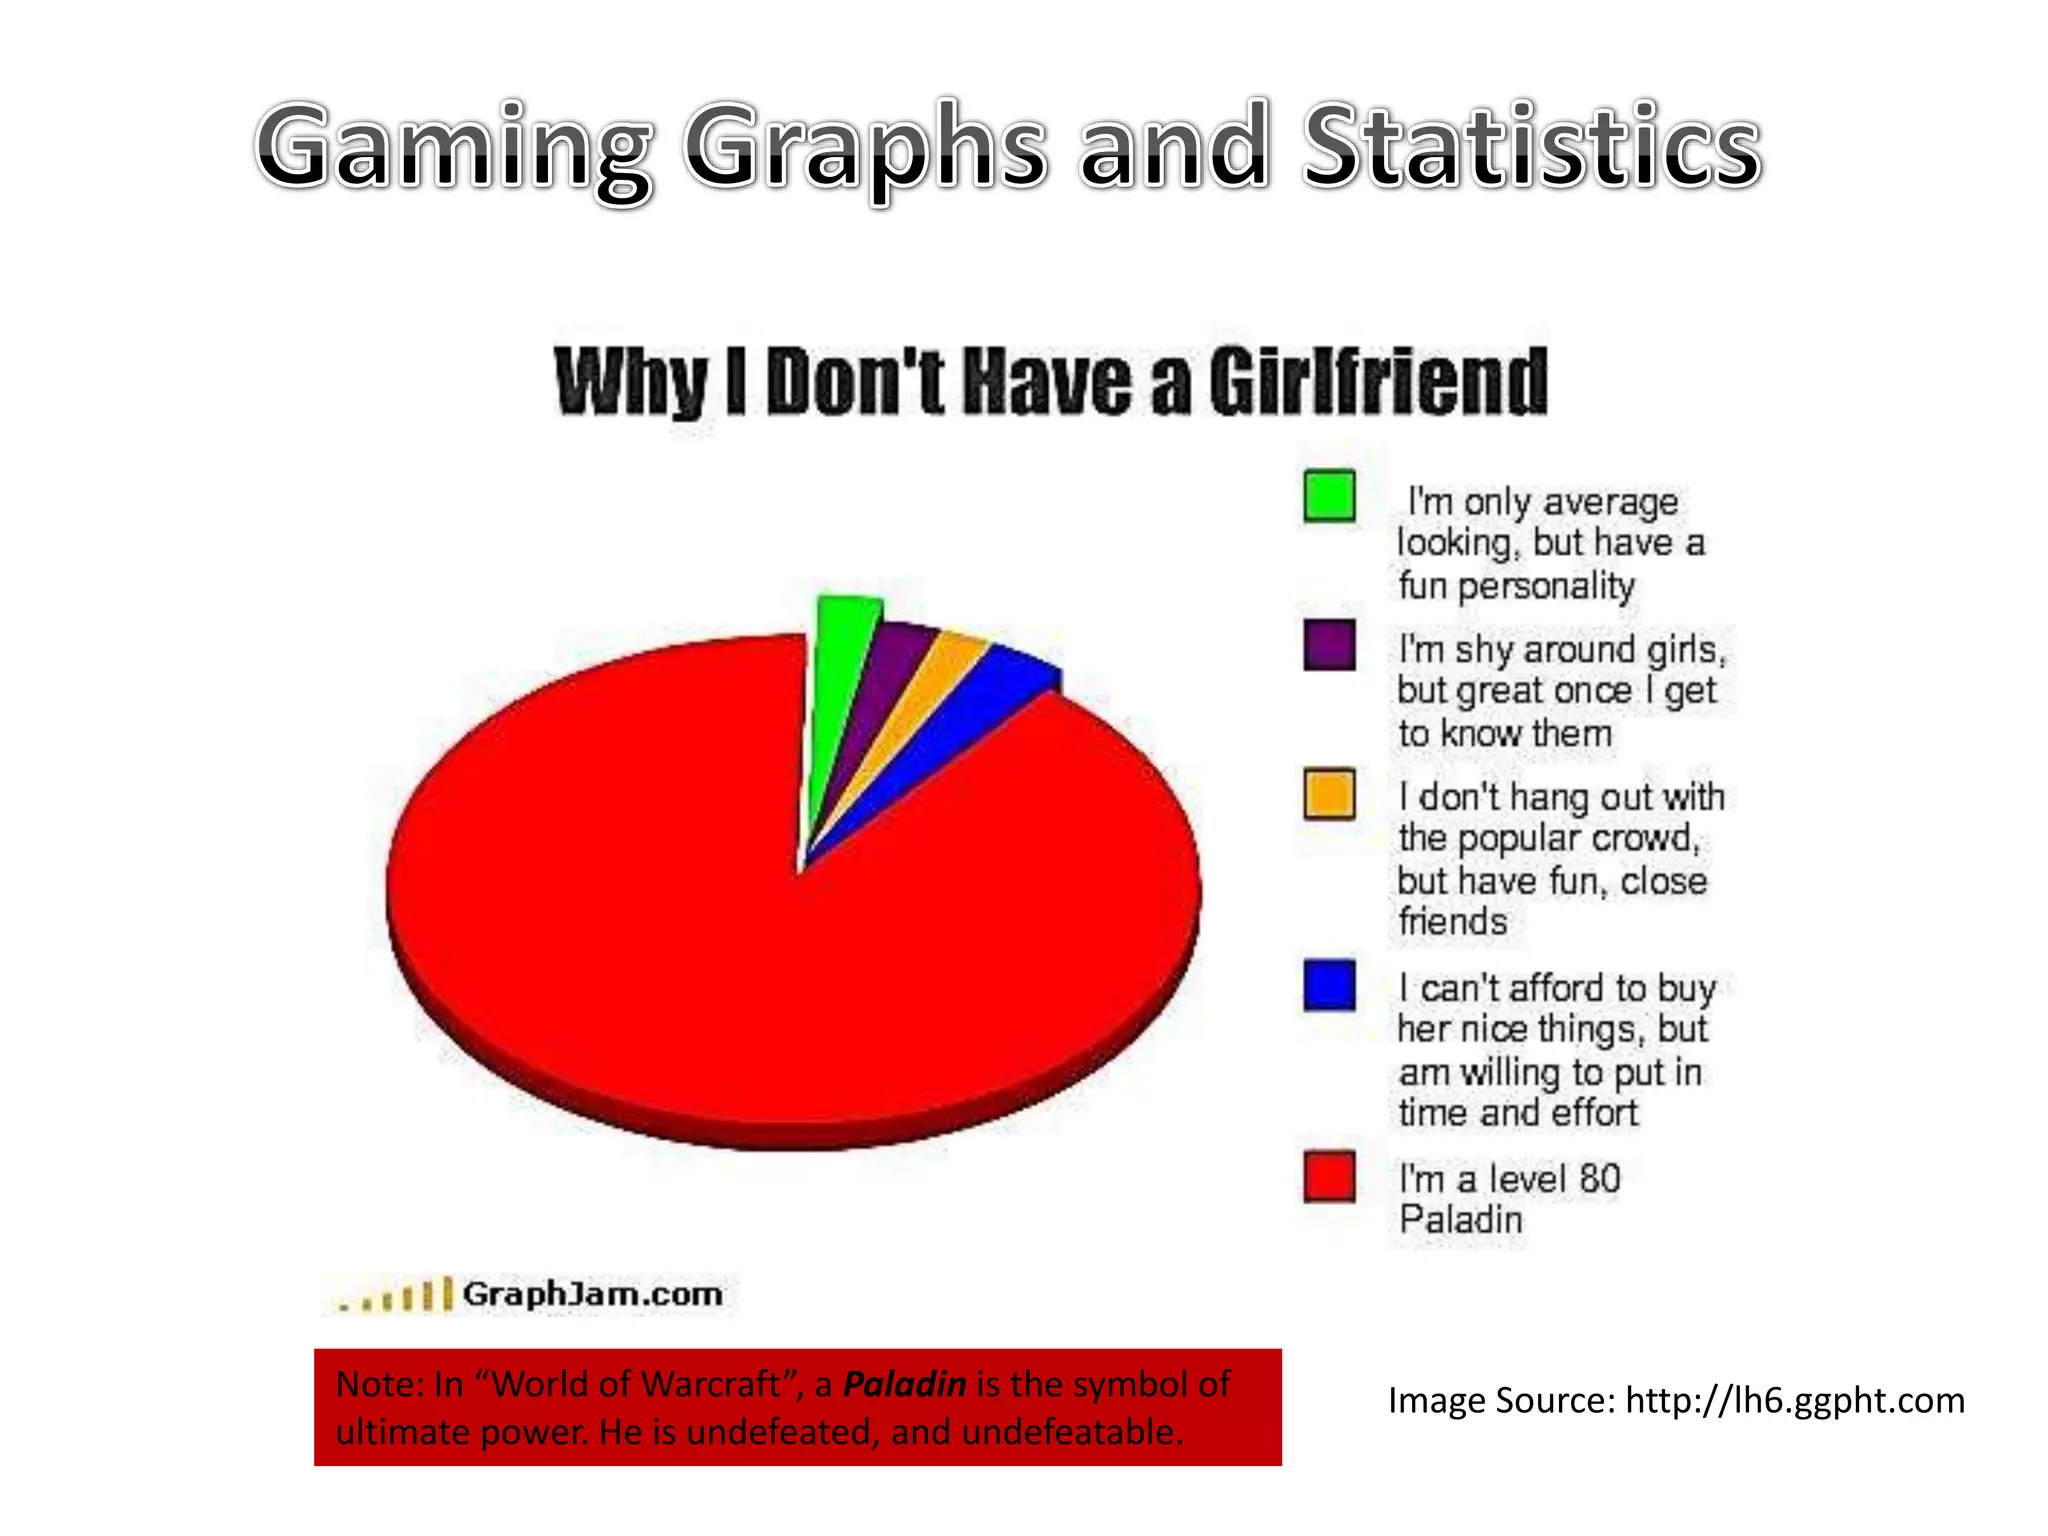
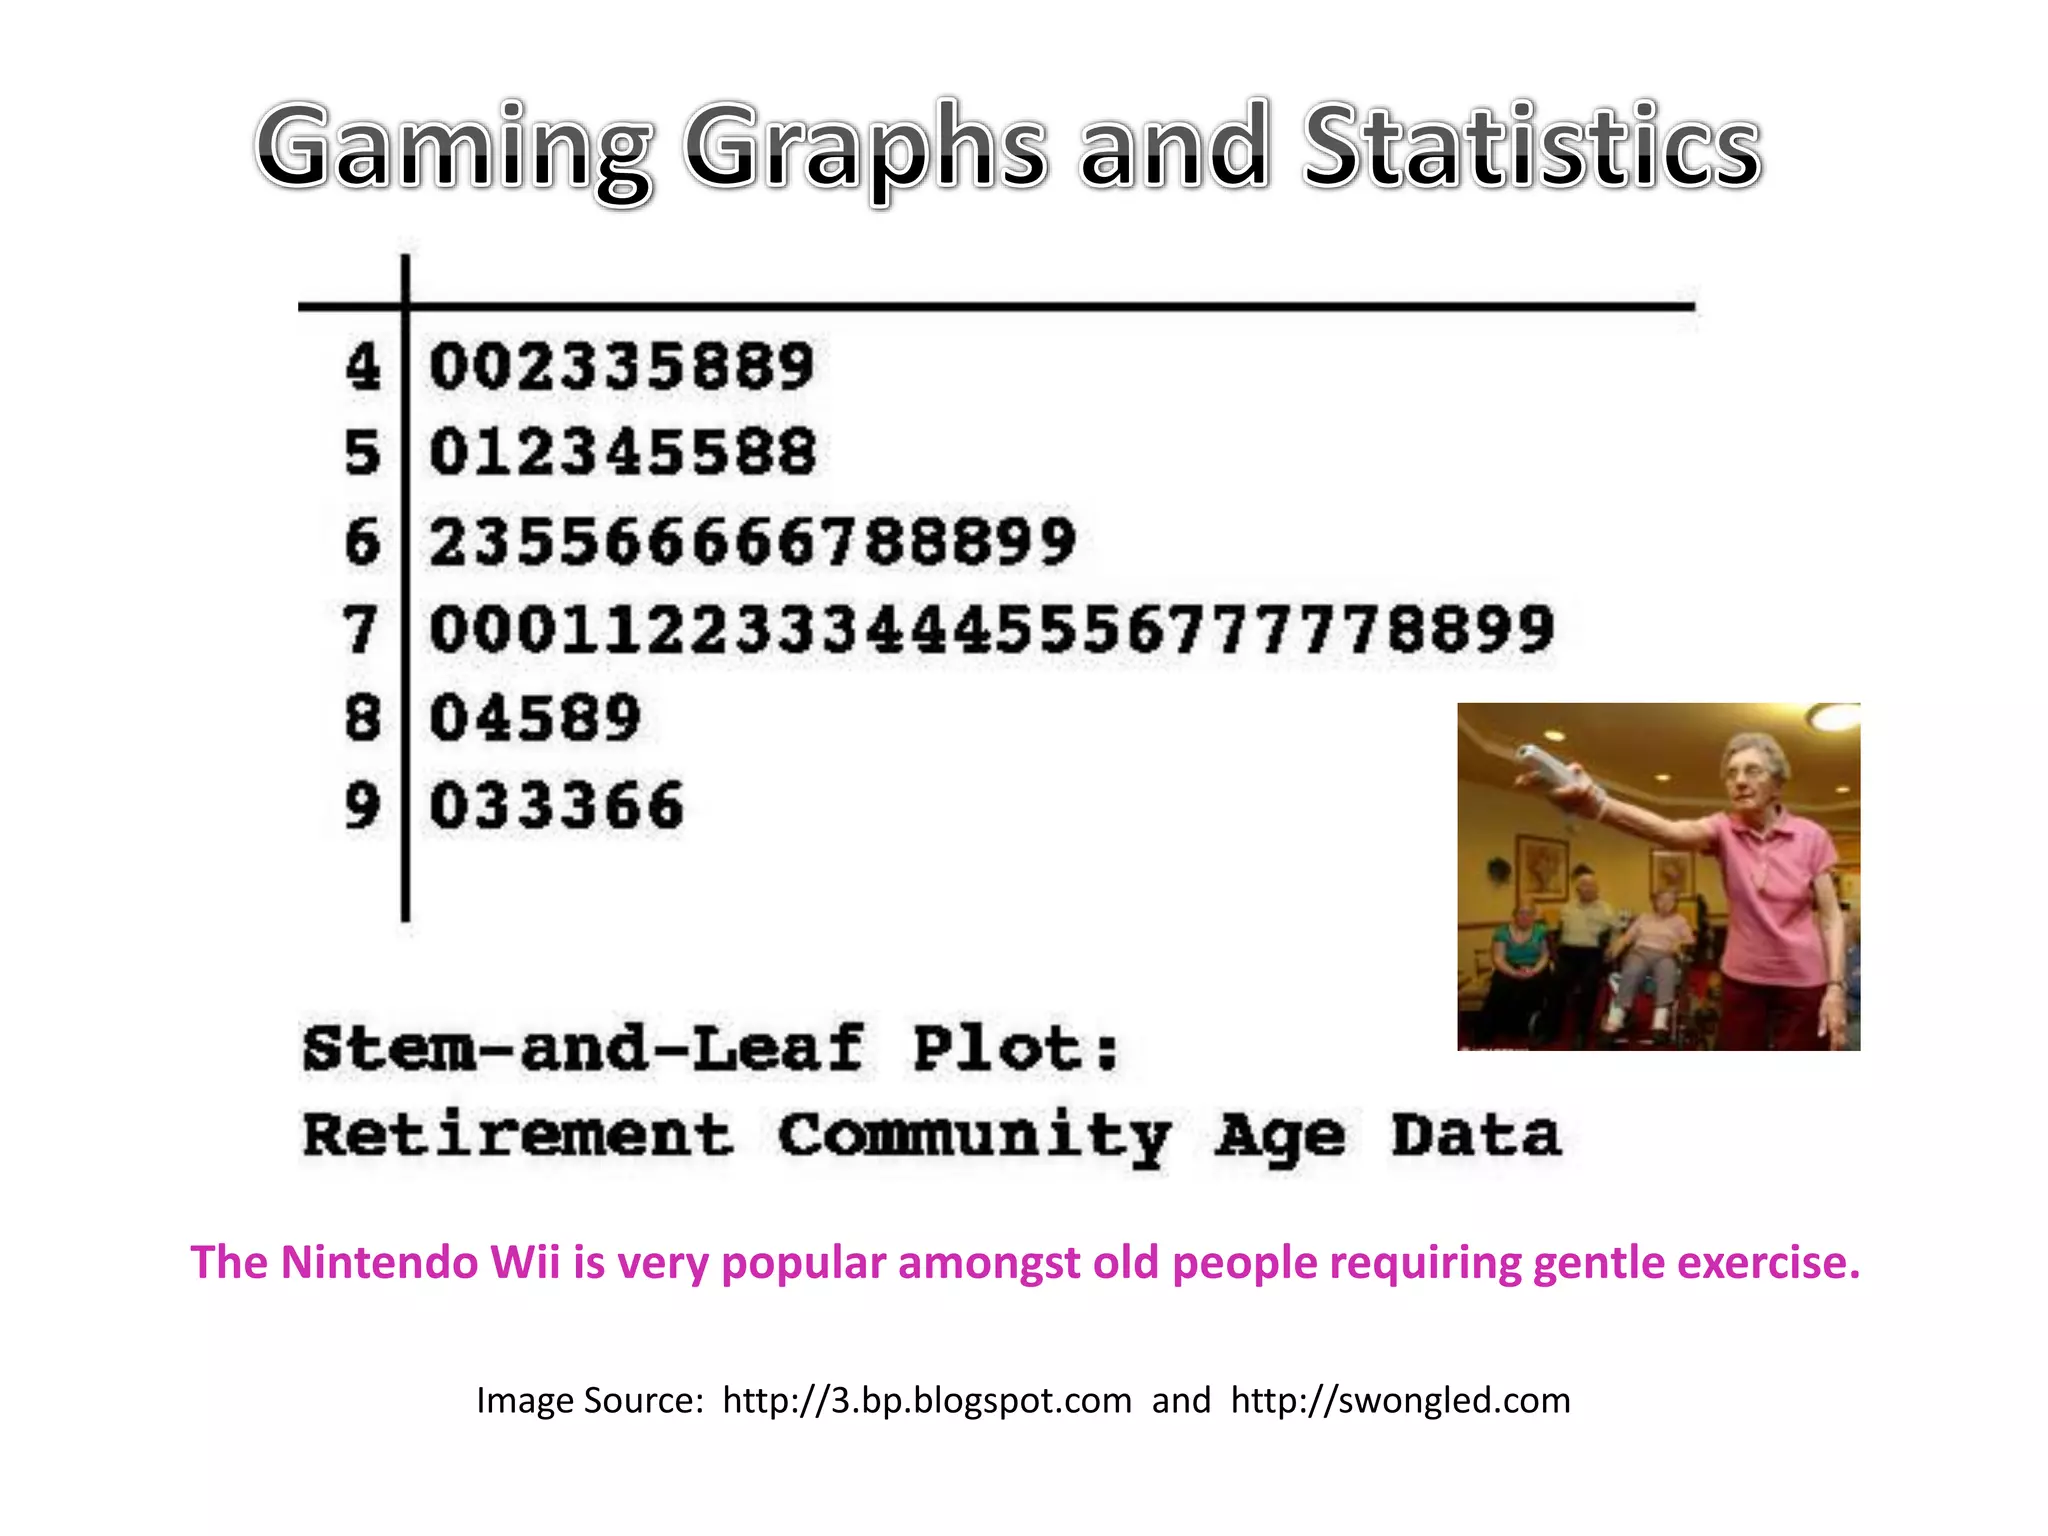


The document is a collection of slides about graphs and charts related to the gaming industry. It includes various types of graphs like column graphs, bar charts, line graphs and pie charts that have been used to represent sales and market share data for gaming equipment manufacturers. It discusses how titles, labels and timeframes represented in graphs need to be carefully examined, as some graphs show projected or forecasted values rather than actual historical performance. It also notes that certain types of graphs like stem-and-leaf plots are hardly ever used for gaming industry data visualization.