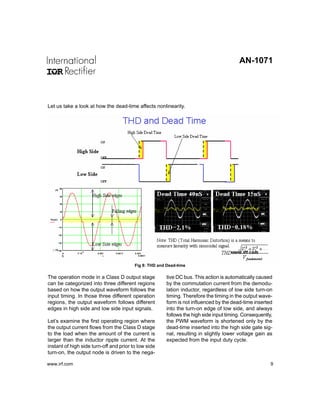
A Class D audio amplifier uses pulse-width modulation (PWM) to amplify audio signals with high efficiency of around 90-95%. It works by comparing an audio input signal to a high-frequency triangle wave, generating a PWM signal that drives an output stage. A low-pass filter then removes the high-frequency components, leaving the amplified audio signal. While more efficient than linear amplifiers, Class D amplifiers can have imperfections like dead time between switch transitions that introduce distortion. Dead time as small as tens of nanoseconds can generate over 1% total harmonic distortion. Proper timing of gate signals is important for low distortion.
This document discusses different classes of power amplifiers, including class A, class B, class AB, and push-pull amplifiers. It provides details on the operating principles, biasing, power efficiency, and output characteristics of each type. Key points include: Class A amplifiers have output current flowing for the full input cycle, leading to low efficiency. Class B amplifiers only conduct for half the input cycle. Class AB provides a small amount of bias to increase conduction. Push-pull amplifiers use two transistors connected out of phase to increase power and gain.
The document summarizes the operation of a class-D amplifier. It describes how class-D amplifiers use transistors as switches that are either fully on or fully off to achieve high efficiency. A comparator compares an audio signal to a high frequency triangle wave to generate a pulse width modulated square wave. A passive filter converts this into an analog output. Class-D amplifiers can be operated in a bridged configuration to increase output power without increasing voltage. Negative feedback is also used to improve performance.
The document discusses types of amplitude modulation including double sideband amplitude modulation (DSB-AM), double sideband suppressed carrier (DSBSC), double sideband reduced carrier (DSBRC), and single sideband modulation. It also discusses power in amplitude modulation and how only 33% of total power transmitted contains useful information. Modulation index is defined as a measurement of how much a carrier wave is modulated by another signal.
- Class A amplifiers have high voltage gain but low efficiency, as the output transistor constantly conducts current even without an input signal.
- Class B amplifiers improve efficiency by using two transistors in a push-pull configuration, but suffer from crossover distortion as both transistors are briefly off at the same time during signal transitions.
- Class AB amplifiers reduce crossover distortion by applying a small bias voltage, so the transistors conduct slightly more than half of each cycle and efficiency is improved over Class A while minimizing distortion.
The document discusses different classes of amplifiers - A, B, AB, C, D, and E - based on their conduction angle.
Class A amplifiers have a conduction angle of 360 degrees, meaning the amplifying device remains on all the time. They are simple but very inefficient. Class B amplifiers have a conduction angle of 180 degrees and use two devices in a push-pull configuration to amplify opposite halves of the signal cycle, improving efficiency but introducing crossover distortion. Class AB amplifiers operate between class A and B to reduce crossover distortion. The document provides details on the characteristics and applications of different amplifier classes.
This document describes an experiment to analyze the frequency response characteristics of passive first-order low-pass and high-pass filters by plotting the gain and phase response of RC filter circuits. The objectives are to determine the cutoff frequency and roll-off points of the filters by varying the resistor and capacitor component values and observing how this affects the frequency response. The results show that changing the resistor or capacitor values changes the cutoff frequency as expected, while maintaining a roll-off of approximately 20dB per decade above/below cutoff for the low-pass and high-pass filters respectively.
This document describes an experiment to characterize active band-pass and band-stop filters. The experiment involves plotting the gain-frequency response curves for each filter using an oscilloscope and function generator. Key measurements are taken from the plots to determine the center frequency, bandwidth, voltage gain, and quality factor for each filter and compare to theoretical values calculated from the circuit components. The results show good agreement between measured and calculated filter parameter values, validating the circuit designs.
The document discusses power amplifiers and related concepts. It explains that power amplifiers have both a DC load line and an AC load line. The DC load line determines the quiescent operating point (Q point) while the AC load line determines the maximum output swing. For optimal performance without clipping, the Q point should be located at the center of the AC load line. The maximum unclipped peak-to-peak output is determined by either the product of collector current and AC resistance, or collector-emitter voltage - whichever is smaller. Proper biasing of the amplifier, including adjustment of the emitter resistance, can be used to position the Q point optimally on the AC load line.
This document describes an experiment to characterize active low-pass and high-pass filters. The objectives were to determine the cutoff frequencies, gain-frequency responses, and roll-offs of second-order low-pass and high-pass filters. The experiments involved plotting the gain-frequency and phase-frequency responses of the filters using a function generator, oscilloscope, and op-amps. The measured cutoff frequencies and roll-offs matched the expected values based on the circuit components. However, when higher frequencies approached the op-amp's bandwidth limit, the high-pass filter response became band-pass-like due to the active element limitation. In conclusion, active filters are suitable for low-frequency applications where the op-
The document summarizes an experiment on characterizing a class A power amplifier. Key steps include:
1) Determining the operating point (Q-point) on the DC load line. 2) Drawing the AC load line and ensuring the Q-point is centered. 3) Measuring the maximum undistorted output voltage and input voltage to calculate voltage gain. The measured gain is compared to theoretical calculations accounting for resistances. Unbypassed emitter resistance reduces gain and stability.
SIGNAL SPECTRA EXPERIMENT 1 - FINALS (for PULA)Sarah Krystelle
The document describes Experiment #1 on a class A power amplifier. It involves determining the operating point (Q-point) on the DC and AC load lines, measuring the voltage gain, maximum undistorted output, and efficiency. The student is to perform steps such as calculating voltages/currents, drawing load lines, measuring gain, and adjusting the emitter resistance to center the Q-point on the AC load line. Objectives include analyzing the amplifier's DC and AC characteristics, measuring linearity and maximum output before clipping occurs.
This document discusses different types of oscillators, including RC oscillators and LC oscillators. RC oscillators are useful for frequencies up to 1 MHz and include Wien bridge, phase-shift, and double T-filter oscillators. LC oscillators are better for higher frequencies above 1 MHz due to limitations of opamps. Specific oscillator circuits are described, including the Wien bridge configuration and conditions for oscillation. The Colpitts oscillator uses transistors for amplification at higher frequencies.
Freq response of CE and CC discrete circuitsJavaria Haseeb
The document discusses frequency response and how capacitors affect an amplifier's response. It notes that an ideal amplifier's gain should be independent of frequency, but in practice amplifiers only act linearly over a range of frequencies defined by lower (fL) and upper (fH) cut-off frequencies. Capacitors introduce poles that define these cut-off frequencies. The document examines how to determine which capacitors contribute to fL and fH by analyzing the circuit with different capacitor conditions. It also discusses the capacitive effects in transistors that contribute to the high-frequency response roll-off.
This document discusses power amplifiers classified as Class A amplifiers. It describes the basic operation of a Class A amplifier, in which the collector current is always nonzero, resulting in low maximum efficiency of 25%. It covers the DC and AC analyses of a basic common-emitter Class A amplifier and a transformer-coupled Class A amplifier. The transformer-coupled configuration allows for a higher theoretical maximum efficiency of 50% by keeping the operating point very close to the supply voltage. However, practical efficiencies are still typically less than 40% due to losses in the transformer.
The document describes experiments conducted to analyze the characteristics of active band-pass and band-stop filters. Specifically, it discusses plotting the gain-frequency response curves and determining the center frequency, bandwidth, quality factor, and phase shift for both types of filters. Sample computations are provided for an active band-pass filter to calculate the actual voltage gain, expected voltage gain, center frequency, quality factor, and percentage differences between measured and expected values. The objectives, theory, materials used, and procedures for the experiments are also outlined.
Power amplifiers are concerned with efficiency, maximum power capability, and impedance matching to the output device rather than small-signal factors like amplification, linearity, and gain. There are several classes of power amplifiers including Class A, B, AB, C, and D which differ based on the conduction angle of the output and location of the Q-point. Efficiency increases as the conduction angle decreases from Class A to Class B to Class C. Transformers can be used to improve efficiency and increase the output swing of Class A amplifiers. Push-pull configurations are used for Class B amplifiers to generate a full output cycle from two transistors.
Yes, this is what is expected for a two-pole filter. A two-pole filter rolls off at -40 dB per decade.
Step 8 Measure the phase angle at the cutoff frequency (fc) and record it on the curve
plot.
Phase angle at fc = -89.999°
Question: What was the expected phase angle at the cutoff frequency for a two-pole
filter?
The expected phase angle at the cutoff frequency for a two-pole filter is -90°.
High-Pass Active Filter
Step 9 Open circuit file FIG 3-2. Make sure that the Bode plotter settings are the
same as for the low-pass filter.
Step
Here are the steps to find the cutoff frequency:
1) The voltage gain is 3 dB down from the maximum gain at the cutoff frequency.
2) The maximum gain from Step 2 is 4.006 dB.
3) 4.006 dB - 3 dB = 1.006 dB
4) The point on the curve that is 1.006 dB down is the cutoff frequency.
Record this on the curve:
fc = 1.006 dB
fc = 10 kHz
Question: Is the calculated cutoff frequency (fc) in Step 6 equal to the expected cutoff
frequency based on the circuit component values? Explain.
No, the calculated cutoff frequency (10 kHz) in Step 6 is not
This document describes an experiment involving active low-pass and high-pass filters. The objectives are to: plot the gain-frequency response and determine the cutoff frequency of a second-order low-pass active filter; plot the gain-frequency response and determine the cutoff frequency of a second-order high-pass active filter; determine the roll-off in dB per decade for a second-order filter; and plot the phase-frequency response of a second-order filter. The procedures involve using an op-amp, capacitors, and resistors to build second-order low-pass and high-pass Sallen-Key Butterworth filters. Key measurements and calculations are made to analyze the gain-frequency response and determine the cutoff
This document describes an experiment on passive low-pass and high-pass filters. The objectives are to analyze the gain-frequency and phase-frequency responses of first-order RC filters and determine how component values affect cutoff frequency. Low-pass and high-pass RC filters are modeled in simulation software. For both filters, the cutoff frequency, gain, and phase responses are measured from Bode plots and compared to theoretical values. The results show the cutoff frequency changes as expected when resistance or capacitance values are altered.
SIGNAL SPECTRA EXPERIMENT 1 - FINALS (for ABDON)Sarah Krystelle
The document describes Experiment #1 on a class A power amplifier. Key points:
1. The operating point (Q-point) of the amplifier was initially not centered on the AC load line, causing distortion. Adjusting the emitter resistor centered the Q-point.
2. With the centered Q-point, the maximum undistorted output voltage increased. The expected and measured output voltages matched closely.
3. A class A amplifier has low efficiency due to conduction over the full input cycle, but provides an undistorted output waveform.
The document contains contents and procedures for experiments in a communication lab manual, including building and testing second-order active filters (low-pass, high-pass, band-pass, and band-elimination), determining their frequency responses, and calculating their roll-offs. Tables are provided to record input and output voltages and gains at different frequencies to characterize the filters. Instructions ensure equipment is tested before experiments and guide building the filter circuits according to given specifications.
The document describes an experiment to analyze the frequency response of active low-pass and high-pass filters. Specifically, it examines second-order Butterworth filters using op-amps. The objectives are to determine cutoff frequencies, voltage gains, and roll-offs. The results show that the low-pass filter rolls off at -40 dB/decade above the cutoff as expected. Similarly, the high-pass filter rolls off at -40 dB/decade below the cutoff. However, at very high frequencies the high-pass filter response appears band-pass due to the op-amp's limited bandwidth. Overall, the experiment demonstrates that active filters provide advantages
This document discusses Fourier theory and how it can be used to represent non-sinusoidal signals as a combination of sinusoidal waves of different frequencies and amplitudes. It provides examples of how square waves and triangular waves can be produced by adding together sine and cosine waves. The document also discusses the difference between analyzing signals in the time domain versus the frequency domain and how these representations provide different insights. Finally, it discusses how Fourier analysis can be used to understand the bandwidth requirements to transmit digital pulses accurately.
Power amplifiers are classified based on their operating point or quiescent point (Q point). Class A amplifiers have their Q point at the center of the load line, resulting in linear but low efficiency operation. Class B amplifiers operate with their Q point at cutoff, providing high efficiency but distorted output. Class AB reduces distortion by adding some forward bias. Class D amplifiers switch between cutoff and saturation at a high frequency for very high efficiency operation suitable for audio.
This document provides an introduction to bipolar junction transistors (BJTs). It discusses that BJTs are made of two back-to-back p-n junctions and are three-layer devices consisting of either two n-type and one p-type layers or two p-type and one n-type layers. The document describes the formation and operation of p-n-p and n-p-n transistors. It discusses forward biasing of the emitter-base junction, the majority and minority carrier currents, and the different current components in BJTs. The document also covers the common-base, common-emitter, and common-collector configurations and their input and output characteristics.
SIGNAL SPECTRA EXPERIMENT 1 - FINALS (for CAUAN)Sarah Krystelle
This document describes an experiment conducted on a Class B push-pull power amplifier. The experiment involves determining the operating point on the DC and AC load lines, centering the operating point on the AC load line, measuring the voltage gain, maximum undistorted output power, and efficiency of the amplifier. Objectives of the experiment include locating the operating point, drawing load lines, measuring voltage gain, output power, and efficiency. Components used include a transistor, resistors, capacitors, a power supply, function generator, oscilloscope and multimeter. Calculations are shown for determining load lines, voltage gain, output power and efficiency. Results are recorded for undistorted output voltage and input voltage.
Concept Kit:PWM Buck Converter Average Model (NJM2309)Tsuyoshi Horigome
The document describes the design workflow for a step-down PWM converter using the NJM2309 controller IC. The key steps are:
1. Set the PWM controller parameters like reference voltage and switching frequency.
2. Select resistor values to set the output voltage.
3. Choose an inductor value based on the input/output voltages and ripple current criteria.
4. Select an output capacitor value and ESR based on voltage and ripple current criteria.
5. Stabilize the feedback loop using a Type 2 compensator whose component values (R2, C1, C2) are calculated using an Excel tool and simulation to meet a chosen crossover frequency and phase margin
This document is a seminar report on electromagnetic bombs (E-bombs) presented by Vinay Kumar. It discusses the technology behind E-bombs including explosively pumped flux compression generators, explosive and propellant driven magnetohydrodynamic generators, and high power microwave sources like the virtual cathode oscillator. It describes how E-bombs can cause electrical damage over large areas, outlines their targeting and delivery, and discusses limitations. The report provides an overview of the technical feasibility and military applications of conventional E-bombs.
CLASS D POWER AMPLIFIER FOR MEDICAL APPLICATIONieijjournal
This document describes the design of a 2.4 GHz class D power amplifier for medical applications using 0.18um CMOS technology. A two-stage class D power amplifier was designed that can transmit 15dBm of output power to a 50Ω load with 50% power added efficiency and total power consumption of 90.4 mW. Simulation results showed the amplifier was stable with an S11 of less than -10 dB and meets requirements for wireless medical sensor networks. The goal was to minimize trade-offs between performance, cost and power consumption for healthcare applications.
This document summarizes night vision technology. It discusses the history of night vision from WWII to modern times. It describes two main technologies used for night vision: thermal imaging and image enhancement. Image enhancement uses an image intensifier tube to collect and amplify infrared and visible light, producing a visible image. Night vision devices are categorized into generations based on technological improvements. Generation 3 is currently the standard and offers better resolution and sensitivity than earlier models.
A Comprehensive Study of Class D Amplifier TechnologyTodd Marco
This paper aims to provide a comprehensive technical overview of Class D audio amplifier operation and design. The fundamentals are presented with a focus on conceptual clarity rather than mathematical rigor. The main components of this technology, including modulation scheme, topology, and output stage, are discussed in detail. Important characteristics such as efficiency, distortion, and EMI are also thoroughly covered. Additionally, feedback control and robustness are discussed, and an effort is made throughout the paper to demonstrate the interconnections between the various aspects of Class D design.
This document is a certificate certifying that Malavika S completed a seminar presentation entitled "Wireless driven LED semiconductor lightning system". It includes an abstract summarizing her seminar report, which proposed a wireless power transfer system to drive LED lighting. The system would contain an LED lighting module, wireless power transfer system using either inductive or magnetic resonance coupling, an LED driving circuit, and an energy storage system. The report discussed the history and principles of wireless power transfer technologies.
This document discusses a new type of gated continuous wave (CW) radar that offers improvements over traditional gated CW radars. It operates using a pulsed transmit signal and gated receive path, along with a receiver bandwidth restricted to only the central frequency components of the received pulse spectrum. This new gated CW radar uses a Performance Network Analyzer in place of a vector network analyzer for higher data acquisition speeds and other enhancements. It provides better accuracy, circularity and lower cost than an equivalent pulsed intermediate frequency radar while maintaining the efficiency advantages of gated CW radars for indoor use.
The document discusses the working of touchscreen technology. It describes four main types of touchscreen technologies: resistive, capacitive, surface acoustic wave, and infrared. It provides details on resistive touchscreens, including four-wire, eight-wire, six-wire, and seven-wire variations. It also explains the basic components and working of a touchscreen, including the touch sensor, controller, and software driver.
seminar report on night vision technologyAmit Satyam
This document summarizes the history and technology behind night vision devices. It describes how early generations used multiple image intensifier tubes to amplify light, while later generations employed microchannel plates and gallium arsenide photocathodes to improve light sensitivity and gain. The document outlines the key technological advances between each generation, from Generation 0 devices that used infrared illumination to Generation 4's filmless and gated technology offering improved resolution and reduced noise in varying light conditions.
Night vision-technology-seminar-report-pdfpoovizhi g
Night vision technology allows one to see in low-light or no-light conditions through either thermal imaging or image enhancement. Thermal imaging detects infrared light emitted as heat from objects, while image enhancement collects available light including infrared and amplifies it using an image intensifier tube. Night vision has military and civilian applications and has advanced from Generation 1 to Generation 3 technology, improving light amplification, resolution, and operational lifespan. Key factors that impact night vision usage include textures, light levels, and reduced color detection compared to normal vision.
This document is a project report submitted by Vanhishikha Bhargava to fulfill requirements for a Bachelor of Technology degree. The report explores various topics related to optical fibers including the basics of fiber optics, fiber types, standards, connectors, losses, splitters, splicing, and wavelength division multiplexing. The report includes an index listing the various sections, introduction, acknowledgments, company profile, and conclusions. It was supervised by Mr. Vinod C.P from Advanced Fiber Systems Pvt. Ltd and submitted to the Department of Electronics and Communication at G.N.I.T. (Girls) GREATER NOIDA.
This document provides an overview of different classes of electronic amplifiers (A, AB, B, C, D, E, F, G, H) and their characteristics. Class A amplifiers have the highest sound quality but are the least efficient, as the output transistors conduct electricity for the entire input cycle. Class AB amplifiers are more efficient than Class A as they only conduct for more than half the cycle. Class B amplifiers use two output devices in a push-pull configuration to generate the full output cycle. Class D and E amplifiers are highly efficient switching amplifier designs. The document also discusses field effect transistors and includes circuit diagrams to illustrate the different classes.
This document discusses the four main classes of amplifiers used in audio equipment: Class A, Class B, Class AB, and Class D. Class A amplifiers are the most accurate but least efficient, conducting electricity continuously. Class B amplifiers use separate circuits for positive and negative halves of the signal. Class AB amplifiers combine aspects of Classes A and B. Class D amplifiers are very efficient but lower fidelity, rapidly switching transistors on and off. The classes balance factors like efficiency, accuracy, cost and heat dissipation.
This document discusses Class-D audio amplifiers and their advantages over traditional Class-A/AB designs. Class-D amplifiers are much more efficient due to their switching operation, which allows efficiencies over 90%. They require high switching speeds in the 100kHz-1MHz range. Pulse width modulation is commonly used to encode the audio signal in the duty cycle of the switching signal. Proper filtering is required to reconstruct the audio signal from the switching waveform. Common Class-D topologies include half-bridge and full-bridge configurations. Gate driving the output transistors and signal level shifting present design challenges that integrated driver ICs help address.
Power Amplifier circuits.
Output stages of types of power amplifier (class A, class B, class AB, class C, class D)
Distortions( Harmonic and Crossover).
Push-pull amplifier with and without transformer.
Complimentary symmetry and Quasi- complimentary symmetry push pull amplifier.
A voltage amplifier circuit is a circuit that amplifies the input voltage to a higher voltage. So, for example, if we input 1V into the circuit, we can get 10V as output if we set the circuit for a gain of 10. Voltage amplifiers, many times, are built with op amp circuits.
The document discusses different types of power amplifiers and their output stages. It begins by defining a power amplifier as a large signal amplifier that is generally the last stage of a multistage amplifier. Its purpose is to amplify a weak signal to a level that can operate an output device like a loudspeaker. The document then discusses different classes of output stages - Class A, B, C - based on the collector current waveform. It also covers topics like efficiency, distortion, and AC/DC load lines of power amplifiers.
1. Amplifiers are classified according to frequency capabilities, coupling methods, and use. They can be audio frequency amplifiers, radio frequency amplifiers, voltage amplifiers, or power amplifiers.
2. Voltage amplifiers aim to amplify input voltage with minimal current output, while power amplifiers amplify input power with minimal voltage change. Power amplifiers are needed for applications requiring high power loads.
3. Amplifiers also have different classes based on their operating point, including class A operated linearly over the entire cycle, and classes B and AB operated over more than 180 degrees but with higher efficiency. Class C amplifiers are used in radio frequency applications as they operate for less than 180 degrees with even
This document discusses power amplifiers and class A amplifiers. It describes how class A amplifiers have low efficiency since the collector current is always nonzero, even with no input signal. It then discusses transformer-coupled class A amplifiers, how they use a transformer to couple the output to the load, providing DC isolation. This increases their efficiency over standard RC-coupled class A amplifiers.
This Presentation Of Classes Of Amplifiers which is based on class a b ab and c amplifier by Arsalan Qureshi student of Dawood University Roll no: D-16-TE-09.
in this slide you will learn what are classes of amplifiers and what is main difference between all classes of amplifier
and after reading this slide you will be able to explain all clases of amplifier
This document discusses different classes of amplifiers:
1. Class A amplifiers have a transistor conducting current at all times, for a full 360 degree conduction angle. They produce minimal distortion but have low efficiency.
2. Class AB amplifiers have a small amount of bias current, conducting for more than 180 degrees but less than 360. They have some overlap between halves of a push-pull stage to reduce crossover distortion.
3. Transformer-coupled Class A amplifiers can improve efficiency by matching load and amplifier impedances using a transformer, reaching up to 40% efficiency. However, transformers add cost and size.
This document provides an introduction to signal amplifiers. It discusses different types of amplifiers including operational amplifiers, small signal amplifiers, and power amplifiers. It describes the key properties of amplifiers including input resistance, output resistance, and gain. It also discusses amplifier gain in terms of voltage gain, current gain, and power gain. Different classes of amplifier operation are covered, including classes A, B, AB, and their characteristics. Biasing techniques and their role in establishing the operating point of amplifiers is also explained.
This document discusses different classifications of amplifiers:
1. According to frequency capabilities (audio vs. radio frequency amplifiers).
2. According to coupling methods (RC, transformer, direct coupled).
3. According to use (voltage amplifiers aim to amplify voltage with minimal current output, while power amplifiers aim to amplify power with minimal voltage change output).
It also discusses different classes of amplifiers based on their biasing point: Class A are biased in the linear region all the time, Class B are biased at cutoff so conduct for 180 degrees, Class AB are biased slightly above cutoff to conduct more than 180 degrees, and Class C are biased to conduct for much less than 180 degrees.
The push-pull amplifier uses two complementary power transistors arranged in a symmetrical configuration to amplify an input signal. There are different classes of linear amplifiers - Class A always conducts but is inefficient, Class B has zero quiescent current but high distortion, and Class AB balances these tradeoffs. The class is determined by the quiescent current. Feedback amplifiers have gains that are stable over temperature and reduce distortion.
The document discusses different classes of amplifiers - Class A, B, AB, and C. Class A amplifiers have the transistor always conducting, providing minimal distortion but low efficiency. Class B amplifiers use two transistors in a push-pull configuration, improving efficiency but introducing crossover distortion. Class AB amplifiers provide a compromise between Class A and B by allowing both transistors to conduct around the crossover point, eliminating distortion while gaining efficiency. Class C amplifiers have the highest efficiency but also the poorest linearity, as the output is zero for over half the input cycle, making them unsuitable for audio but used in RF amplifiers.
This document discusses power amplifiers and output stages. It covers class A, B, AB, and C amplifier stages and their collector current waveforms. It describes an emitter follower circuit and its transfer characteristics. It discusses crossover distortion in class B amplifiers and how class AB eliminates this by biasing the transistors at a small, non-zero current. It covers topics like efficiency, power dissipation, and output resistance for various classes of amplifiers. Exercises are provided to calculate values for a given class AB circuit.
This document provides information about different classes of amplifiers, including Class A, Class B, Class AB, and transformer-coupled amplifiers. It discusses the key characteristics of each type of amplifier, such as conduction angle, efficiency, and whether they use a single transistor or complementary pair. The Class A amplifier has a conduction angle of 360 degrees but low efficiency. Class B amplifiers have a conduction angle of 180 degrees and higher efficiency of around 70% but can experience crossover distortion without additional biasing. Class AB amplifiers add small bias voltages to eliminate crossover distortion while maintaining higher efficiency than Class A.
This document provides information about different classes of amplifiers:
1. Class A amplifiers have the transistor conducting during the entire cycle of the input signal, providing minimal distortion but lower efficiency.
2. Class B amplifiers only conduct during half of the input signal cycle, improving efficiency but introducing crossover distortion.
3. Class AB amplifiers reduce crossover distortion by adding a small bias current, keeping transistors slightly on during both halves of the cycle.
This document discusses class C amplifiers. It defines an amplifier as an electronic device that increases the voltage, current, or power of a signal. It then explains that a class C amplifier is a type of amplifier where the active element (transistor) conducts for less than half of the input signal cycle, resulting in high efficiency but high distortion. The document provides a diagram of a class C amplifier circuit and explains its components and operation. It notes that class C amplifiers are commonly used in radio frequency applications due to their high efficiency.
The document discusses different classes of amplifiers, including:
- Class A amplifiers operate linearly by conducting all the time, providing low distortion but low efficiency of 30%.
- Class B amplifiers use two transistors to conduct half the waveform each, improving efficiency to 50% but causing distortion at zero crossings.
- Class AB amplifiers bias transistors slightly on to conduct more than half but less than full cycles, reducing distortion without large efficiency losses.
- Other classes like D, F, G aim to further improve efficiency through switching or multiple power supplies, with some able to reach near 100% efficiency.
1. Application Note AN-1071
Class D Audio Amplifier Basics
By Jun Honda & Jonathan Adams
Table of Contents
Page
What is a Class D Audio Amplifier? – Theory of Operation ..................2
Topology Comparison – Linear vs. Class D .........................................4
Analogy to a Synchronous Buck Converter..........................................5
Power Losses in the MOSFETs ...........................................................6
Half Bridge vs. Full Bridge....................................................................7
Major Cause of Imperfection ................................................................8
THD and Dead Time ............................................................................9
Audio Performance Measurement........................................................10
Shoot Through and Dead Time ............................................................11
Power Supply Pumping ........................................................................12
EMI Consideration: Qrr in Body Diode .................................................13
Conclusion ...........................................................................................14
A Class D audio amplifier is basically a switching amplifier or PWM amplifier. There are a number
of different classes of amplifiers. This application note takes a look at the definitions for the main
classifications.
www.irf.com AN-1071 1
2. AN-1071
What is a Class D Audio Amplifier - non-linearity of Class B designs is overcome,
Theory of Operation without the inefficiencies of a Class A design.
Efficiencies for Class AB amplifiers is about
A Class D audio amplifier is basically a switch- 50%.
ing amplifier or PWM amplifier. There are a num-
ber of different classes of amplifiers. We will take Class D – This class of amplifier is a switching
a look at the definitions for the main classifica- or PWM amplifier as mentioned above. This
tions as an introduction: class of amplifier is the main focus of this appli-
cation note. In this type of amplifier, the switches
Class A – In a Class A amplifier, the output de- are either fully on or fully off, significantly re-
vices are continuously conducting for the entire ducing the power losses in the output devices.
cycle, or in other words there is always bias Efficiencies of 90-95% are possible. The audio
current flowing in the output devices. This to- signal is used to modulate a PWM carrier sig-
pology has the least distortion and is the most nal which drives the output devices, with the
linear, but at the same time is the least efficient last stage being a low pass filter to remove the
at about 20%. The design is typically not high frequency PWM carrier frequency.
complementary with a high and low side output
devices. From the above amplifier classifications, classes
A, B and AB are all what is termed linear ampli-
Class B – This type of amplifier operates in the fiers. We will discuss the differences between
opposite way to Class A amplifiers. The output Linear and Class D amplifiers in the next sec-
devices only conduct for half the sinusoidal cycle tion. The block diagram of a linear amplifier is
(one conducts in the positive region, and one shown below in fig 1. In a linear amplifier the
conducts in the negative region), or in other signals always remain in the analog domain,
words, if there is no input signal then there is and the output transistors act as linear regula-
no current flow in the output devices. This class tors to modulate the output voltage. This results
of amplifier is obviously more efficient than Class in a voltage drop across the output devices,
A, at about 50%, but has some issue with lin- which reduces efficiency.
earity at the crossover point, due to the time it
takes to turn one device off and turn the other Class D amplifiers take on many different forms,
device on. some can have digital inputs and some can have
analog inputs. Here we will focus on the type
Class AB – This type of amplifier is a combina- which have analog inputs.
tion of the above two types, and is currently one
of the most common types of power amplifier in
existence. Here both devices are allowed to
conduct at the same time, but just a small
amount near the crossover point. Hence each
device is conducting for more than half a cycle
but less than the whole cycle, so the inherent
2 www.irf.com
3. AN-1071
Feedback
Triangle
Generator +Vcc
Nch
Level
Shift
COMP Deadtime
+ -
Error
Amp Nch
+
Fig 1 Block Diagram of a Class D Amplifier
-Vcc
Fig 1 above shows the basic block diagram for the input signal is a standard audio line level
a Half Bridge Class D amplifier, with the wave- signal. This audio line level signal is sinusoidal
forms at each stage. This circuit uses feedback with a frequency ranging from 20Hz to 20kHz
from the output of the half-bridge to help com- typically. This signal is compared with a high
pensate for variations in the bus voltages. frequency triangle or sawtooth waveform to cre-
ate the PWM signal as seen in fig 2a below.
So how does a Class D amplifier work? A Class This PWM signal is then used to drive the power
D amplifier works in very much the same way stage, creating the amplified digital signal, and
as a PWM power supply (we will show the anal- finally a low pass filter is applied to the signal to
ogy later). Let’s start with an assumption that filter out the PWM carrier frequency and retrieve
the sinusoidal audio signal (also seen in fig 2b).
COMP
Class D
switching stage LPF
Fig 2a PWM Signal Generation Fig 2b Output Filtering
Fig 2) Class D Amplifier Waveforms
www.irf.com 3
4. AN-1071
Topology Comparison – Linear vs. Class D Gain – With Linear amplifiers the gain is con-
stant irrespective of bus voltage variations, how-
In this section we will discuss the differences ever with Class D amplifiers the gain is propor-
between linear (Class A and Class AB) amplifi- tional to the bus voltage. This means that the
ers, and Class D digital power amplifiers. The power supply rejection ratio (PSRR) of a Class
primary and main difference between linear and D amplifier is 0dB, whereas the PSRR of a lin-
Class D amplifiers is the efficiency. This is the ear amplifier is very good. It is common in Class
whole reason for the invention of Class D am- D amplifiers to use feedback to compensate for
plifiers. The Linear amplifiers is inherently very the bus voltage variations.
linear in terms of its performance, but it is also
very inefficient at about 50% typically for a Class Energy Flow – In linear amplifiers the energy
AB amplifier, whereas a Class D amplifier is flow is always from supply to the load, and in
much more efficient, with values in the order of Full bridge Class D amplifiers this is also true. A
90% in practical designs. Fig 3 below shows half-bridge Class D amplifier however is differ-
typical efficiency curves for linear and Class D ent, as the energy flow can be bi-directional,
amplifiers. which leads to the “Bus pumping” phenomena,
which causes the bus capacitors to be charged
up by the energy flow from the load back to the
ā Temp rise test condition supply. This occurs mainly at the low audio fre-
quencies i.e. below 100Hz.
Output
Linear Amplifier
ā
Output
Class D Amplifier
Fig 3 Linear and Class D Amplifier Efficiencies
4 www.irf.com
5. AN-1071
Analogy to a Synchronous Buck Converter
A simple analogy can be made between a Class
D amplifier and a synchronous buck converter.
The topologies are essentially the same as can
be seen below in fig 4.
Fc of LPF is
above 20KHz
Gate Driver
Gate Driver
Q1
MOSFET Q1
MOSFET
U1A
U1A
8
8
L1 L1
3 3
+
1 + 1
2 2
- INDUCTOR - INDUCTOR
ERROR AMP
Vref
ERROR AMP
4
R1
4
R1
C1 LOAD C1 LOAD
CAPACITOR CAPACITOR
Q2 Q2
MOSFET MOSFET
Audio signal input as
a reference voltage
Buck Converter Class D amplifier
Fig 4 Topologies for Synchronous Buck Converter and a Class D amplifier
The main difference between the two circuits is The final difference is in the way the MOSFETs
that the reference signal for the synchronous are optimized. The Synch buck converter is
buck converter is a slow changing signal from optimized differently for the high and low side
the feedback circuit( a fixed voltage), in the MOSFETs, with lower RDS(on) for longer duty and
case of the Class D amplifier the reference sig- low Qg for short duty. The Class D amplifier has
nal is an audio signal which is continuously the same optimization for both of the MOSFETs,
changing. This means that the duty cycle is rela- with the same RDS(on) for high and low side.
tively fixed in the synch buck converter, whereas
the duty is continuously changing in the Class
D amplifier with an average duty of 50%.
In the synch buck converter the load current
direction is always towards the load, but in Class
D the current flows in both directions.
www.irf.com 5
6. AN-1071
Now lets look at the losses for a Class D ampli-
Power Losses in the MOSFETs fier. The total power loss in the output devices
for a Class D amplifier are given by:
The losses in the power switches are very dif-
ferent between linear amplifiers and Class D PTOTAL = Psw + Pcond + Pgd
amplifiers. First lets look at the losses in a lin-
ear Class AB amplifier. The losses can be de- Psw are the switching losses and are given by
fined as: the equation:
π
1 Vcc
(1 − K sin ω ⋅ t ) Vcc K sin ω ⋅ t • dω ⋅ t
2
PC = ⋅∫ Psw = COSS ⋅VBUS ⋅ f PWM + I D ⋅VDS ⋅ t f ⋅ f PWM
2 ⋅π 0 2 2 ⋅ RL
Pcond are the conduction losses and are given
Where K is the ratio of Vbus to output voltage. by the equation:
RDS (ON )
This can then be simplified down to the follow- Pcond = ⋅ Po
ing equation for the linear amplifier Power switch RL
losses:
Pgd are the gate drive losses and are given by
Vcc2 2K K 2 the equation:
Ptot = ⋅
π − 2
8π ⋅ RL Pgd = 2 ⋅ Qg ⋅Vgs ⋅ f PWM
Note that the power loss is not related to the As can be seen in a Class D amplifier the out-
output device parameters. Fig 5) below shows put losses are dependant on the parameters of
the power loss vs K. the device used, so optimization is needed to
have the most effective device, based on Qg,
Loss RDS(on), COSS, and tf . Fig 6 below shows the power
losses vs K for the Class D amplifier.
VCC
2 Loss
Pc 0 .2
8 RL
Efficiency can be
improved further!
K=2/ƒÎ K=1 K=1
Fig 5) Power Loss vs. K for Linear Class AB Amplifier Fig 6 Power Loss vs. K for Class D Amplifie
6 www.irf.com
www.irf.
7. AN-1071
Table 1: Topology Comparison (Half-bridge vs. Full-bridge)
Similar to conventional Class AB amplifiers, In the half-bridge topology, the power supply
Class D amplifiers can be categorized into two might suffer from the energy being pumped back
topologies, half-bridge and full-bridge configu- from the amplifier, resulting in severe bus volt-
rations. Each topology has pros and cons. In age fluctuations when the amplifier outputs low
brief, a half-bridge is potentially simpler, while a frequency audio signals to the load. This kick-
full-bridge is better in audio performance. The back energy to the power supply is a funda-
full-bridge topology requires two half-bridge mental characteristic of Class D amplification.
amplifiers, and thus, more components. How- Complementary switching legs in the full-bridge
ever, the differential output structure of the tend to consume energy from the other side of
bridge topology inherently can cancel even the the leg, so there is no energy being pumped
order of harmonic distortion components and back towards the power supply.
DC offsets, as in Class AB amplifiers. A full-
bridge topology allows of the use of a better Table 1 shows the summary of the comparison.
PWM modulation scheme, such as the three
level PWM which essentially has fewer errors
due to quantization.
www.irf.com 7
8. AN-1071
Fig 7: Major Cause of Degradation
An ideal Class D amplifying stage has no dis- diode characteristics.
tortion and no noise generation in the audible 4. Parasitic components that cause ring-
band, along with providing 100% efficiency. ing on transient edges
However, as shown in Fig 7, practical Class D 5. Power supply voltage fluctuations due
amplifiers have imperfections that generate dis- to its finite output impedance and reac-
tortions and noise. The imperfections are tive power flowing through the DC bus
caused by the distorted switching waveform 6. Non-linearity in the output LPF.
being generated by the Class D stage. The
causes are: In general, switching timing error in a gate sig-
nal is the primary cause of the nonlinearity. The
1. Nonlinearity in the PWM signal from timing error due to dead-time in particular has
modulator to switching stage due to lim- the most significant contribution of nonlinearity
ited resolution and/or jitter in timing in a Class D stage. A small amount of dead-
2. Timing errors added by the gate drivers, time in the tens of nano-seconds can easily
such as dead-time, ton/toff, and tr/tf generate more than 1% of THD (Total Harmonic
3. Unwanted characteristics in the Distortion). Accurate switching timing is always
switching devices, such as finite ON re- a primary concern.
sistance, finite switching speed or body
8 www.irf.com
9. AN-1071
Let us take a look at how the dead-time affects nonlinearity.
Fig 8: THD and Dead-time
The operation mode in a Class D output stage tive DC bus. This action is automatically caused
can be categorized into three different regions by the commutation current from the demodu-
based on how the output waveform follows the lation inductor, regardless of low side turn-on
input timing. In those three different operation timing. Therefore the timing in the output wave-
regions, the output waveform follows different form is not influenced by the dead-time inserted
edges in high side and low side input signals. into the turn-on edge of low side, and always
follows the high side input timing. Consequently,
Let’s examine the first operating region where the PWM waveform is shortened only by the
the output current flows from the Class D stage dead-time inserted into the high side gate sig-
to the load when the amount of the current is nal, resulting in slightly lower voltage gain as
larger than the inductor ripple current. At the expected from the input duty cycle.
instant of high side turn-off and prior to low side
turn-on, the output node is driven to the nega-
www.irf.com 9
10. AN-1071
A similar situation happens to the negative op- different gain. The output waveform will be dis-
eration region where the output current flows torted by these three different gain regions in a
from the load to the Class D stage. The amount cycle of the audio signal.
of the current is larger than the inductor ripple
current. In this case, the timing in the output Fig. 8 shows how significantly dead time affects
waveform is not influenced by the dead-time THD performance. A 40nS dead time can cre-
inserted into the turn-on edge of the high side, ate 2% THD. This can be improved to 0.2% by
and always follows the low side input timing. tightening the dead time down to 15nS. This
Consequently, the PWM waveform is shortened punctuates the significance of seamless high
only by the dead-time inserted into the low side side and low side switching for better linearity.
gate signal.
Audio Performance Measurement
There is a region between the two operation
modes described earlier where the output tim- Audio measuring equipment with an AES17
ing is independent of the dead-time. When the brick wall filter, such as Audio Precision AP2,
output current is smaller than the inductor ripple are necessary. However a classic audio ana-
current, the output timing follows the turn-off lyzer like the HP8903B can be used with ap-
edge of each input because, in this region, turn- propriate pre-stage low pass filter is applied. The
on is made by ZVS (Zero Voltage Switching) important consideration here is that the output
operation. Hence, there is no distortion in this signal of a Class D amplifier still contains sub-
middle region. stantial amount of switching frequency carrier
on its waveform, which causes a wrong read-
As the output current varies according to the ing, and those analyzers might not be immune
audio input signal, the Class D stage changes enough to the carrier leak from a Class D am-
its operation regions, which each have a slightly plifier. Fig. 9 shows an example of a filter.
470 680 1K
R1 R2 R3
8
R4 4.7n 2.2n 1n HP8903
C1 C2 C3
Fig 9: Example of an output filter
10 www.irf.com
11. AN-1071
Fig 10: Shoot-through prevention
However, a narrow dead-time can be very for a reliable design of a Class D amplifier to
risky in mass production. Because once ensure that the dead-time is always positive and
both high and low side MOSFETs are turned never negative to prevent MOSFETs from en-
on simultaneously, the DC bus voltage will tering the shoot through condition.
be short circuited by the MOSFETs. A huge
amount of shoot-through current starts to
flow, which will result in device destruction.
It should be noticed that the effective dead-
time can be vary from unit to unit variation
of component values and its die tempera-
ture. Fig. 10 shows the relationship between
the length of the dead time and the amount of
shoot-through charge. It is extremely important
www.irf.com 11
12. AN-1071
Fig 11: Power Supply Pumping
Another marked cause of degradation in Class power supply has no way to absorb the energy
D amplifiers is bus pumping, which can be seen coming back from the load. Consequently the
when the half bridge topology is powering a low bus voltage is pumped up, creating bus voltage
frequency output to the load. Always keep in fluctuations.
mind that the gain of a Class D amplifier stage
is directly proportional to the bus voltage. There- Bus pumping does not occur in full bridge to-
fore, bus fluctuation creates distortion. Since the pologies because the energy kicked back to the
energy flowing in the Class D switching stage power supply from one side of the switching leg
is bi-directional, there is a period where the will be consumed in the other side of the
Class D amplifier feeds energy back to the switching leg.
power supply. The majority of the energy flow-
ing back to the supply is from the energy stored
in the inductor in the output LPF. Usually, the
12 www.irf.com
13. AN-1071
Fig 12: EMI Considerations
EMI (Electro-Magnetic Interference) in Class ducting state unless the stored minority car-
D amplifier design is troublesome like in rier is fully discharged. This reverse recov-
other switching applications. One of the ery current tends to have a sharp spiky
major sources of EMI comes from the re- shape and leads to unwanted ringing from
verse recovery charge of the MOSFET body stray inductances in PCB traces and the
diode flowing from the top rail to the bot- package. Therefore, PCB layout is crucial for
tom, similar to the shoot-through current. both ruggedness of the design and reduc-
During the dead-time inserted to prevent tion of EMI.
shoot through current, the inductor current
in the output LPF turns on the body diode.
In the next phase when the other side of the
MOSFET starts to turn on at the end of the
dead-time, the body diode stays in a con-
www.irf.com 13
14. AN-1071
Conclusion
Highly efficient Class D amplifiers now provide
similar performances to conventional Class AB
amplifier if key components are carefully se-
lected and the layout takes into account the
subtle, yet significant impact of parasitic com-
ponents.
Constant innovations in semiconductor tech-
nologies are increasing the use of Class D am-
plifiers usage due to improvements in higher
efficiency, increased power density and better
audio performance.
WORLD HEADQUARTERS: 233 Kansas St., El Segundo, California 90245 Tel: (310) 252-7105
http://www.irf.com/ Data and specifications subject to change without notice. 2/8/2005
14 www.irf.com