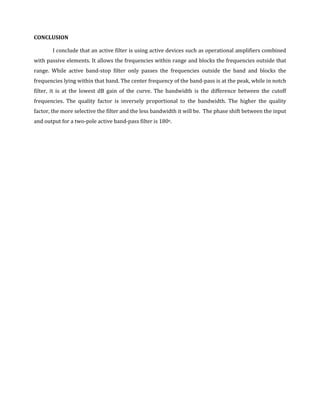
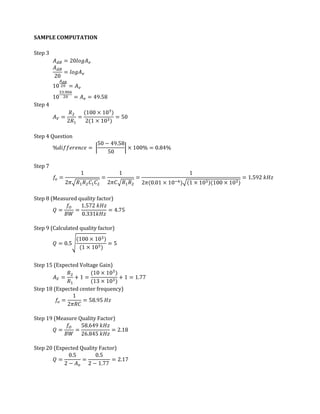
SlideShare a Scribd company logo
NATIONAL COLLEGE OF SCIENCE AND TECHNOLOGY
                     Amafel Building, Aguinaldo Highway Dasmariรฑas City, Cavite


                         EXPERIMENT NO. 4
              ACTIVE BAND-PASS AND BAND-STOP FILTERS


Balane, Maycen M.                                                            July 21, 2011
Signal Spectra and Signal Processing/BSECE 41A1                              Score:


                                   Engr. Grace Ramones
                                         Instructor
OBJECTIVES

  ๏ถ Plot the gain-frequency response curve and determine the center frequency for an active band-

     pass filter.

  ๏ถ Determine the quality factor (Q) and bandwidth of an active band-pass filter

  ๏ถ Plot the phase shift between the input and output for a two-pole active band-pass filter.

  ๏ถ Plot the gain-frequency response curve and determine the center frequency for an active band-

     stop (notch) filter.

  ๏ถ Determine the quality factor (Q) and bandwidth of an active notch filter.
DATA SHEET

MATERIALS
One function generator
One dual-trace oscilloscope
Two LM741 op-amps
Capacitors: two 0.001 ยตF, two 0.05 ยตF, one 0.1 ยตF
Resistors: one 1 kโ„ฆ, two 10 kโ„ฆ, one 13 kโ„ฆ, one 27 kโ„ฆ, two 54 kโ„ฆ, and one 100kโ„ฆ

THEORY
In electronic communications systems, it is often necessary to separate a specific range of frequencies
from the total frequency spectrum. This is normally accomplished with filters. A filter is a circuit that
passes a specific range of frequencies while rejecting other frequencies. Active filters use active
devices such as op-amps combined with passive elements. Active filters have several advantages over
passive filters. The passive elements provide frequency selectivity and the active devices provide
voltage gain, high input impedance, and low output impedance. The voltage gain reduces attenuation
of the signal by the filter, the high input impedance prevents excessive loading of the source, and the
low output impedance prevents the filter from being affected by the load. Active filters are also easy to
adjust over a wide frequency range without altering the desired response. The weakness of active
filters is the upper-frequency limit due to the limited open-loop bandwidth (funity) of op-amps. The
filter cutoff frequency cannot exceed the unity-gain frequency (funity) of the op-amp. Therefore, active
filters must be used in applications where the unity-gain frequency (funity) of the op-amp is high enough
so that it does not fall within the frequency range of the application. For this reason, active filters are
mostly used in low-frequency applications.

A band-pass filter passes all frequencies lying within a band of frequencies and rejects all other
frequencies outside the band. The low cut-off frequency (fC1) and the high-cutoff frequency (fC2) on the
gain-frequency plot are the frequencies where the voltage gain has dropped by 3 dB (0.707) from the
maximum dB gain. A band-stop filter rejects a band of frequencies and passes all other frequencies
outside the band, and of then referred to as a band-reject or notch filter. The low-cutoff frequency (fC1)
and high-cutoff frequency (fC2) on the gain frequency plot are the frequencies where the voltage gain
has dropped by 3 dB (0.707) from the passband dB gain.

The bandwidth (BW) of a band-pass or band-stop filter is the difference between the high-cutoff
frequency and the low-cutoff frequency. Therefore,
BW = fC2 โ€“ fC1

The center frequency (fo)of the band-pass or a band-stop filter is the geometric mean of the low-cutoff
frequency (fC1) and the high-cutoff frequency (fC2). Therefore,

The quality factor (Q) of a band-pass or a band-stop filter is the ratio of the center frequency (fO) and
the bandwidth (BW), and is an indication of the selectivity of the filter. Therefore,
A higher value of Q means a narrower bandwidth and a more selective filter. A filter with a Q less than
one is considered to be a wide-band filter and a filter with a Q greater than ten is considered to be a
narrow-band filter.

One way to implement a band-pass filter is to cascade a low-pass and a high-pass filter. As long as the
cutoff frequencies are sufficiently separated, the low-pass filter cutoff frequency will determine the
low-cutoff frequency of the band-pass filter and a high-pass filter cutoff frequency will determine the
high-cutoff frequency of the band-pass filter. Normally this arrangement is used for a wide-band filter
(Q 1) because the cutoff frequencies need to be sufficient separated.

A multiple-feedback active band-pass filter is shown in Figure 4-1. Components R1 and C1 determine
the low-cutoff frequency, and R2 and C2 determine the high-cutoff frequency. The center frequency (fo)
can be calculated from the component values using the equation


Where C = C1 = C2. The voltage gain (AV) at the center frequency is calculated from


and the quality factor (Q) is calculated from


Figure 4-1 Multiple-Feedback Band-Pass Filter
                                                                        XBP1
   XFG1

                                                                   IN      OUT


                                  10nF
                                   C1

                                                          100kฮฉ
                                                            R2
                                                741
                                         3
                                                                               Vo
                                                      6
            Vin   1kฮฉ                    2                                     10kฮฉ
                         10nF
                   R1                                                          RL
                          C2
Figure 4-2 shows a second-order (two-pole) Sallen-Key notch filter. The expected center frequency (fO)
can be calculated from


At this frequency (fo), the feedback signal returns with the correct amplitude and phase to attenuate
the input. This causes the output to be attenuated at the center frequency.
The notch filter in Figure 4-2 has a passband voltage gain


and a quality factor


The voltage gain of a Sallen-Key notch filter must be less than 2 and the circuit Q must be less than 10
to avoid oscillation.

Figure 4-2 Two pole Sallen-Key Notch Filter
                                                                         XBP1

   XFG1                                                             IN      OUT


                                               27kฮฉ
                                                27kโ„ฆ
                                               R52
                                                   R/2
                   50nF              50nF          3
                   0.05ยตF
                    C3               0.05ยตF
                                       C
          Vin          C               C                    6
                                                   2       741                  Vo
                                                                                RL
                   54kฮฉ                54kฮฉ                                     10kฮฉ
                   54kโ„ฆ                54kโ„ฆ
                                         R
                    R3                                                          0
                       R                   R
                                                         R2
                                   100nF
                                   2C          R1        10kฮฉ
                                               13kฮฉ
                               0
                                               0


PROCEDURE
Active Band-Pass Filter
Step 1          Open circuit file FIG 4-1. Make sure that the following Bode plotter settings are
                selected. Magnitude, Vertical (Log, F = 40 dB, I = 10 dB), Horizontal (Log, F = 10 kHz, I =
                100 Hz)
Step 2      Run the simulation. Notice that the voltage gain has been plotted between the
            frequencies of 100 Hz and 10 kHz. Draw the curve plot in the space provided. Next,
            move the cursor to the center of the curve. Measure the center frequency (f o) and the
            voltage gain in dB. Record the dB gain and center frequency (fo) on the curve plot.
               ๏ƒผ fo = 1.572 kHz
               ๏ƒผ AdB = 33.906 dB


Question:   Is the frequency response curve that of a band-pass filters? Explain why.
            ๏ƒผ It is a frequency response curve of a band-pass filter because the filter only let the
              frequencies from 100.219 Hz to 10 kHz to pass and block the other frequency.
Step 3      Based on the dB voltage gain at the center frequency, calculate the actual voltage gain
            (AV)
            ๏ƒผ AV = 49.58
Step 4      Based on the circuit component values, calculate the expected voltage gain (AV) at the
            center frequency (fo)
            ๏ƒผ AV = 50
Question:   How did the measured voltage gain at the center frequency compare with the voltage
            gain calculated from the circuit values?
            ๏ƒผ The percentage difference is 0.84%
Step 5      Move the cursor as close as possible to a point on the left of the curve that is 3 dB down
            from the dB gain at the center frequency (fo). Record the frequency (low-cutoff
            frequency, fC1) on the curve plot. Next, move the cursor as close as possible to a point
            on the right side of the curve that is 3 dB down from the center frequency (fo). Record
            the frequency (high-cutoff frequency, fC2) on the curve plot.
            ๏ƒผ fC1 = 1.415 kHz
            ๏ƒผ fC2 = 1.746 kHz
Step 6      Based on the measured values of fC1 and fC2, calculate the bandwidth (BW) of the band-
            pass filter.
๏ƒผ BW = 0.331 kHz
Step 7      Based on the circuit component values, calculate the expected center frequency (fo)
            ๏ƒผ fo = 1.592 kHz
Question:   How did the calculated value of the center frequency compare with the measured
            value?
            ๏ƒผ They have a difference of 1.27%.
Step 8      Based on the measured center frequency (fo) and the bandwidth (BW), calculate the
            quality factor (Q) of the band-pass filter.
            ๏ƒผ Q = 4.75
Step 9      Based on the component values, calculate the expected quality factor (Q) of the band-
            pass filter.
            ๏ƒผ Q=5
Question:   How did your calculated value of Q based on the component values compare with the
            value of Q determined from the measured fo and BW?
            ๏ƒผ The percentage difference is only 5.26%
            ๏ƒผ
Step 10     Click Phase on the Bode plotter to plot the phase curve. Change the vertical initial value
            (I) to -270o and the final value (F) to +270o. Run the simulation again. You are looking
            at the phase difference (ฮธ) between the filter input and output wave shapes as a
            function of frequency (f). Draw the curve plot in the space provided.


Step 11     Move the cursor as close as possible to the curve center frequency (fo), recorded on the
            curve plot in Step 2. Record the frequency (fo) and the phase (ฮธ) on the phase curve plot.
            ๏ƒผ fo = 1.572 kHz
            ๏ƒผ ฮธ = 50.146o
Question:   What does this result tell you about the relationship between the filter output and
            input at the center frequency?
๏ƒผ The output is 173.987o out of phase with input.


Active Band-Pass (Notch) Filter
Step 12        Open circuit file FIG 4-2. Make sure that the following Bode plotter settings are
               selected. Magnitude, Vertical (Log, F = 10 dB, I = -20 dB), Horizontal (Log, F = 500 Hz, I =
               2 Hz)
Step 13        Run the simulation. Notice that the voltage gain has been plotted between the
               frequencies of 2 Hz and 500 Hz. Draw the curve plot in the space provided. Next, move
               the cursor to the center of the curve at its center point. Measure the center frequency
               (fo) and record it on the curve plot. Next, move the cursor to the flat part of the curve in
               the passband. Measure the voltage gain in dB and record the dB gain on the curve plot.
                   ๏ƒผ fo = 58.649 Hz
                   ๏ƒผ AdB = 4. dB


Question:      Is the frequency response curve that of a band-pass filters? Explain why.
               ๏ƒผ Yes, it attenuates all the frequencies lying within the bandpass.
Step 14        Based on the dB voltage gain at the center frequency, calculate the actual voltage gain
               (AV)
               ๏ƒผ AV = 1.77
Step 15        Based on the circuit component values, calculate the expected voltage gain in the
               passband.
               ๏ƒผ AV = 1.77
Question:      How did the measured voltage gain in the passband compare with the voltage gain
               calculated from the circuit values?
               ๏ƒผ They are the same.
Step 16        Move the cursor as close as possible to a point on the left of the curve that is 3 dB down
               from the dB gain in the bandpass Record the frequency (low-cutoff frequency, fC1) on
               the curve plot. Next, move the cursor as close as possible to a point on the right side of
the curve that is 3 dB down from dB gain in the passband. Record the frequency (high-
            cutoff frequency, fC2) on the curve plot.
            ๏ƒผ fC1 = 46.743 Hz
            ๏ƒผ fC2 = 73.588 Hz
Step 17     Based on the measured values of fC1 and fC2, calculate the bandwidth (BW) of the notch
            filter.
            ๏ƒผ BW = 26.845 Hz
Step 18     Based on the circuit component values, calculate the expected center frequency (fo)
            ๏ƒผ fo = 58.95Hz
Question    How did the calculated value of the center frequency compare with the measured
            value?
            ๏ƒผ The percentage difference is 0.51%.
Step 19     Based on the measured center frequency (fo) and bandwidth (BW) , calculate the
            quality factor (Q) of the notch filter.
            ๏ƒผ Q = 2.18
Step 20     Based on the calculated passband voltage gain (Av), calculate the expected quality
            factor (Q) of the notch filter.
            ๏ƒผ Q = 2.17
Question:   How did your calculated value of Q based on the passband voltage gain compare with
            the value of Q determined from the measured fo and BW?
            ๏ƒผ   They have 0.46% difference.
CONCLUSION

       I conclude that an active filter is using active devices such as operational amplifiers combined
with passive elements. It allows the frequencies within range and blocks the frequencies outside that
range. While active band-stop filter only passes the frequencies outside the band and blocks the
frequencies lying within that band. The center frequency of the band-pass is at the peak, while in notch
filter, it is at the lowest dB gain of the curve. The bandwidth is the difference between the cutoff
frequencies. The quality factor is inversely proportional to the bandwidth. The higher the quality
factor, the more selective the filter and the less bandwidth it will be. The phase shift between the input
and output for a two-pole active band-pass filter is 180o.
SAMPLE COMPUTATION

Step 3


Step 4


Step 4 Question


Step 7


Step 8 (Measured quality factor)


Step 9 (Calculated quality factor)


Step 15 (Expected Voltage Gain)


Step 18 (Expected center frequency)


Step 19 (Measure Quality Factor)


Step 20 (Expected Quality Factor)

More Related Content

What's hot

Exp passive filter (9)
Exp passive filter (9)Exp passive filter (9)
Exp passive filter (9)Sarah Krystelle
ย 
Exp passive filter (7)
Exp passive filter (7)Exp passive filter (7)
Exp passive filter (7)Sarah Krystelle
ย 
Exp amplitude modulation (2)
Exp amplitude modulation (2)Exp amplitude modulation (2)
Exp amplitude modulation (2)Sarah Krystelle
ย 
Comm008 e4 cauan
Comm008 e4 cauanComm008 e4 cauan
Comm008 e4 cauanSarah Krystelle
ย 
Exp amplitude modulation (8)
Exp amplitude modulation (8)Exp amplitude modulation (8)
Exp amplitude modulation (8)Sarah Krystelle
ย 
Active Filter (Low Pass)
Active Filter (Low Pass)Active Filter (Low Pass)
Active Filter (Low Pass)Saravanan Sukumaran
ย 
Comm008 e4 bani
Comm008 e4 baniComm008 e4 bani
Comm008 e4 baniSarah Krystelle
ย 
Fm demodulation using zero crossing detector
Fm demodulation using zero crossing detectorFm demodulation using zero crossing detector
Fm demodulation using zero crossing detector
mpsrekha83
ย 
Band pass filter
Band pass filterBand pass filter
Band pass filter
Madeha Arif
ย 
Butterworth filter
Butterworth filterButterworth filter
Butterworth filter
MOHAMMAD AKRAM
ย 
SIGNAL SPECTRA EXPERIMENT AMPLITUDE MODULATION COPY 2
SIGNAL SPECTRA EXPERIMENT AMPLITUDE MODULATION COPY 2SIGNAL SPECTRA EXPERIMENT AMPLITUDE MODULATION COPY 2
SIGNAL SPECTRA EXPERIMENT AMPLITUDE MODULATION COPY 2Sarah Krystelle
ย 
Receiver design
Receiver designReceiver design
Receiver design
Pei-Che Chang
ย 
Frequency Synthesized Signal Generator
Frequency Synthesized Signal GeneratorFrequency Synthesized Signal Generator
Frequency Synthesized Signal Generator
DESH D YADAV
ย 
blake sample-problems
blake sample-problemsblake sample-problems
blake sample-problems
John Joel Martinez
ย 
Series parallel resonance circuit
Series parallel resonance circuitSeries parallel resonance circuit
Series parallel resonance circuit
Praveen Vaidya
ย 

What's hot (20)

Exp passive filter (9)
Exp passive filter (9)Exp passive filter (9)
Exp passive filter (9)
ย 
Exp passive filter (7)
Exp passive filter (7)Exp passive filter (7)
Exp passive filter (7)
ย 
Exp amplitude modulation (2)
Exp amplitude modulation (2)Exp amplitude modulation (2)
Exp amplitude modulation (2)
ย 
Comm008 e4 cauan
Comm008 e4 cauanComm008 e4 cauan
Comm008 e4 cauan
ย 
Exp amplitude modulation (8)
Exp amplitude modulation (8)Exp amplitude modulation (8)
Exp amplitude modulation (8)
ย 
Cauan (2)
Cauan (2)Cauan (2)
Cauan (2)
ย 
Active Filter (Low Pass)
Active Filter (Low Pass)Active Filter (Low Pass)
Active Filter (Low Pass)
ย 
Comm008 e4 bani
Comm008 e4 baniComm008 e4 bani
Comm008 e4 bani
ย 
Sarah
SarahSarah
Sarah
ย 
Fm demodulation using zero crossing detector
Fm demodulation using zero crossing detectorFm demodulation using zero crossing detector
Fm demodulation using zero crossing detector
ย 
Band pass filter
Band pass filterBand pass filter
Band pass filter
ย 
Butterworth filter
Butterworth filterButterworth filter
Butterworth filter
ย 
SIGNAL SPECTRA EXPERIMENT AMPLITUDE MODULATION COPY 2
SIGNAL SPECTRA EXPERIMENT AMPLITUDE MODULATION COPY 2SIGNAL SPECTRA EXPERIMENT AMPLITUDE MODULATION COPY 2
SIGNAL SPECTRA EXPERIMENT AMPLITUDE MODULATION COPY 2
ย 
Receiver design
Receiver designReceiver design
Receiver design
ย 
Backup
BackupBackup
Backup
ย 
Frequency Synthesized Signal Generator
Frequency Synthesized Signal GeneratorFrequency Synthesized Signal Generator
Frequency Synthesized Signal Generator
ย 
blake sample-problems
blake sample-problemsblake sample-problems
blake sample-problems
ย 
Exp5 bani
Exp5 baniExp5 bani
Exp5 bani
ย 
Series parallel resonance circuit
Series parallel resonance circuitSeries parallel resonance circuit
Series parallel resonance circuit
ย 
5
55
5
ย 

Similar to Comm008 e4 balane

Comm008 e4 agdon
Comm008 e4 agdonComm008 e4 agdon
Comm008 e4 agdonSarah Krystelle
ย 
Comm008 e4 pula
Comm008 e4 pulaComm008 e4 pula
Comm008 e4 pulaSarah Krystelle
ย 
Communicationlabmanual
CommunicationlabmanualCommunicationlabmanual
Communicationlabmanualjkanth26
ย 
Communicationlabmanual
CommunicationlabmanualCommunicationlabmanual
Communicationlabmanualjkanth26
ย 
Exp passive filter (6)
Exp passive filter (6)Exp passive filter (6)
Exp passive filter (6)Sarah Krystelle
ย 
LICA-
LICA- LICA-
Lic lab manual
Lic lab manualLic lab manual
Lic lab manual
AJAL A J
ย 
RF Module Design - [Chapter 4] Transceiver Architecture
RF Module Design - [Chapter 4] Transceiver ArchitectureRF Module Design - [Chapter 4] Transceiver Architecture
RF Module Design - [Chapter 4] Transceiver Architecture
Simen Li
ย 
Phase-locked Loops - Theory and Design
Phase-locked Loops - Theory and DesignPhase-locked Loops - Theory and Design
Phase-locked Loops - Theory and Design
Simen Li
ย 
Lesson6
Lesson6Lesson6
Lesson6
Kavin Paul
ย 
Active filters
Active filtersActive filters
Active filtersTouqeer Jumani
ย 

Similar to Comm008 e4 balane (20)

E4 bani
E4 baniE4 bani
E4 bani
ย 
Comm008 e4 agdon
Comm008 e4 agdonComm008 e4 agdon
Comm008 e4 agdon
ย 
Comm008 e4 pula
Comm008 e4 pulaComm008 e4 pula
Comm008 e4 pula
ย 
Communicationlabmanual
CommunicationlabmanualCommunicationlabmanual
Communicationlabmanual
ย 
Communicationlabmanual
CommunicationlabmanualCommunicationlabmanual
Communicationlabmanual
ย 
Exp passive filter (6)
Exp passive filter (6)Exp passive filter (6)
Exp passive filter (6)
ย 
Pagara
PagaraPagara
Pagara
ย 
LICA-
LICA- LICA-
LICA-
ย 
Pula
PulaPula
Pula
ย 
Lic lab manual
Lic lab manualLic lab manual
Lic lab manual
ย 
3 (2)
3 (2)3 (2)
3 (2)
ย 
Pagara
PagaraPagara
Pagara
ย 
RF Module Design - [Chapter 4] Transceiver Architecture
RF Module Design - [Chapter 4] Transceiver ArchitectureRF Module Design - [Chapter 4] Transceiver Architecture
RF Module Design - [Chapter 4] Transceiver Architecture
ย 
3 (3)
3 (3)3 (3)
3 (3)
ย 
Bani
BaniBani
Bani
ย 
Phase-locked Loops - Theory and Design
Phase-locked Loops - Theory and DesignPhase-locked Loops - Theory and Design
Phase-locked Loops - Theory and Design
ย 
Lesson6
Lesson6Lesson6
Lesson6
ย 
Cauan
CauanCauan
Cauan
ย 
Maala
MaalaMaala
Maala
ย 
Active filters
Active filtersActive filters
Active filters
ย 

More from Sarah Krystelle

SIGNAL SPECTRA EXPERIMENT 2 - FINALS (for PULA)
SIGNAL SPECTRA EXPERIMENT 2 - FINALS (for PULA)SIGNAL SPECTRA EXPERIMENT 2 - FINALS (for PULA)
SIGNAL SPECTRA EXPERIMENT 2 - FINALS (for PULA)Sarah Krystelle
ย 
SIGNAL SPECTRA EXPERIMENT 2 - FINALS (for CAUAN)
SIGNAL SPECTRA EXPERIMENT 2 - FINALS (for CAUAN)SIGNAL SPECTRA EXPERIMENT 2 - FINALS (for CAUAN)
SIGNAL SPECTRA EXPERIMENT 2 - FINALS (for CAUAN)Sarah Krystelle
ย 
SIGNAL SPECTRA EXPERIMENT 1 - FINALS (for PULA)
SIGNAL SPECTRA EXPERIMENT 1 - FINALS (for PULA)SIGNAL SPECTRA EXPERIMENT 1 - FINALS (for PULA)
SIGNAL SPECTRA EXPERIMENT 1 - FINALS (for PULA)Sarah Krystelle
ย 
SIGNAL SPECTRA EXPERIMENT 1 - FINALS (for CAUAN)
SIGNAL SPECTRA EXPERIMENT 1 - FINALS (for CAUAN)SIGNAL SPECTRA EXPERIMENT 1 - FINALS (for CAUAN)
SIGNAL SPECTRA EXPERIMENT 1 - FINALS (for CAUAN)Sarah Krystelle
ย 
SIGNAL SPECTRA EXPERIMENT 1 - FINALS (for AGDON)
SIGNAL SPECTRA EXPERIMENT 1 - FINALS (for AGDON)SIGNAL SPECTRA EXPERIMENT 1 - FINALS (for AGDON)
SIGNAL SPECTRA EXPERIMENT 1 - FINALS (for AGDON)Sarah Krystelle
ย 
SIGNAL SPECTRA EXPERIMENT 1 - FINALS (for ABDON)
SIGNAL SPECTRA EXPERIMENT 1 - FINALS (for ABDON)SIGNAL SPECTRA EXPERIMENT 1 - FINALS (for ABDON)
SIGNAL SPECTRA EXPERIMENT 1 - FINALS (for ABDON)Sarah Krystelle
ย 
SIGNAL SPECTRA EXPERIMENT AMPLITUDE MODULATION
SIGNAL SPECTRA EXPERIMENT AMPLITUDE MODULATIONSIGNAL SPECTRA EXPERIMENT AMPLITUDE MODULATION
SIGNAL SPECTRA EXPERIMENT AMPLITUDE MODULATIONSarah Krystelle
ย 
Exp amplitude modulation (7)
Exp amplitude modulation (7)Exp amplitude modulation (7)
Exp amplitude modulation (7)Sarah Krystelle
ย 
Exp amplitude modulation (6)
Exp amplitude modulation (6)Exp amplitude modulation (6)
Exp amplitude modulation (6)Sarah Krystelle
ย 
Exp amplitude modulation (4)
Exp amplitude modulation (4)Exp amplitude modulation (4)
Exp amplitude modulation (4)Sarah Krystelle
ย 
Exp amplitude modulation (1)
Exp amplitude modulation (1)Exp amplitude modulation (1)
Exp amplitude modulation (1)Sarah Krystelle
ย 

More from Sarah Krystelle (18)

SIGNAL SPECTRA EXPERIMENT 2 - FINALS (for PULA)
SIGNAL SPECTRA EXPERIMENT 2 - FINALS (for PULA)SIGNAL SPECTRA EXPERIMENT 2 - FINALS (for PULA)
SIGNAL SPECTRA EXPERIMENT 2 - FINALS (for PULA)
ย 
SIGNAL SPECTRA EXPERIMENT 2 - FINALS (for CAUAN)
SIGNAL SPECTRA EXPERIMENT 2 - FINALS (for CAUAN)SIGNAL SPECTRA EXPERIMENT 2 - FINALS (for CAUAN)
SIGNAL SPECTRA EXPERIMENT 2 - FINALS (for CAUAN)
ย 
SIGNAL SPECTRA EXPERIMENT 1 - FINALS (for PULA)
SIGNAL SPECTRA EXPERIMENT 1 - FINALS (for PULA)SIGNAL SPECTRA EXPERIMENT 1 - FINALS (for PULA)
SIGNAL SPECTRA EXPERIMENT 1 - FINALS (for PULA)
ย 
SIGNAL SPECTRA EXPERIMENT 1 - FINALS (for CAUAN)
SIGNAL SPECTRA EXPERIMENT 1 - FINALS (for CAUAN)SIGNAL SPECTRA EXPERIMENT 1 - FINALS (for CAUAN)
SIGNAL SPECTRA EXPERIMENT 1 - FINALS (for CAUAN)
ย 
SIGNAL SPECTRA EXPERIMENT 1 - FINALS (for AGDON)
SIGNAL SPECTRA EXPERIMENT 1 - FINALS (for AGDON)SIGNAL SPECTRA EXPERIMENT 1 - FINALS (for AGDON)
SIGNAL SPECTRA EXPERIMENT 1 - FINALS (for AGDON)
ย 
SIGNAL SPECTRA EXPERIMENT 1 - FINALS (for ABDON)
SIGNAL SPECTRA EXPERIMENT 1 - FINALS (for ABDON)SIGNAL SPECTRA EXPERIMENT 1 - FINALS (for ABDON)
SIGNAL SPECTRA EXPERIMENT 1 - FINALS (for ABDON)
ย 
SIGNAL SPECTRA EXPERIMENT AMPLITUDE MODULATION
SIGNAL SPECTRA EXPERIMENT AMPLITUDE MODULATIONSIGNAL SPECTRA EXPERIMENT AMPLITUDE MODULATION
SIGNAL SPECTRA EXPERIMENT AMPLITUDE MODULATION
ย 
Exp amplitude modulation (7)
Exp amplitude modulation (7)Exp amplitude modulation (7)
Exp amplitude modulation (7)
ย 
Exp amplitude modulation (6)
Exp amplitude modulation (6)Exp amplitude modulation (6)
Exp amplitude modulation (6)
ย 
Exp amplitude modulation (4)
Exp amplitude modulation (4)Exp amplitude modulation (4)
Exp amplitude modulation (4)
ย 
Exp amplitude modulation (1)
Exp amplitude modulation (1)Exp amplitude modulation (1)
Exp amplitude modulation (1)
ย 
Am
AmAm
Am
ย 
Pula
PulaPula
Pula
ย 
Objectives
ObjectivesObjectives
Objectives
ย 
Morales
MoralesMorales
Morales
ย 
Exp5 tagasa
Exp5 tagasaExp5 tagasa
Exp5 tagasa
ย 
Exp5 balane
Exp5 balaneExp5 balane
Exp5 balane
ย 
Exp5 agdon
Exp5 agdonExp5 agdon
Exp5 agdon
ย 

Recently uploaded

20240425_ TJ Communications Credentials_compressed.pdf
20240425_ TJ Communications Credentials_compressed.pdf20240425_ TJ Communications Credentials_compressed.pdf
20240425_ TJ Communications Credentials_compressed.pdf
tjcomstrang
ย 
FINAL PRESENTATION.pptx12143241324134134
FINAL PRESENTATION.pptx12143241324134134FINAL PRESENTATION.pptx12143241324134134
FINAL PRESENTATION.pptx12143241324134134
LR1709MUSIC
ย 
The effects of customers service quality and online reviews on customer loyal...
The effects of customers service quality and online reviews on customer loyal...The effects of customers service quality and online reviews on customer loyal...
The effects of customers service quality and online reviews on customer loyal...
balatucanapplelovely
ย 
5 Things You Need To Know Before Hiring a Videographer
5 Things You Need To Know Before Hiring a Videographer5 Things You Need To Know Before Hiring a Videographer
5 Things You Need To Know Before Hiring a Videographer
ofm712785
ย 
Meas_Dylan_DMBS_PB1_2024-05XX_Revised.pdf
Meas_Dylan_DMBS_PB1_2024-05XX_Revised.pdfMeas_Dylan_DMBS_PB1_2024-05XX_Revised.pdf
Meas_Dylan_DMBS_PB1_2024-05XX_Revised.pdf
dylandmeas
ย 
The Parable of the Pipeline a book every new businessman or business student ...
The Parable of the Pipeline a book every new businessman or business student ...The Parable of the Pipeline a book every new businessman or business student ...
The Parable of the Pipeline a book every new businessman or business student ...
awaisafdar
ย 
Introduction to Amazon company 111111111111
Introduction to Amazon company 111111111111Introduction to Amazon company 111111111111
Introduction to Amazon company 111111111111
zoyaansari11365
ย 
Premium MEAN Stack Development Solutions for Modern Businesses
Premium MEAN Stack Development Solutions for Modern BusinessesPremium MEAN Stack Development Solutions for Modern Businesses
Premium MEAN Stack Development Solutions for Modern Businesses
SynapseIndia
ย 
3.0 Project 2_ Developing My Brand Identity Kit.pptx
3.0 Project 2_ Developing My Brand Identity Kit.pptx3.0 Project 2_ Developing My Brand Identity Kit.pptx
3.0 Project 2_ Developing My Brand Identity Kit.pptx
tanyjahb
ย 
The-McKinsey-7S-Framework. strategic management
The-McKinsey-7S-Framework. strategic managementThe-McKinsey-7S-Framework. strategic management
The-McKinsey-7S-Framework. strategic management
Bojamma2
ย 
Enterprise Excellence is Inclusive Excellence.pdf
Enterprise Excellence is Inclusive Excellence.pdfEnterprise Excellence is Inclusive Excellence.pdf
Enterprise Excellence is Inclusive Excellence.pdf
KaiNexus
ย 
LA HUG - Video Testimonials with Chynna Morgan - June 2024
LA HUG - Video Testimonials with Chynna Morgan - June 2024LA HUG - Video Testimonials with Chynna Morgan - June 2024
LA HUG - Video Testimonials with Chynna Morgan - June 2024
Lital Barkan
ย 
ModelingMarketingStrategiesMKS.CollumbiaUniversitypdf
ModelingMarketingStrategiesMKS.CollumbiaUniversitypdfModelingMarketingStrategiesMKS.CollumbiaUniversitypdf
ModelingMarketingStrategiesMKS.CollumbiaUniversitypdf
fisherameliaisabella
ย 
CADAVER AS OUR FIRST TEACHER anatomt in your.pptx
CADAVER AS OUR FIRST TEACHER anatomt in your.pptxCADAVER AS OUR FIRST TEACHER anatomt in your.pptx
CADAVER AS OUR FIRST TEACHER anatomt in your.pptx
fakeloginn69
ย 
Maksym Vyshnivetskyi: PMO Quality Management (UA)
Maksym Vyshnivetskyi: PMO Quality Management (UA)Maksym Vyshnivetskyi: PMO Quality Management (UA)
Maksym Vyshnivetskyi: PMO Quality Management (UA)
Lviv Startup Club
ย 
The Influence of Marketing Strategy and Market Competition on Business Perfor...
The Influence of Marketing Strategy and Market Competition on Business Perfor...The Influence of Marketing Strategy and Market Competition on Business Perfor...
The Influence of Marketing Strategy and Market Competition on Business Perfor...
Adam Smith
ย 
What is the TDS Return Filing Due Date for FY 2024-25.pdf
What is the TDS Return Filing Due Date for FY 2024-25.pdfWhat is the TDS Return Filing Due Date for FY 2024-25.pdf
What is the TDS Return Filing Due Date for FY 2024-25.pdf
seoforlegalpillers
ย 
Attending a job Interview for B1 and B2 Englsih learners
Attending a job Interview for B1 and B2 Englsih learnersAttending a job Interview for B1 and B2 Englsih learners
Attending a job Interview for B1 and B2 Englsih learners
Erika906060
ย 
Improving profitability for small business
Improving profitability for small businessImproving profitability for small business
Improving profitability for small business
Ben Wann
ย 
VAT Registration Outlined In UAE: Benefits and Requirements
VAT Registration Outlined In UAE: Benefits and RequirementsVAT Registration Outlined In UAE: Benefits and Requirements
VAT Registration Outlined In UAE: Benefits and Requirements
uae taxgpt
ย 

Recently uploaded (20)

20240425_ TJ Communications Credentials_compressed.pdf
20240425_ TJ Communications Credentials_compressed.pdf20240425_ TJ Communications Credentials_compressed.pdf
20240425_ TJ Communications Credentials_compressed.pdf
ย 
FINAL PRESENTATION.pptx12143241324134134
FINAL PRESENTATION.pptx12143241324134134FINAL PRESENTATION.pptx12143241324134134
FINAL PRESENTATION.pptx12143241324134134
ย 
The effects of customers service quality and online reviews on customer loyal...
The effects of customers service quality and online reviews on customer loyal...The effects of customers service quality and online reviews on customer loyal...
The effects of customers service quality and online reviews on customer loyal...
ย 
5 Things You Need To Know Before Hiring a Videographer
5 Things You Need To Know Before Hiring a Videographer5 Things You Need To Know Before Hiring a Videographer
5 Things You Need To Know Before Hiring a Videographer
ย 
Meas_Dylan_DMBS_PB1_2024-05XX_Revised.pdf
Meas_Dylan_DMBS_PB1_2024-05XX_Revised.pdfMeas_Dylan_DMBS_PB1_2024-05XX_Revised.pdf
Meas_Dylan_DMBS_PB1_2024-05XX_Revised.pdf
ย 
The Parable of the Pipeline a book every new businessman or business student ...
The Parable of the Pipeline a book every new businessman or business student ...The Parable of the Pipeline a book every new businessman or business student ...
The Parable of the Pipeline a book every new businessman or business student ...
ย 
Introduction to Amazon company 111111111111
Introduction to Amazon company 111111111111Introduction to Amazon company 111111111111
Introduction to Amazon company 111111111111
ย 
Premium MEAN Stack Development Solutions for Modern Businesses
Premium MEAN Stack Development Solutions for Modern BusinessesPremium MEAN Stack Development Solutions for Modern Businesses
Premium MEAN Stack Development Solutions for Modern Businesses
ย 
3.0 Project 2_ Developing My Brand Identity Kit.pptx
3.0 Project 2_ Developing My Brand Identity Kit.pptx3.0 Project 2_ Developing My Brand Identity Kit.pptx
3.0 Project 2_ Developing My Brand Identity Kit.pptx
ย 
The-McKinsey-7S-Framework. strategic management
The-McKinsey-7S-Framework. strategic managementThe-McKinsey-7S-Framework. strategic management
The-McKinsey-7S-Framework. strategic management
ย 
Enterprise Excellence is Inclusive Excellence.pdf
Enterprise Excellence is Inclusive Excellence.pdfEnterprise Excellence is Inclusive Excellence.pdf
Enterprise Excellence is Inclusive Excellence.pdf
ย 
LA HUG - Video Testimonials with Chynna Morgan - June 2024
LA HUG - Video Testimonials with Chynna Morgan - June 2024LA HUG - Video Testimonials with Chynna Morgan - June 2024
LA HUG - Video Testimonials with Chynna Morgan - June 2024
ย 
ModelingMarketingStrategiesMKS.CollumbiaUniversitypdf
ModelingMarketingStrategiesMKS.CollumbiaUniversitypdfModelingMarketingStrategiesMKS.CollumbiaUniversitypdf
ModelingMarketingStrategiesMKS.CollumbiaUniversitypdf
ย 
CADAVER AS OUR FIRST TEACHER anatomt in your.pptx
CADAVER AS OUR FIRST TEACHER anatomt in your.pptxCADAVER AS OUR FIRST TEACHER anatomt in your.pptx
CADAVER AS OUR FIRST TEACHER anatomt in your.pptx
ย 
Maksym Vyshnivetskyi: PMO Quality Management (UA)
Maksym Vyshnivetskyi: PMO Quality Management (UA)Maksym Vyshnivetskyi: PMO Quality Management (UA)
Maksym Vyshnivetskyi: PMO Quality Management (UA)
ย 
The Influence of Marketing Strategy and Market Competition on Business Perfor...
The Influence of Marketing Strategy and Market Competition on Business Perfor...The Influence of Marketing Strategy and Market Competition on Business Perfor...
The Influence of Marketing Strategy and Market Competition on Business Perfor...
ย 
What is the TDS Return Filing Due Date for FY 2024-25.pdf
What is the TDS Return Filing Due Date for FY 2024-25.pdfWhat is the TDS Return Filing Due Date for FY 2024-25.pdf
What is the TDS Return Filing Due Date for FY 2024-25.pdf
ย 
Attending a job Interview for B1 and B2 Englsih learners
Attending a job Interview for B1 and B2 Englsih learnersAttending a job Interview for B1 and B2 Englsih learners
Attending a job Interview for B1 and B2 Englsih learners
ย 
Improving profitability for small business
Improving profitability for small businessImproving profitability for small business
Improving profitability for small business
ย 
VAT Registration Outlined In UAE: Benefits and Requirements
VAT Registration Outlined In UAE: Benefits and RequirementsVAT Registration Outlined In UAE: Benefits and Requirements
VAT Registration Outlined In UAE: Benefits and Requirements
ย 

Comm008 e4 balane

  • 1. NATIONAL COLLEGE OF SCIENCE AND TECHNOLOGY Amafel Building, Aguinaldo Highway Dasmariรฑas City, Cavite EXPERIMENT NO. 4 ACTIVE BAND-PASS AND BAND-STOP FILTERS Balane, Maycen M. July 21, 2011 Signal Spectra and Signal Processing/BSECE 41A1 Score: Engr. Grace Ramones Instructor
  • 2. OBJECTIVES ๏ถ Plot the gain-frequency response curve and determine the center frequency for an active band- pass filter. ๏ถ Determine the quality factor (Q) and bandwidth of an active band-pass filter ๏ถ Plot the phase shift between the input and output for a two-pole active band-pass filter. ๏ถ Plot the gain-frequency response curve and determine the center frequency for an active band- stop (notch) filter. ๏ถ Determine the quality factor (Q) and bandwidth of an active notch filter.
  • 3. DATA SHEET MATERIALS One function generator One dual-trace oscilloscope Two LM741 op-amps Capacitors: two 0.001 ยตF, two 0.05 ยตF, one 0.1 ยตF Resistors: one 1 kโ„ฆ, two 10 kโ„ฆ, one 13 kโ„ฆ, one 27 kโ„ฆ, two 54 kโ„ฆ, and one 100kโ„ฆ THEORY In electronic communications systems, it is often necessary to separate a specific range of frequencies from the total frequency spectrum. This is normally accomplished with filters. A filter is a circuit that passes a specific range of frequencies while rejecting other frequencies. Active filters use active devices such as op-amps combined with passive elements. Active filters have several advantages over passive filters. The passive elements provide frequency selectivity and the active devices provide voltage gain, high input impedance, and low output impedance. The voltage gain reduces attenuation of the signal by the filter, the high input impedance prevents excessive loading of the source, and the low output impedance prevents the filter from being affected by the load. Active filters are also easy to adjust over a wide frequency range without altering the desired response. The weakness of active filters is the upper-frequency limit due to the limited open-loop bandwidth (funity) of op-amps. The filter cutoff frequency cannot exceed the unity-gain frequency (funity) of the op-amp. Therefore, active filters must be used in applications where the unity-gain frequency (funity) of the op-amp is high enough so that it does not fall within the frequency range of the application. For this reason, active filters are mostly used in low-frequency applications. A band-pass filter passes all frequencies lying within a band of frequencies and rejects all other frequencies outside the band. The low cut-off frequency (fC1) and the high-cutoff frequency (fC2) on the gain-frequency plot are the frequencies where the voltage gain has dropped by 3 dB (0.707) from the maximum dB gain. A band-stop filter rejects a band of frequencies and passes all other frequencies outside the band, and of then referred to as a band-reject or notch filter. The low-cutoff frequency (fC1) and high-cutoff frequency (fC2) on the gain frequency plot are the frequencies where the voltage gain has dropped by 3 dB (0.707) from the passband dB gain. The bandwidth (BW) of a band-pass or band-stop filter is the difference between the high-cutoff frequency and the low-cutoff frequency. Therefore, BW = fC2 โ€“ fC1 The center frequency (fo)of the band-pass or a band-stop filter is the geometric mean of the low-cutoff frequency (fC1) and the high-cutoff frequency (fC2). Therefore, The quality factor (Q) of a band-pass or a band-stop filter is the ratio of the center frequency (fO) and the bandwidth (BW), and is an indication of the selectivity of the filter. Therefore,
  • 4. A higher value of Q means a narrower bandwidth and a more selective filter. A filter with a Q less than one is considered to be a wide-band filter and a filter with a Q greater than ten is considered to be a narrow-band filter. One way to implement a band-pass filter is to cascade a low-pass and a high-pass filter. As long as the cutoff frequencies are sufficiently separated, the low-pass filter cutoff frequency will determine the low-cutoff frequency of the band-pass filter and a high-pass filter cutoff frequency will determine the high-cutoff frequency of the band-pass filter. Normally this arrangement is used for a wide-band filter (Q 1) because the cutoff frequencies need to be sufficient separated. A multiple-feedback active band-pass filter is shown in Figure 4-1. Components R1 and C1 determine the low-cutoff frequency, and R2 and C2 determine the high-cutoff frequency. The center frequency (fo) can be calculated from the component values using the equation Where C = C1 = C2. The voltage gain (AV) at the center frequency is calculated from and the quality factor (Q) is calculated from Figure 4-1 Multiple-Feedback Band-Pass Filter XBP1 XFG1 IN OUT 10nF C1 100kฮฉ R2 741 3 Vo 6 Vin 1kฮฉ 2 10kฮฉ 10nF R1 RL C2
  • 5. Figure 4-2 shows a second-order (two-pole) Sallen-Key notch filter. The expected center frequency (fO) can be calculated from At this frequency (fo), the feedback signal returns with the correct amplitude and phase to attenuate the input. This causes the output to be attenuated at the center frequency. The notch filter in Figure 4-2 has a passband voltage gain and a quality factor The voltage gain of a Sallen-Key notch filter must be less than 2 and the circuit Q must be less than 10 to avoid oscillation. Figure 4-2 Two pole Sallen-Key Notch Filter XBP1 XFG1 IN OUT 27kฮฉ 27kโ„ฆ R52 R/2 50nF 50nF 3 0.05ยตF C3 0.05ยตF C Vin C C 6 2 741 Vo RL 54kฮฉ 54kฮฉ 10kฮฉ 54kโ„ฆ 54kโ„ฆ R R3 0 R R R2 100nF 2C R1 10kฮฉ 13kฮฉ 0 0 PROCEDURE Active Band-Pass Filter Step 1 Open circuit file FIG 4-1. Make sure that the following Bode plotter settings are selected. Magnitude, Vertical (Log, F = 40 dB, I = 10 dB), Horizontal (Log, F = 10 kHz, I = 100 Hz)
  • 6. Step 2 Run the simulation. Notice that the voltage gain has been plotted between the frequencies of 100 Hz and 10 kHz. Draw the curve plot in the space provided. Next, move the cursor to the center of the curve. Measure the center frequency (f o) and the voltage gain in dB. Record the dB gain and center frequency (fo) on the curve plot. ๏ƒผ fo = 1.572 kHz ๏ƒผ AdB = 33.906 dB Question: Is the frequency response curve that of a band-pass filters? Explain why. ๏ƒผ It is a frequency response curve of a band-pass filter because the filter only let the frequencies from 100.219 Hz to 10 kHz to pass and block the other frequency. Step 3 Based on the dB voltage gain at the center frequency, calculate the actual voltage gain (AV) ๏ƒผ AV = 49.58 Step 4 Based on the circuit component values, calculate the expected voltage gain (AV) at the center frequency (fo) ๏ƒผ AV = 50 Question: How did the measured voltage gain at the center frequency compare with the voltage gain calculated from the circuit values? ๏ƒผ The percentage difference is 0.84% Step 5 Move the cursor as close as possible to a point on the left of the curve that is 3 dB down from the dB gain at the center frequency (fo). Record the frequency (low-cutoff frequency, fC1) on the curve plot. Next, move the cursor as close as possible to a point on the right side of the curve that is 3 dB down from the center frequency (fo). Record the frequency (high-cutoff frequency, fC2) on the curve plot. ๏ƒผ fC1 = 1.415 kHz ๏ƒผ fC2 = 1.746 kHz Step 6 Based on the measured values of fC1 and fC2, calculate the bandwidth (BW) of the band- pass filter.
  • 7. ๏ƒผ BW = 0.331 kHz Step 7 Based on the circuit component values, calculate the expected center frequency (fo) ๏ƒผ fo = 1.592 kHz Question: How did the calculated value of the center frequency compare with the measured value? ๏ƒผ They have a difference of 1.27%. Step 8 Based on the measured center frequency (fo) and the bandwidth (BW), calculate the quality factor (Q) of the band-pass filter. ๏ƒผ Q = 4.75 Step 9 Based on the component values, calculate the expected quality factor (Q) of the band- pass filter. ๏ƒผ Q=5 Question: How did your calculated value of Q based on the component values compare with the value of Q determined from the measured fo and BW? ๏ƒผ The percentage difference is only 5.26% ๏ƒผ Step 10 Click Phase on the Bode plotter to plot the phase curve. Change the vertical initial value (I) to -270o and the final value (F) to +270o. Run the simulation again. You are looking at the phase difference (ฮธ) between the filter input and output wave shapes as a function of frequency (f). Draw the curve plot in the space provided. Step 11 Move the cursor as close as possible to the curve center frequency (fo), recorded on the curve plot in Step 2. Record the frequency (fo) and the phase (ฮธ) on the phase curve plot. ๏ƒผ fo = 1.572 kHz ๏ƒผ ฮธ = 50.146o Question: What does this result tell you about the relationship between the filter output and input at the center frequency?
  • 8. ๏ƒผ The output is 173.987o out of phase with input. Active Band-Pass (Notch) Filter Step 12 Open circuit file FIG 4-2. Make sure that the following Bode plotter settings are selected. Magnitude, Vertical (Log, F = 10 dB, I = -20 dB), Horizontal (Log, F = 500 Hz, I = 2 Hz) Step 13 Run the simulation. Notice that the voltage gain has been plotted between the frequencies of 2 Hz and 500 Hz. Draw the curve plot in the space provided. Next, move the cursor to the center of the curve at its center point. Measure the center frequency (fo) and record it on the curve plot. Next, move the cursor to the flat part of the curve in the passband. Measure the voltage gain in dB and record the dB gain on the curve plot. ๏ƒผ fo = 58.649 Hz ๏ƒผ AdB = 4. dB Question: Is the frequency response curve that of a band-pass filters? Explain why. ๏ƒผ Yes, it attenuates all the frequencies lying within the bandpass. Step 14 Based on the dB voltage gain at the center frequency, calculate the actual voltage gain (AV) ๏ƒผ AV = 1.77 Step 15 Based on the circuit component values, calculate the expected voltage gain in the passband. ๏ƒผ AV = 1.77 Question: How did the measured voltage gain in the passband compare with the voltage gain calculated from the circuit values? ๏ƒผ They are the same. Step 16 Move the cursor as close as possible to a point on the left of the curve that is 3 dB down from the dB gain in the bandpass Record the frequency (low-cutoff frequency, fC1) on the curve plot. Next, move the cursor as close as possible to a point on the right side of
  • 9. the curve that is 3 dB down from dB gain in the passband. Record the frequency (high- cutoff frequency, fC2) on the curve plot. ๏ƒผ fC1 = 46.743 Hz ๏ƒผ fC2 = 73.588 Hz Step 17 Based on the measured values of fC1 and fC2, calculate the bandwidth (BW) of the notch filter. ๏ƒผ BW = 26.845 Hz Step 18 Based on the circuit component values, calculate the expected center frequency (fo) ๏ƒผ fo = 58.95Hz Question How did the calculated value of the center frequency compare with the measured value? ๏ƒผ The percentage difference is 0.51%. Step 19 Based on the measured center frequency (fo) and bandwidth (BW) , calculate the quality factor (Q) of the notch filter. ๏ƒผ Q = 2.18 Step 20 Based on the calculated passband voltage gain (Av), calculate the expected quality factor (Q) of the notch filter. ๏ƒผ Q = 2.17 Question: How did your calculated value of Q based on the passband voltage gain compare with the value of Q determined from the measured fo and BW? ๏ƒผ They have 0.46% difference.
  • 10. CONCLUSION I conclude that an active filter is using active devices such as operational amplifiers combined with passive elements. It allows the frequencies within range and blocks the frequencies outside that range. While active band-stop filter only passes the frequencies outside the band and blocks the frequencies lying within that band. The center frequency of the band-pass is at the peak, while in notch filter, it is at the lowest dB gain of the curve. The bandwidth is the difference between the cutoff frequencies. The quality factor is inversely proportional to the bandwidth. The higher the quality factor, the more selective the filter and the less bandwidth it will be. The phase shift between the input and output for a two-pole active band-pass filter is 180o.
  • 11. SAMPLE COMPUTATION Step 3 Step 4 Step 4 Question Step 7 Step 8 (Measured quality factor) Step 9 (Calculated quality factor) Step 15 (Expected Voltage Gain) Step 18 (Expected center frequency) Step 19 (Measure Quality Factor) Step 20 (Expected Quality Factor)