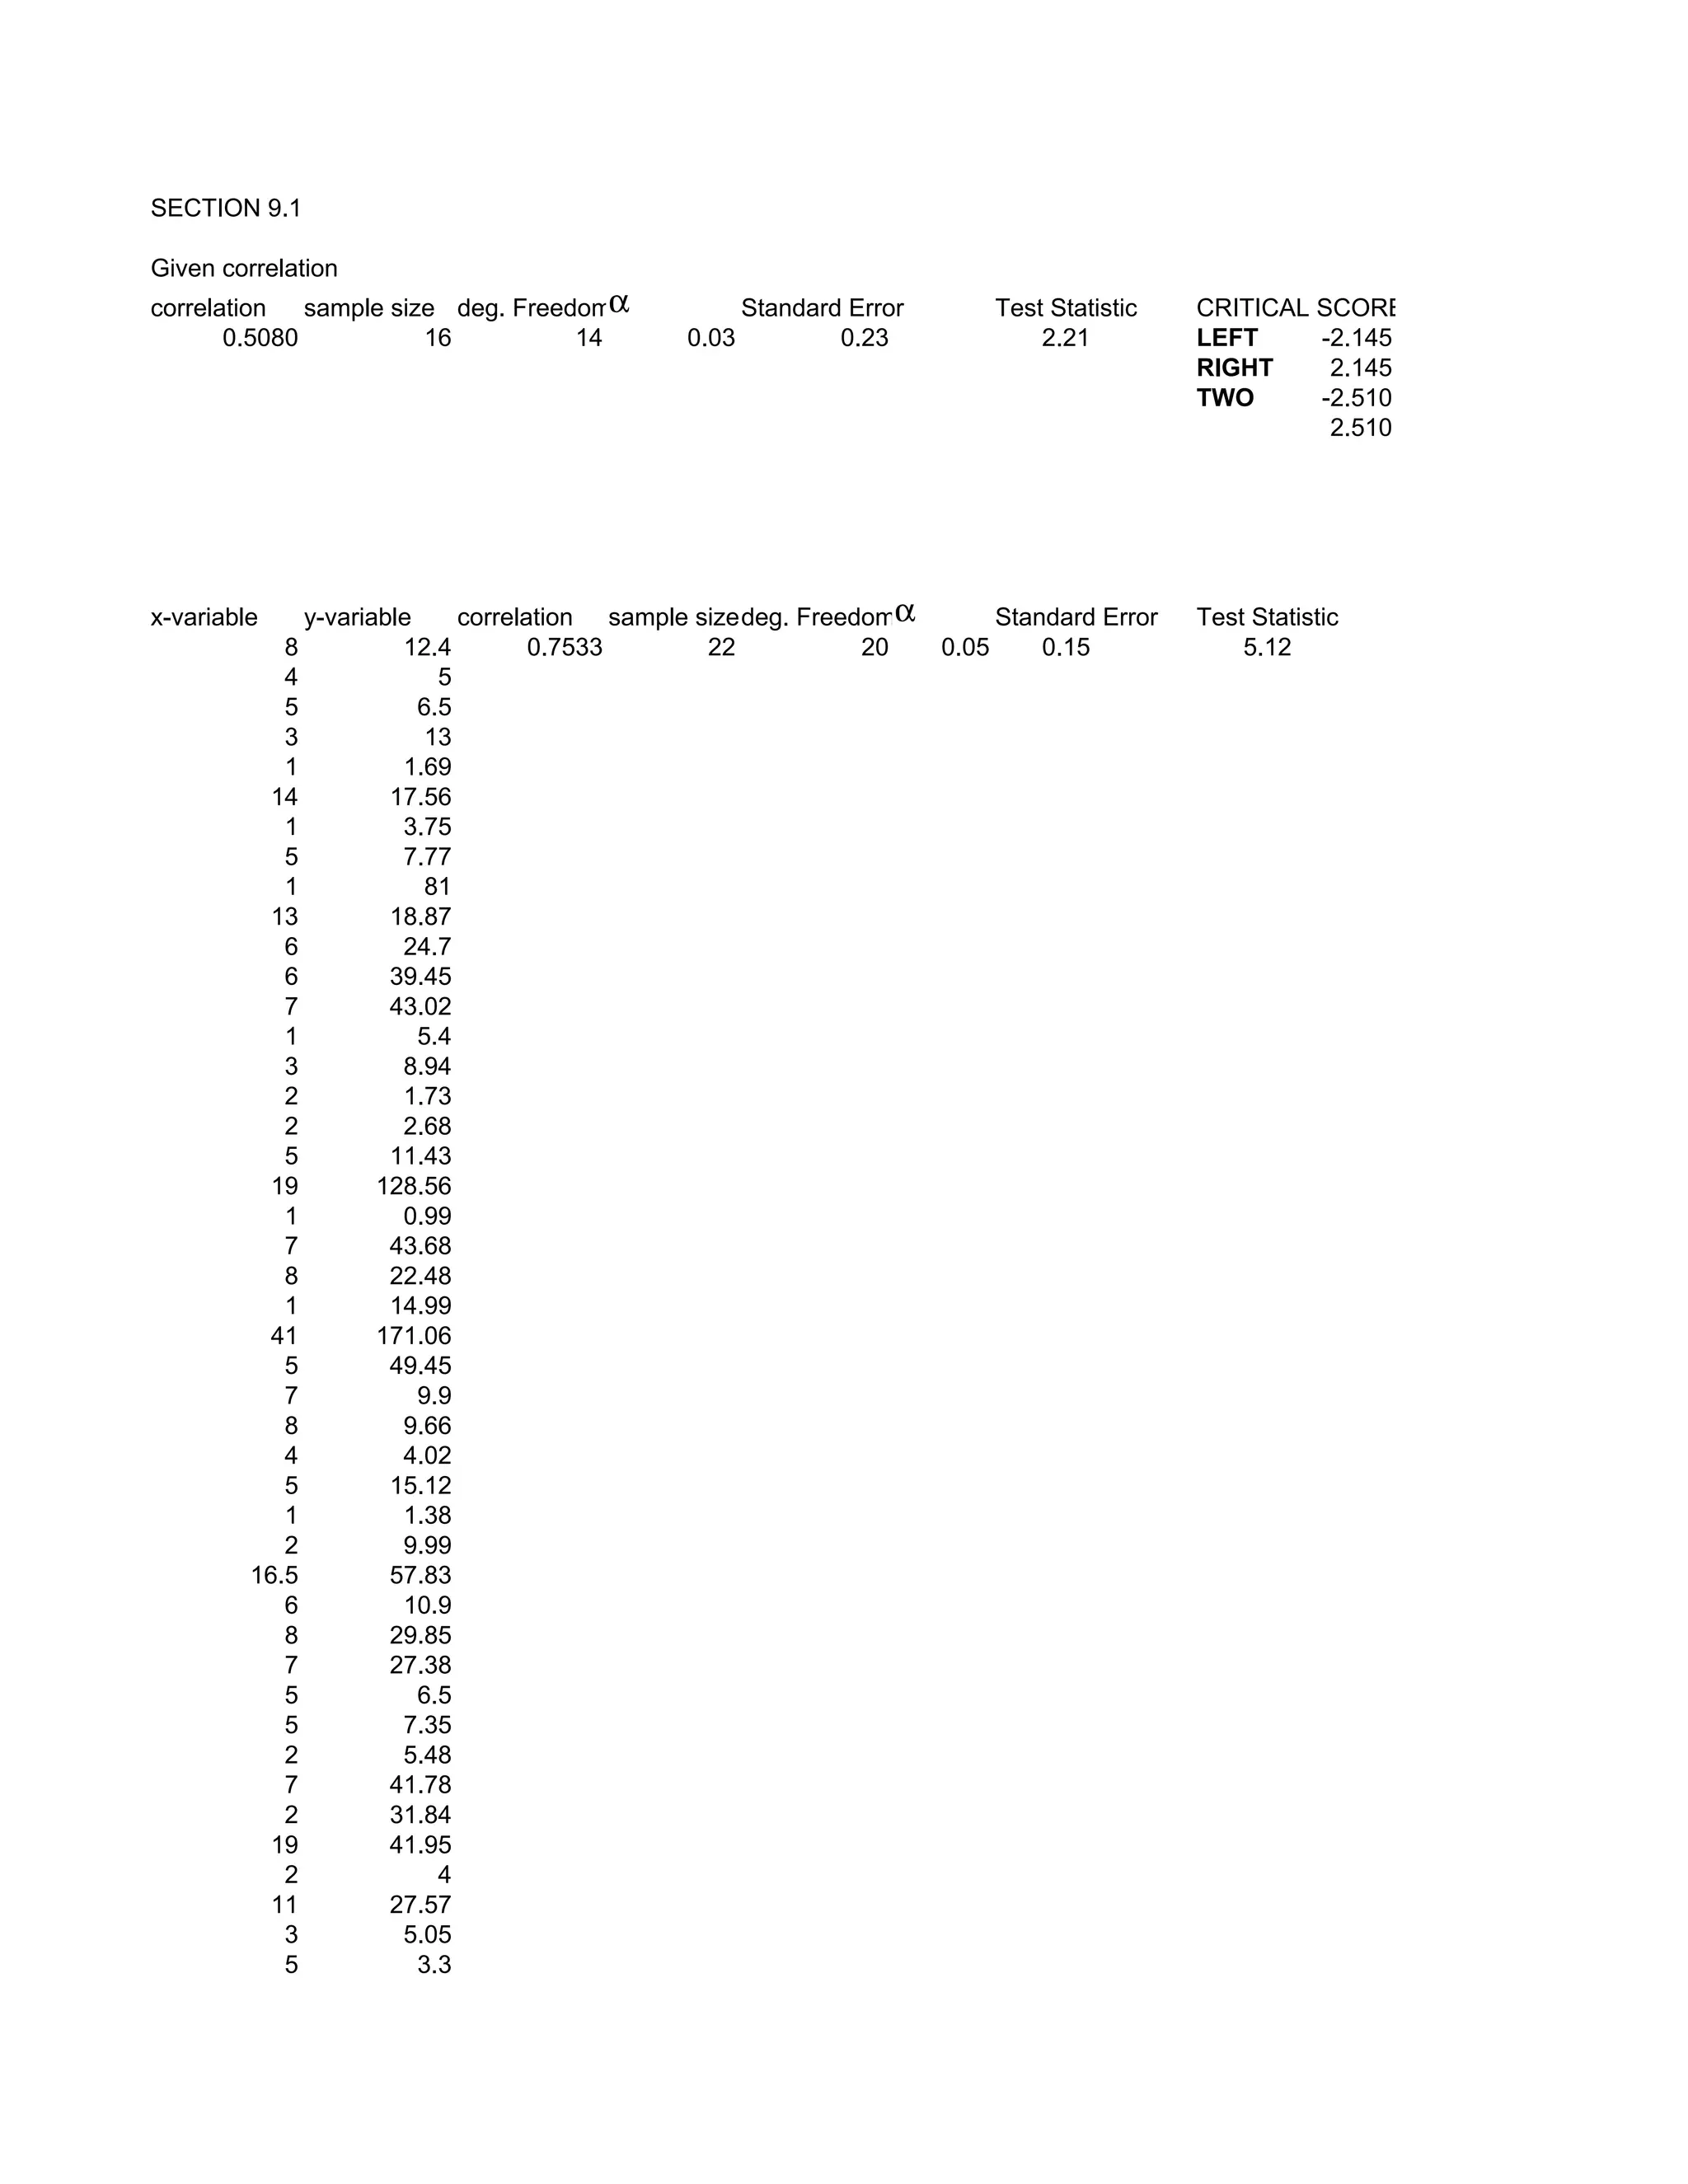
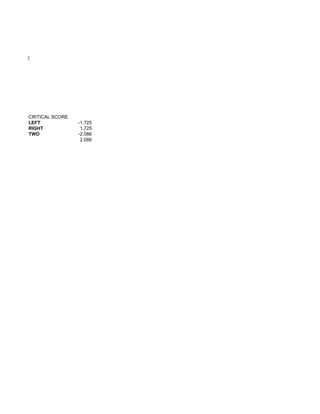
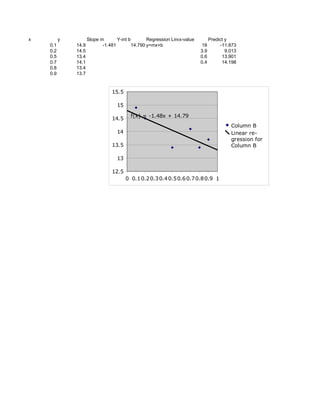
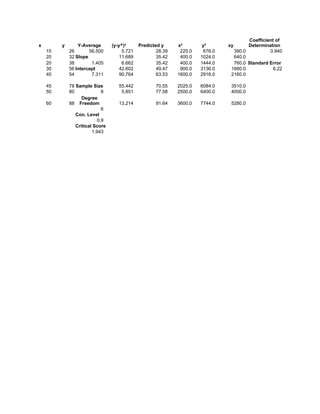
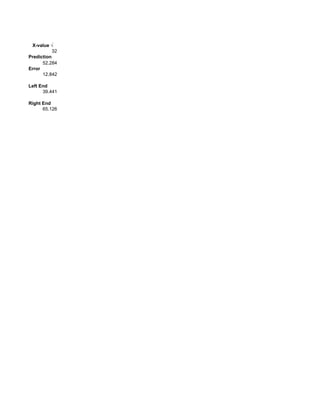
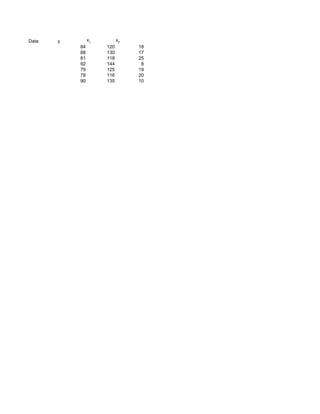
SECTION 9.1

Given correlation
correlation   sample size deg. Freedomα               Standard Error          Test Statistic   CRITICAL SCORE
       0.5080           16          14         0.03           0.23                2.21         LEFT     -2.145
                                                                                               RIGHT     2.145
                                                                                               TWO      -2.510
                                                                                                         2.510


x-variable      y-variable     correlation sample sizedeg. Freedomα           Standard Error   Test Statistic
            8            12.4         0.7533       22           20     0.05       0.15             5.12
            4                5
            5              6.5
            3              13
            1            1.69
          14            17.56
            1            3.75
            5            7.77
            1              81
          13            18.87
            6            24.7
            6           39.45
            7           43.02
            1              5.4
            3            8.94
            2            1.73
            2            2.68
            5           11.43
          19           128.56
            1            0.99
            7           43.68
            8           22.48
            1           14.99
          41           171.06
            5           49.45
            7              9.9
            8            9.66
            4            4.02
            5           15.12
            1            1.38
            2            9.99
         16.5           57.83
            6            10.9
            8           29.85
            7           27.38
            5              6.5
            5            7.35
            2            5.48
            7           41.78
            2           31.84
          19            41.95
            2                4
          11            27.57
            3            5.05
            5              3.3
1    1.59
 1      17
 2   20.88
 7   12.01
 9   29.25
34   71.71
 5   17.52
19   24.23
 1    6.99
 2   19.18
TICAL SCORE


          CRITICAL SCORE
          LEFT             -1.725
          RIGHT             1.725
          TWO              -2.086
                            2.086
x         y          Slope m       Y-int b        Regression Linex-value         Predict y
    0.1       14.9          -1.481         14.790 y=mx+b                   18         -11.873
    0.2       14.5                                                         3.9           9.013
    0.5       13.4                                                         0.6         13.901
    0.7       14.1                                                         0.4         14.198
    0.8       13.4
    0.9       13.7


                                15.5

                                   15

                                          f(x) = -1.48x + 14.79
                                14.5
                                                                                           Column B
                                   14                                                      Linear re-
                                                                                           gression for
                                13.5                                                       Column B

                                   13

                                12.5
                                        0 0.1 0.2 0.3 0.4 0.5 0.6 0.7 0.8 0.9 1
Coefficient of
x        y       Y-Average       (y-y^)2      Predicted y     x2        y2      xy      Determination
    15       26       56.500          5.721           28.39    225.0    676.0     390.0          0.940
    20       32 Slope                11.689           35.42    400.0   1024.0     640.0
    20       38        1.405          6.662           35.42    400.0   1444.0     760.0 Standard Error
    30       56 Intercept            42.602           49.47    900.0   3136.0    1680.0            6.22
    40       54        7.311         90.764           63.53   1600.0   2916.0    2160.0

    45       78 Sample Size         55.442           70.55    2025.0   6084.0    3510.0
    50       80             8        5.851           77.58    2500.0   6400.0    4000.0
                   Degree
    60       88 Freedom             13.214           91.64    3600.0   7744.0    5280.0
                            6
                Con. Level
                          0.9
                Critical Score
                        1.943
X-value √
           32
Prediction
      52.284
Error
      12.842

Left End
      39.441

Right End
      65.126
Data   y        x1         x2
           84        120        18
           88        130        17
           81        118        25
           92        144         8
           79        125        19
           78        116        20
           90        135        10

Chapter 9

  • 1.
    SECTION 9.1 Given correlation correlation sample size deg. Freedomα Standard Error Test Statistic CRITICAL SCORE 0.5080 16 14 0.03 0.23 2.21 LEFT -2.145 RIGHT 2.145 TWO -2.510 2.510 x-variable y-variable correlation sample sizedeg. Freedomα Standard Error Test Statistic 8 12.4 0.7533 22 20 0.05 0.15 5.12 4 5 5 6.5 3 13 1 1.69 14 17.56 1 3.75 5 7.77 1 81 13 18.87 6 24.7 6 39.45 7 43.02 1 5.4 3 8.94 2 1.73 2 2.68 5 11.43 19 128.56 1 0.99 7 43.68 8 22.48 1 14.99 41 171.06 5 49.45 7 9.9 8 9.66 4 4.02 5 15.12 1 1.38 2 9.99 16.5 57.83 6 10.9 8 29.85 7 27.38 5 6.5 5 7.35 2 5.48 7 41.78 2 31.84 19 41.95 2 4 11 27.57 3 5.05 5 3.3
  • 2.
    1 1.59 1 17 2 20.88 7 12.01 9 29.25 34 71.71 5 17.52 19 24.23 1 6.99 2 19.18
  • 3.
    TICAL SCORE CRITICAL SCORE LEFT -1.725 RIGHT 1.725 TWO -2.086 2.086
  • 5.
    x y Slope m Y-int b Regression Linex-value Predict y 0.1 14.9 -1.481 14.790 y=mx+b 18 -11.873 0.2 14.5 3.9 9.013 0.5 13.4 0.6 13.901 0.7 14.1 0.4 14.198 0.8 13.4 0.9 13.7 15.5 15 f(x) = -1.48x + 14.79 14.5 Column B 14 Linear re- gression for 13.5 Column B 13 12.5 0 0.1 0.2 0.3 0.4 0.5 0.6 0.7 0.8 0.9 1
  • 6.
    Coefficient of x y Y-Average (y-y^)2 Predicted y x2 y2 xy Determination 15 26 56.500 5.721 28.39 225.0 676.0 390.0 0.940 20 32 Slope 11.689 35.42 400.0 1024.0 640.0 20 38 1.405 6.662 35.42 400.0 1444.0 760.0 Standard Error 30 56 Intercept 42.602 49.47 900.0 3136.0 1680.0 6.22 40 54 7.311 90.764 63.53 1600.0 2916.0 2160.0 45 78 Sample Size 55.442 70.55 2025.0 6084.0 3510.0 50 80 8 5.851 77.58 2500.0 6400.0 4000.0 Degree 60 88 Freedom 13.214 91.64 3600.0 7744.0 5280.0 6 Con. Level 0.9 Critical Score 1.943
  • 7.
    X-value √ 32 Prediction 52.284 Error 12.842 Left End 39.441 Right End 65.126
  • 8.
    Data y x1 x2 84 120 18 88 130 17 81 118 25 92 144 8 79 125 19 78 116 20 90 135 10