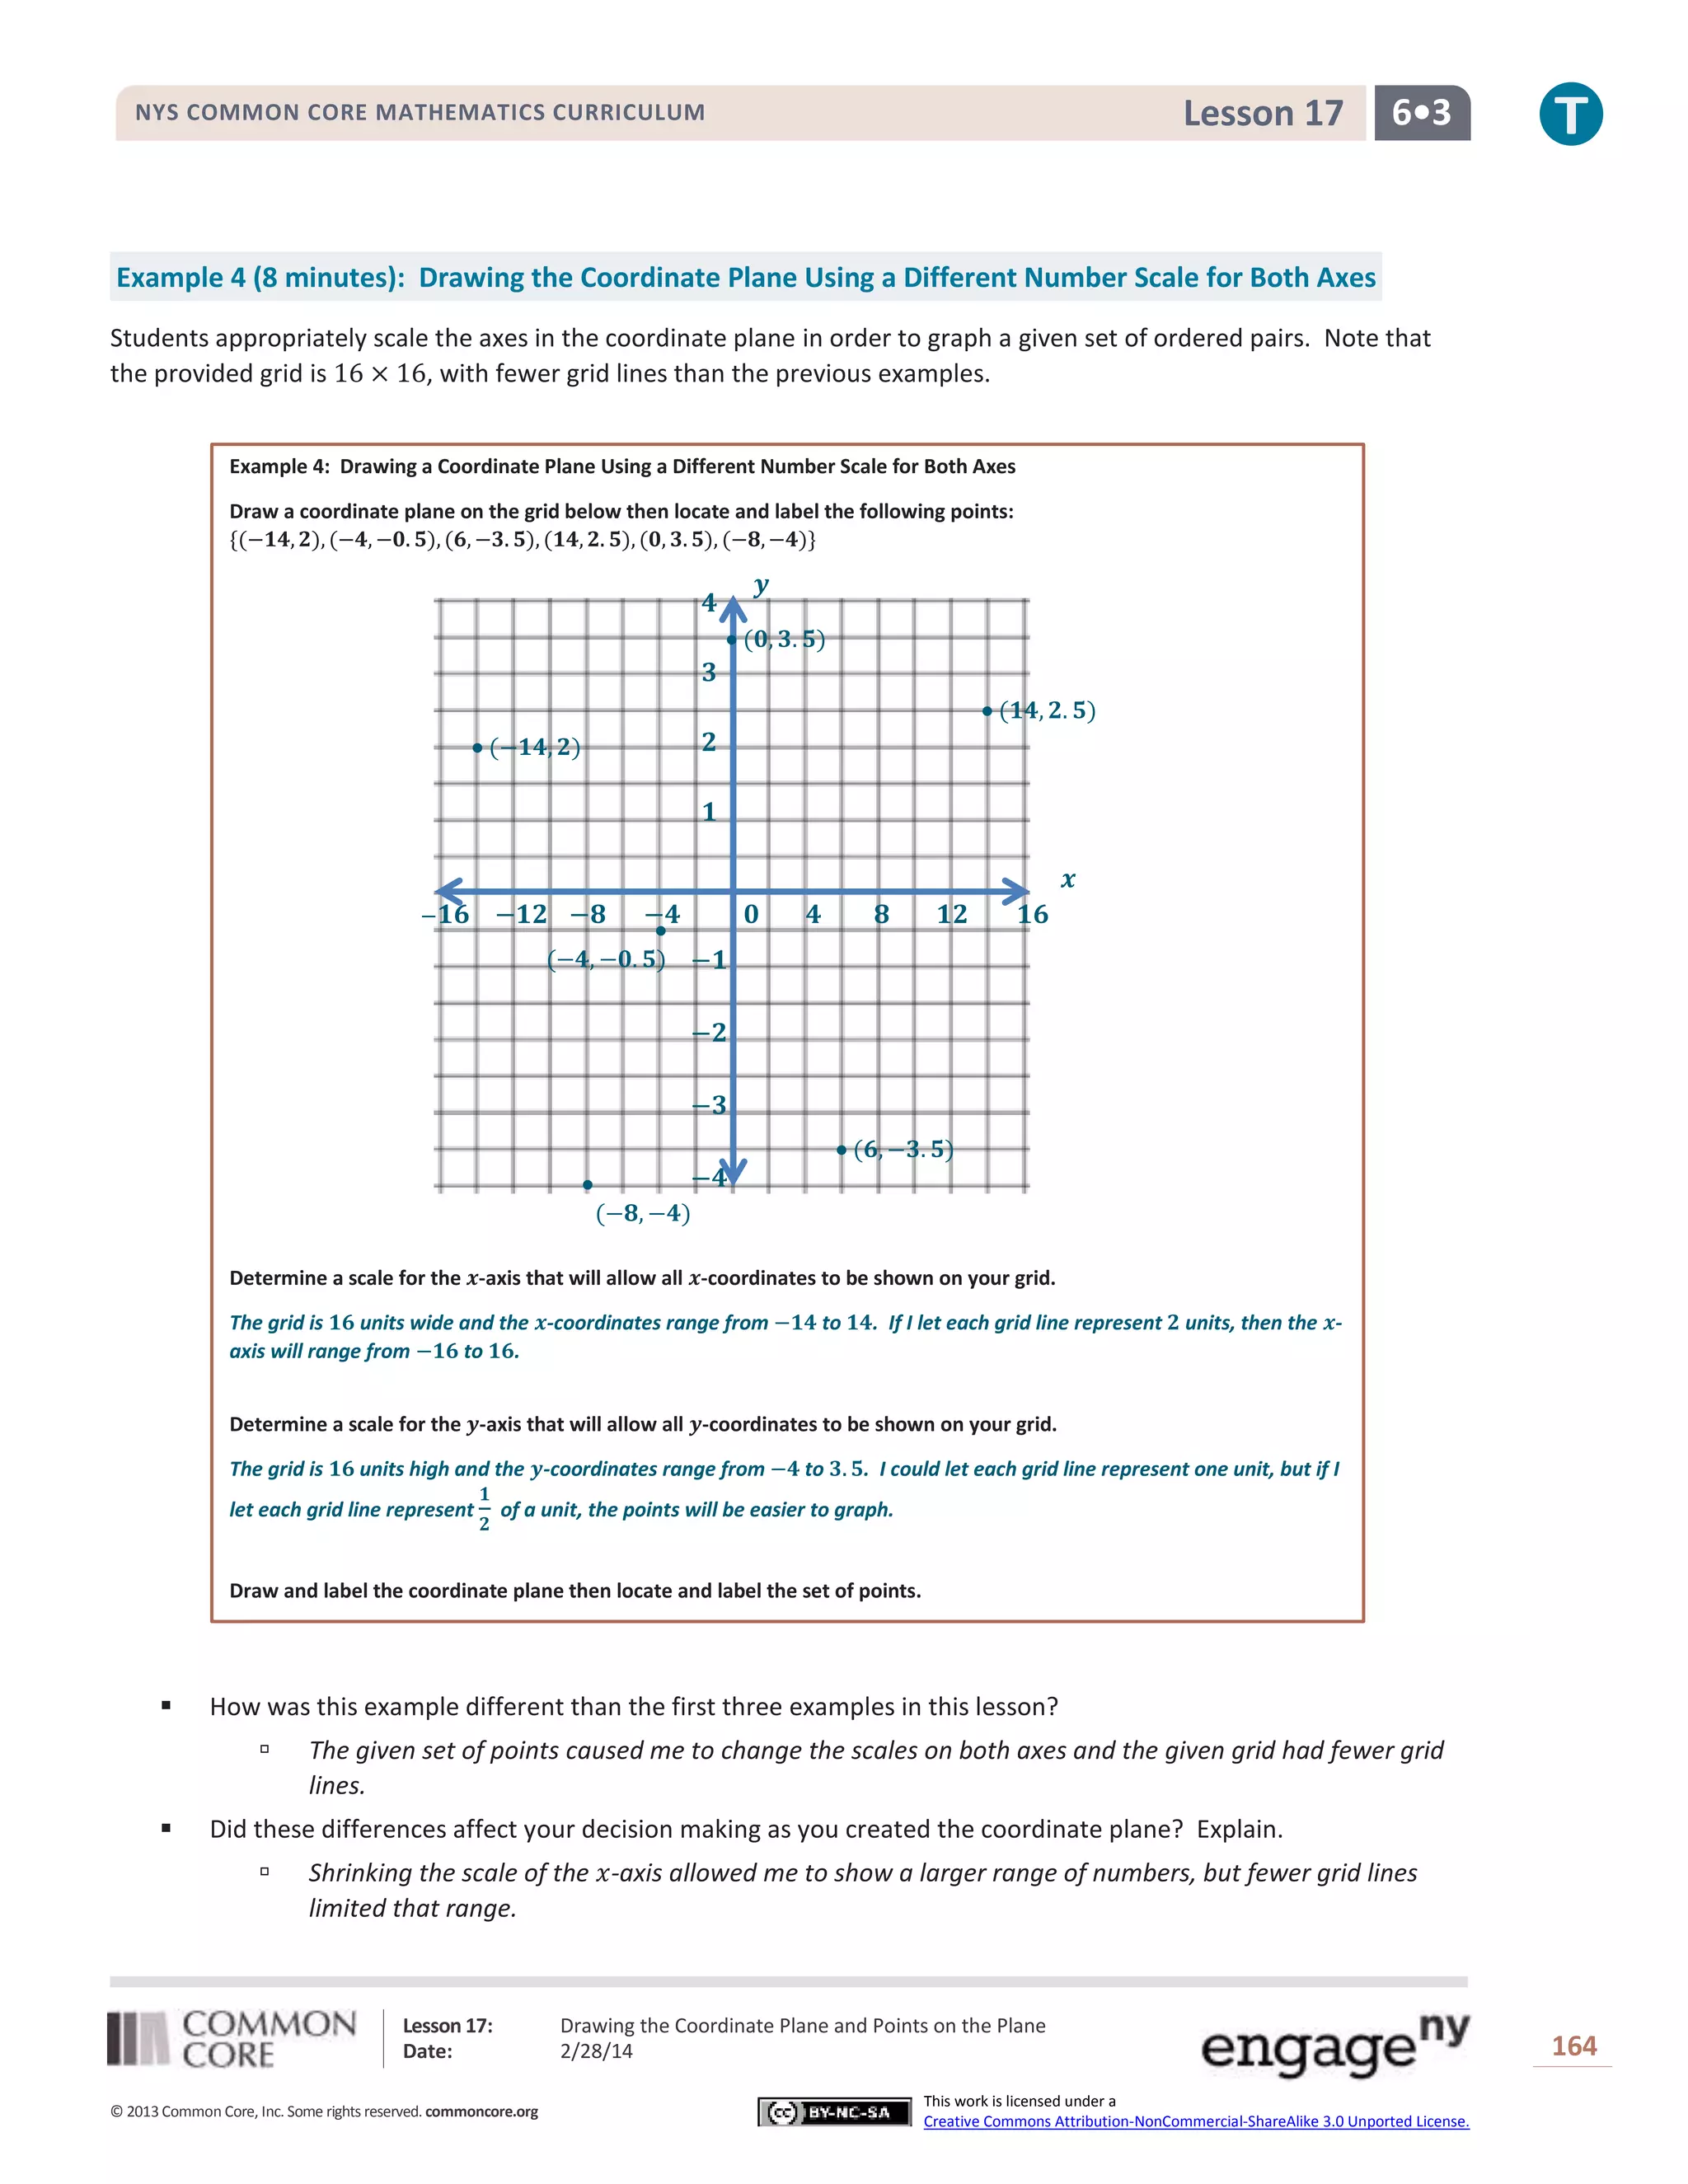
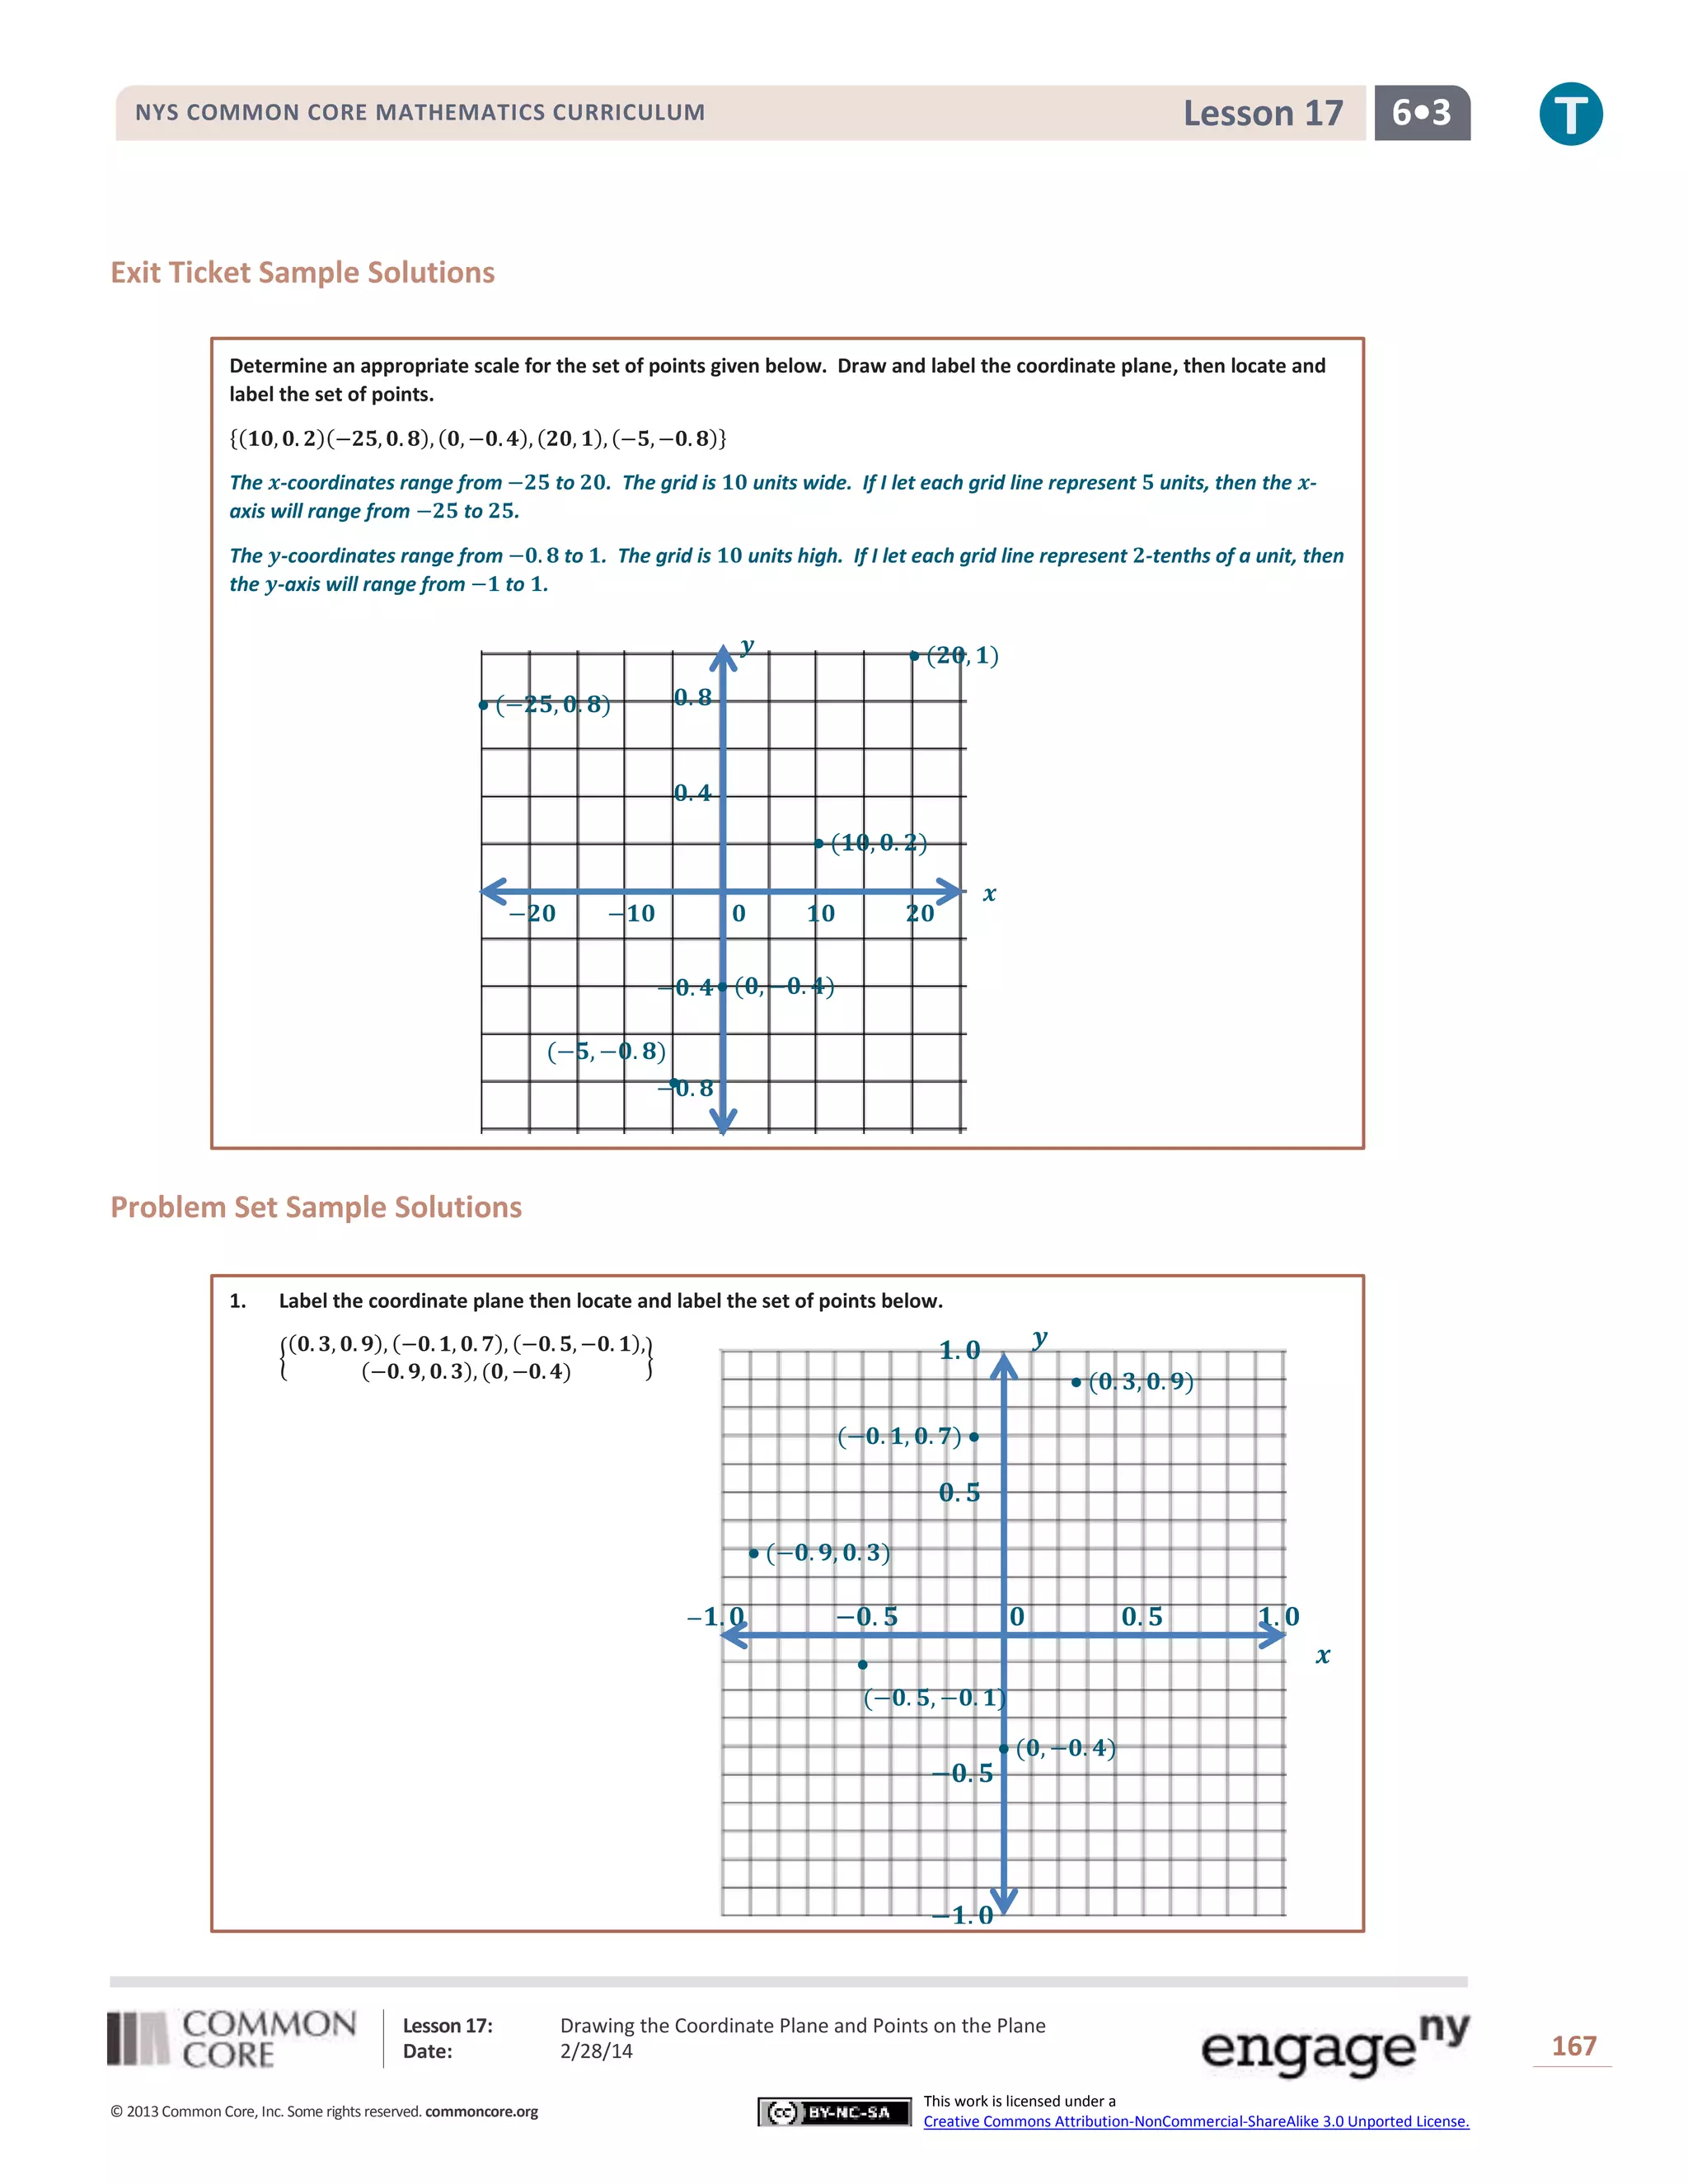
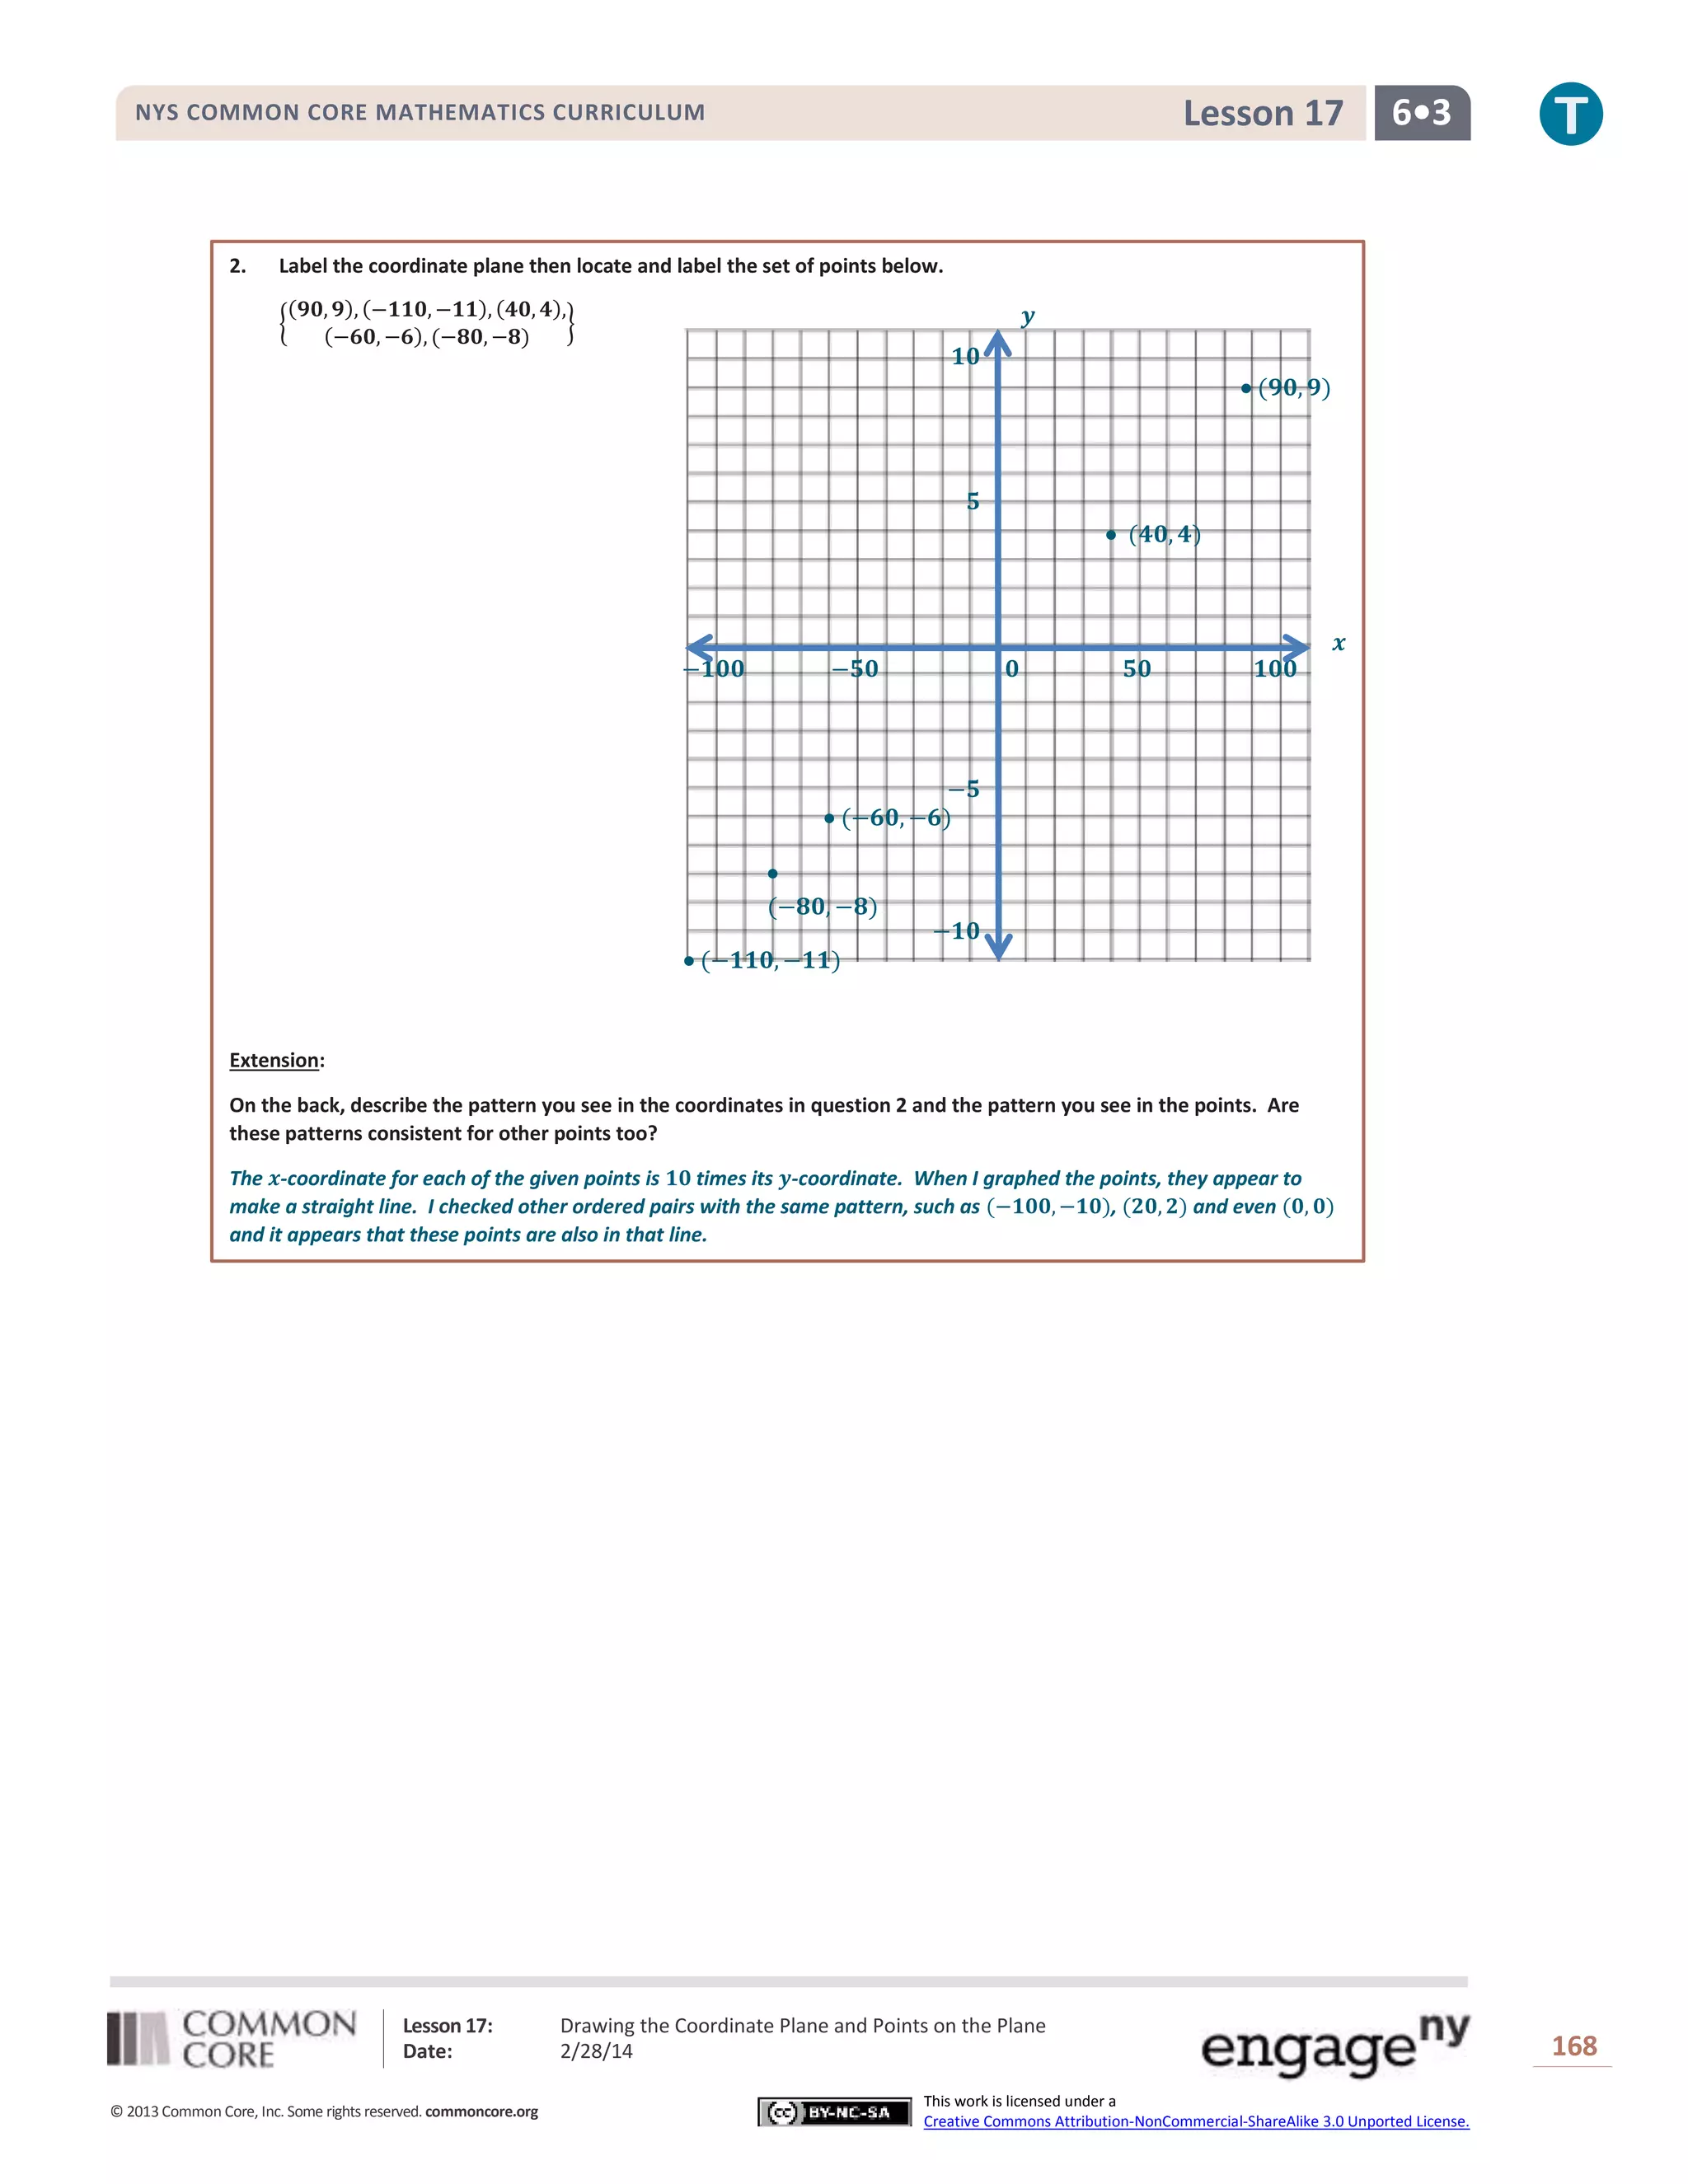
Lesson 17

NYS COMMON CORE MATHEMATICS CURRICULUM

6•3

Lesson 17: Drawing the Coordinate Plane and Points on the
Plane
Student Outcomes


Students draw a coordinate plane on graph paper in two steps: (1) Draw and order the horizontal and vertical
axes; (2) Mark the number scale on each axis.



Given some points as ordered pairs, students make reasonable choices for scales on both axes, and locate and
label the points on graph paper.

Classwork
Opening Exercise (5 minutes)
Instruct students to draw all necessary components of the coordinate plane on the blank 20 × 20 grid provided below,
placing the origin at the center of the grid and letting each grid line represent 1 unit. Observe students as they complete
the task, using their prior experience with the coordinate plane.
Opening Exercise
Draw all necessary components of the coordinate plane on the blank 𝟐𝟎 × 𝟐𝟎 grid provided below, placing the origin at
the center of the grid and letting each grid line represent 𝟏 unit.

𝟏𝟎

𝒚

𝟓

−𝟏𝟎

−𝟓

𝟎

𝟓

𝟏𝟎

𝒙

−𝟓

−𝟏𝟎

Lesson 17:
Date:
© 2013 Common Core, Inc. Some rights reserved. commoncore.org

Drawing the Coordinate Plane and Points on the Plane
2/28/14
This work is licensed under a
Creative Commons Attribution-NonCommercial-ShareAlike 3.0 Unported License.

160
Lesson 17

NYS COMMON CORE MATHEMATICS CURRICULUM

6•3

Students and teacher together discuss the need for every coordinate plane to have the following:

MP.4

The 𝑥- and 𝑦-axes drawn using a straight edge



The horizontal axis labeled 𝑥



The vertical axis labeled 𝑦



Each axis labeled using an appropriate scale as dictated by the problem or set of ordered pairs to be graphed.

Students should erase errors and make any necessary changes before proceeding to Example 1.

Example 1 (8 minutes): Drawing the Coordinate Plane using a 1:1 Scale


Is the size of the coordinate grid that we discussed in the opening exercise sufficient to graph the points given in
the set in Example 1?


Yes. All 𝑥- and 𝑦-coordinates are between −10 and 10 and both axes on the grid range from −10 to
10.

Example 1: Drawing the Coordinate Plane using a 1:1 Scale
Locate and label the points {(𝟑, 𝟐), (𝟖, 𝟒), (−𝟑, 𝟖), (−𝟐, −𝟗), (𝟎, 𝟔), (−𝟏, −𝟐), (𝟏𝟎, −𝟐)} on the grid above.

𝒚

𝟏𝟎
(−𝟑, 𝟖)

(𝟎, 𝟔)

𝟓

(𝟖, 𝟒)
(𝟑, 𝟐)

𝒙
−

𝟏𝟎

−𝟓

𝟎

𝟓

𝟏𝟎
(𝟏𝟎, −𝟐)

(−𝟏, −𝟐)


−𝟓

(−𝟐, −𝟗)



Can you name a point that could not be located on this grid? Explain.




−𝟏𝟎

The point (18, 5) could not be located on this grid because 18 is greater than 10 and therefore to the
right of 10 on the 𝑥-axis. 10 is the greatest number shown on this grid.

Discuss ways in which the point (18, 5) could be graphed without changing the size of the grid.


Changing the number of units that each grid line represents would allow us to fit greater numbers on
the axes. Changing the number of units per grid line to 2 units would allow a range of −20 to 20 on
the 𝑥-axis.

Lesson 17:
Date:
© 2013 Common Core, Inc. Some rights reserved. commoncore.org

Drawing the Coordinate Plane and Points on the Plane
2/28/14
This work is licensed under a
Creative Commons Attribution-NonCommercial-ShareAlike 3.0 Unported License.

161
Lesson 17

NYS COMMON CORE MATHEMATICS CURRICULUM

6•3

Example 2 (8 minutes): Drawing the Coordinate Plane Using an Increased Number Scale for One Axis
Students increase the number of units represented by each grid line in the coordinate plane in order to graph a given set
of ordered pairs.
Example 2: Draw the Coordinate Plane Using an Increased Number of Scale for One Axis
Draw a coordinate plane on the grid below, then locate and label the following points:
{(−𝟒, 𝟐𝟎), (−𝟑, 𝟑𝟓), (𝟏, −𝟑𝟓), (𝟔, 𝟏𝟎), (𝟗, −𝟒𝟎)}

𝒚

𝟓𝟎
 (−𝟑, 𝟑𝟓)

𝟐𝟓
 (−𝟒, 𝟐𝟎)
 (𝟔, 𝟏𝟎)

𝒙
−

𝟏𝟎

−𝟓

𝟎

𝟓

𝟏𝟎

−𝟐𝟓
 (𝟏, −𝟑𝟓)

(𝟗, −𝟒𝟎) 

−𝟓𝟎



What is the range of values used as 𝑥-coordinates? How many units should we assign per grid line to show this
range of values? Explain.




What is the range of values used as 𝑦-coordinates? How many units should we assign per grid line to show this
range of values? Explain.




The 𝑥-coordinates range from −4 to 9, all within the range of −10 to 10, so we will assign each grid
line to represent 1 unit.

The 𝑦-coordinates range from −40 to 35. If we let each grid line represent 5 units, then the 𝑥-axis will
include the range −50 to 50.

Draw and label the coordinate plane then locate and label the set of points.

Lesson 17:
Date:
© 2013 Common Core, Inc. Some rights reserved. commoncore.org

Drawing the Coordinate Plane and Points on the Plane
2/28/14
This work is licensed under a
Creative Commons Attribution-NonCommercial-ShareAlike 3.0 Unported License.

162
Lesson 17

NYS COMMON CORE MATHEMATICS CURRICULUM

6•3

Example 3 (8 minutes): Drawing the Coordinate Plane Using a Decreased Number Scale for One Axis
Students divide units among multiple grid lines in the coordinate plane in order to graph a given set of ordered pairs.
Example 3: Drawing the Coordinate Plane Using a Decreased Number Scale for One Axis
Draw a coordinate plane on the grid below, then locate and label the following points:
{(𝟎. 𝟏, 𝟒), (𝟎. 𝟓, 𝟕), (−𝟎. 𝟕, −𝟓), (−𝟎. 𝟒, 𝟑), (𝟎. 𝟖, 𝟏)}

𝟏𝟎

𝒚
 (𝟎. 𝟓, 𝟕)

𝟓
 (𝟎. 𝟏, 𝟒)

 (−𝟎. 𝟒, 𝟑)

(𝟎. 𝟖, 𝟏)

−

𝟏. 𝟎

−𝟎. 𝟓

𝟎

𝟎. 𝟓

𝒙

𝟏. 𝟎

 (−𝟎. 𝟕, −𝟓) −𝟓

−𝟏𝟎



Will either the 𝑥- or 𝑦-coordinates require a change of scale in the plane? Explain.




How could we change the number of units represented per grid line to better show the points in the given set?




The 𝑥-coordinates range from −0.7 to 0.8 which, if each grid line represented one unit, means the
points would all be very close to the 𝑦-axis, and therefore difficult to interpret.
Divide 1 unit into tenths so that each grid line represents a tenth of a unit, and the 𝑥-axis then ranges
from −1 to 1.

Draw and label the coordinate plane then locate and label the set of points.

Lesson 17:
Date:
© 2013 Common Core, Inc. Some rights reserved. commoncore.org

Drawing the Coordinate Plane and Points on the Plane
2/28/14
This work is licensed under a
Creative Commons Attribution-NonCommercial-ShareAlike 3.0 Unported License.

163
Lesson 17

NYS COMMON CORE MATHEMATICS CURRICULUM

6•3

Example 4 (8 minutes): Drawing the Coordinate Plane Using a Different Number Scale for Both Axes
Students appropriately scale the axes in the coordinate plane in order to graph a given set of ordered pairs. Note that
the provided grid is 16 × 16, with fewer grid lines than the previous examples.
Example 4: Drawing a Coordinate Plane Using a Different Number Scale for Both Axes
Draw a coordinate plane on the grid below then locate and label the following points:
{(−𝟏𝟒, 𝟐), (−𝟒, −𝟎. 𝟓), (𝟔, −𝟑. 𝟓), (𝟏𝟒, 𝟐. 𝟓), (𝟎, 𝟑. 𝟓), (−𝟖, −𝟒)}

𝒚

𝟒

 (𝟎, 𝟑. 𝟓)

𝟑
 (𝟏𝟒, 𝟐. 𝟓)

𝟐

 (−𝟏𝟒, 𝟐)

𝟏
𝒙
−

𝟏𝟔 −𝟏𝟐 −𝟖

−𝟒


(−𝟒, −𝟎. 𝟓) −𝟏

𝟎

𝟒

𝟖

𝟏𝟐

𝟏𝟔

−𝟐
−𝟑
 (𝟔, −𝟑. 𝟓)


−𝟒
(−𝟖, −𝟒)

𝟓
Determine a scale for the 𝒙-axis that will allow all 𝒙-coordinates to be shown on your grid.
The grid is 𝟏𝟔 units wide and the 𝒙-coordinates range from −𝟏𝟒 to 𝟏𝟒. If I let each grid line represent 𝟐 units, then the 𝒙axis will range from −𝟏𝟔 to 𝟏𝟔.
Determine a scale for the 𝒚-axis that will allow all 𝒚-coordinates to be shown on your grid.
The grid is 𝟏𝟔 units high and the 𝒚-coordinates range from −𝟒 to 𝟑. 𝟓. I could let each grid line represent one unit, but if I
let each grid line represent

𝟏
𝟐

of a unit, the points will be easier to graph.

Draw and label the coordinate plane then locate and label the set of points.



How was this example different than the first three examples in this lesson?




The given set of points caused me to change the scales on both axes and the given grid had fewer grid
lines.

Did these differences affect your decision making as you created the coordinate plane? Explain.


Shrinking the scale of the 𝑥-axis allowed me to show a larger range of numbers, but fewer grid lines
limited that range.

Lesson 17:
Date:
© 2013 Common Core, Inc. Some rights reserved. commoncore.org

Drawing the Coordinate Plane and Points on the Plane
2/28/14
This work is licensed under a
Creative Commons Attribution-NonCommercial-ShareAlike 3.0 Unported License.

164
Lesson 17

NYS COMMON CORE MATHEMATICS CURRICULUM

6•3

Closing (2 minutes)


Why is it important to label the axes when setting up a coordinate plane?




So that the person viewing the graph knows which axis represents which coordinate and also so they
know what scale is being used. If a person does not know the scale being used, they will likely
misinterpret the graph.

Why shouldn’t you draw and label the entire coordinate grid before looking at the points to be graphed?


Looking at the range of values in a given set of points allows you to decide whether or not a change of
scale is necessary (or desired). If you set a scale before observing the given values, you will likely have
to change the scale on your axes.

Lesson Summary


The axes of the coordinate plane must be drawn using a straight edge and labeled 𝒙 (horizontal axis) and
𝒚 (vertical axis).



Before assigning a scale to the axes it is important to assess the range of values found in a set of points,
as well as the number of grid lines available. This will allow you to determine if the number of units per
grid line should be increased or decreased so that all points can be represented on the coordinate plane
that you construct.

Exit Ticket (4 minutes)

Lesson 17:
Date:
© 2013 Common Core, Inc. Some rights reserved. commoncore.org

Drawing the Coordinate Plane and Points on the Plane
2/28/14
This work is licensed under a
Creative Commons Attribution-NonCommercial-ShareAlike 3.0 Unported License.

165
Lesson 17

NYS COMMON CORE MATHEMATICS CURRICULUM

Name ___________________________________________________

6•3

Date____________________

Lesson 17: Drawing the Coordinate Plane and Points on the Plane
Exit Ticket
Determine an appropriate scale for the set of points given below. Draw and label the coordinate plane then locate and
label the set of points.
{(10, 0.2)(−25, 0.8), (0, −0.4), (20, 1), (−5, −0.8)}

Lesson 17:
Date:
© 2013 Common Core, Inc. Some rights reserved. commoncore.org

Drawing the Coordinate Plane and Points on the Plane
2/28/14
This work is licensed under a
Creative Commons Attribution-NonCommercial-ShareAlike 3.0 Unported License.

166
Lesson 17

NYS COMMON CORE MATHEMATICS CURRICULUM

6•3

Exit Ticket Sample Solutions
Determine an appropriate scale for the set of points given below. Draw and label the coordinate plane, then locate and
label the set of points.
{(𝟏𝟎, 𝟎. 𝟐)(−𝟐𝟓, 𝟎. 𝟖), (𝟎, −𝟎. 𝟒), (𝟐𝟎, 𝟏), (−𝟓, −𝟎. 𝟖)}
The 𝒙-coordinates range from −𝟐𝟓 to 𝟐𝟎. The grid is 𝟏𝟎 units wide. If I let each grid line represent 𝟓 units, then the 𝒙axis will range from −𝟐𝟓 to 𝟐𝟓.
The 𝒚-coordinates range from −𝟎. 𝟖 to 𝟏. The grid is 𝟏𝟎 units high. If I let each grid line represent 𝟐-tenths of a unit, then
the 𝒚-axis will range from −𝟏 to 𝟏.

𝒚
 (−𝟐𝟓, 𝟎. 𝟖)

 (𝟐𝟎, 𝟏)

𝟎. 𝟖

𝟎. 𝟒
 (𝟏𝟎, 𝟎. 𝟐)
−𝟐𝟎

−𝟏𝟎

𝟎

𝟏𝟎

𝒙

𝟐𝟎

−𝟎. 𝟒  (𝟎, −𝟎. 𝟒)
(−𝟓, −𝟎. 𝟖)

−𝟎. 𝟖

Problem Set Sample Solutions
1.

Label the coordinate plane then locate and label the set of points below.
{

(𝟎. 𝟑, 𝟎. 𝟗), (−𝟎. 𝟏, 𝟎. 𝟕), (−𝟎. 𝟓, −𝟎. 𝟏),
}
(−𝟎. 𝟗, 𝟎. 𝟑), (𝟎, −𝟎. 𝟒)

𝒚

𝟏. 𝟎

 (𝟎. 𝟑, 𝟎. 𝟗)

(−𝟎. 𝟏, 𝟎. 𝟕) 

𝟎. 𝟓
 (−𝟎. 𝟗, 𝟎. 𝟑)
−

𝟏. 𝟎

−𝟎. 𝟓

𝟎


(−𝟎. 𝟓, −𝟎. 𝟏)

−𝟎. 𝟓

𝟎. 𝟓

𝟏. 𝟎
𝒙

 (𝟎, −𝟎. 𝟒)

−𝟏. 𝟎

Lesson 17:
Date:
© 2013 Common Core, Inc. Some rights reserved. commoncore.org

Drawing the Coordinate Plane and Points on the Plane
2/28/14
This work is licensed under a
Creative Commons Attribution-NonCommercial-ShareAlike 3.0 Unported License.

167
Lesson 17

NYS COMMON CORE MATHEMATICS CURRICULUM

2.

6•3

Label the coordinate plane then locate and label the set of points below.
{

(𝟗𝟎, 𝟗), (−𝟏𝟏𝟎, −𝟏𝟏), (𝟒𝟎, 𝟒),
}
(−𝟔𝟎, −𝟔), (−𝟖𝟎, −𝟖)

𝒚
𝟏𝟎
 (𝟗𝟎, 𝟗)

𝟓
 (𝟒𝟎, 𝟒)

𝒙
−𝟏𝟎𝟎

−𝟓𝟎

𝟎

𝟓𝟎

𝟏𝟎𝟎

−𝟓
 (−𝟔𝟎, −𝟔)

(−𝟖𝟎, −𝟖)
 (−𝟏𝟏𝟎, −𝟏𝟏)

−𝟏𝟎

Extension:
On the back, describe the pattern you see in the coordinates in question 2 and the pattern you see in the points. Are
these patterns consistent for other points too?
The 𝒙-coordinate for each of the given points is 𝟏𝟎 times its 𝒚-coordinate. When I graphed the points, they appear to
make a straight line. I checked other ordered pairs with the same pattern, such as (−𝟏𝟎𝟎, −𝟏𝟎), (𝟐𝟎, 𝟐) and even (𝟎, 𝟎)
and it appears that these points are also in that line.

Lesson 17:
Date:
© 2013 Common Core, Inc. Some rights reserved. commoncore.org

Drawing the Coordinate Plane and Points on the Plane
2/28/14
This work is licensed under a
Creative Commons Attribution-NonCommercial-ShareAlike 3.0 Unported License.

168

G6 m3-c-lesson 17-t

  • 1.
    Lesson 17 NYS COMMONCORE MATHEMATICS CURRICULUM 6•3 Lesson 17: Drawing the Coordinate Plane and Points on the Plane Student Outcomes  Students draw a coordinate plane on graph paper in two steps: (1) Draw and order the horizontal and vertical axes; (2) Mark the number scale on each axis.  Given some points as ordered pairs, students make reasonable choices for scales on both axes, and locate and label the points on graph paper. Classwork Opening Exercise (5 minutes) Instruct students to draw all necessary components of the coordinate plane on the blank 20 × 20 grid provided below, placing the origin at the center of the grid and letting each grid line represent 1 unit. Observe students as they complete the task, using their prior experience with the coordinate plane. Opening Exercise Draw all necessary components of the coordinate plane on the blank 𝟐𝟎 × 𝟐𝟎 grid provided below, placing the origin at the center of the grid and letting each grid line represent 𝟏 unit. 𝟏𝟎 𝒚 𝟓 −𝟏𝟎 −𝟓 𝟎 𝟓 𝟏𝟎 𝒙 −𝟓 −𝟏𝟎 Lesson 17: Date: © 2013 Common Core, Inc. Some rights reserved. commoncore.org Drawing the Coordinate Plane and Points on the Plane 2/28/14 This work is licensed under a Creative Commons Attribution-NonCommercial-ShareAlike 3.0 Unported License. 160
  • 2.
    Lesson 17 NYS COMMONCORE MATHEMATICS CURRICULUM 6•3 Students and teacher together discuss the need for every coordinate plane to have the following:  MP.4 The 𝑥- and 𝑦-axes drawn using a straight edge  The horizontal axis labeled 𝑥  The vertical axis labeled 𝑦  Each axis labeled using an appropriate scale as dictated by the problem or set of ordered pairs to be graphed. Students should erase errors and make any necessary changes before proceeding to Example 1. Example 1 (8 minutes): Drawing the Coordinate Plane using a 1:1 Scale  Is the size of the coordinate grid that we discussed in the opening exercise sufficient to graph the points given in the set in Example 1?  Yes. All 𝑥- and 𝑦-coordinates are between −10 and 10 and both axes on the grid range from −10 to 10. Example 1: Drawing the Coordinate Plane using a 1:1 Scale Locate and label the points {(𝟑, 𝟐), (𝟖, 𝟒), (−𝟑, 𝟖), (−𝟐, −𝟗), (𝟎, 𝟔), (−𝟏, −𝟐), (𝟏𝟎, −𝟐)} on the grid above. 𝒚 𝟏𝟎 (−𝟑, 𝟖) (𝟎, 𝟔) 𝟓 (𝟖, 𝟒) (𝟑, 𝟐) 𝒙 − 𝟏𝟎 −𝟓 𝟎 𝟓 𝟏𝟎 (𝟏𝟎, −𝟐) (−𝟏, −𝟐)  −𝟓 (−𝟐, −𝟗)  Can you name a point that could not be located on this grid? Explain.   −𝟏𝟎 The point (18, 5) could not be located on this grid because 18 is greater than 10 and therefore to the right of 10 on the 𝑥-axis. 10 is the greatest number shown on this grid. Discuss ways in which the point (18, 5) could be graphed without changing the size of the grid.  Changing the number of units that each grid line represents would allow us to fit greater numbers on the axes. Changing the number of units per grid line to 2 units would allow a range of −20 to 20 on the 𝑥-axis. Lesson 17: Date: © 2013 Common Core, Inc. Some rights reserved. commoncore.org Drawing the Coordinate Plane and Points on the Plane 2/28/14 This work is licensed under a Creative Commons Attribution-NonCommercial-ShareAlike 3.0 Unported License. 161
  • 3.
    Lesson 17 NYS COMMONCORE MATHEMATICS CURRICULUM 6•3 Example 2 (8 minutes): Drawing the Coordinate Plane Using an Increased Number Scale for One Axis Students increase the number of units represented by each grid line in the coordinate plane in order to graph a given set of ordered pairs. Example 2: Draw the Coordinate Plane Using an Increased Number of Scale for One Axis Draw a coordinate plane on the grid below, then locate and label the following points: {(−𝟒, 𝟐𝟎), (−𝟑, 𝟑𝟓), (𝟏, −𝟑𝟓), (𝟔, 𝟏𝟎), (𝟗, −𝟒𝟎)} 𝒚 𝟓𝟎  (−𝟑, 𝟑𝟓) 𝟐𝟓  (−𝟒, 𝟐𝟎)  (𝟔, 𝟏𝟎) 𝒙 − 𝟏𝟎 −𝟓 𝟎 𝟓 𝟏𝟎 −𝟐𝟓  (𝟏, −𝟑𝟓) (𝟗, −𝟒𝟎)  −𝟓𝟎  What is the range of values used as 𝑥-coordinates? How many units should we assign per grid line to show this range of values? Explain.   What is the range of values used as 𝑦-coordinates? How many units should we assign per grid line to show this range of values? Explain.   The 𝑥-coordinates range from −4 to 9, all within the range of −10 to 10, so we will assign each grid line to represent 1 unit. The 𝑦-coordinates range from −40 to 35. If we let each grid line represent 5 units, then the 𝑥-axis will include the range −50 to 50. Draw and label the coordinate plane then locate and label the set of points. Lesson 17: Date: © 2013 Common Core, Inc. Some rights reserved. commoncore.org Drawing the Coordinate Plane and Points on the Plane 2/28/14 This work is licensed under a Creative Commons Attribution-NonCommercial-ShareAlike 3.0 Unported License. 162
  • 4.
    Lesson 17 NYS COMMONCORE MATHEMATICS CURRICULUM 6•3 Example 3 (8 minutes): Drawing the Coordinate Plane Using a Decreased Number Scale for One Axis Students divide units among multiple grid lines in the coordinate plane in order to graph a given set of ordered pairs. Example 3: Drawing the Coordinate Plane Using a Decreased Number Scale for One Axis Draw a coordinate plane on the grid below, then locate and label the following points: {(𝟎. 𝟏, 𝟒), (𝟎. 𝟓, 𝟕), (−𝟎. 𝟕, −𝟓), (−𝟎. 𝟒, 𝟑), (𝟎. 𝟖, 𝟏)} 𝟏𝟎 𝒚  (𝟎. 𝟓, 𝟕) 𝟓  (𝟎. 𝟏, 𝟒)  (−𝟎. 𝟒, 𝟑) (𝟎. 𝟖, 𝟏)  − 𝟏. 𝟎 −𝟎. 𝟓 𝟎 𝟎. 𝟓 𝒙 𝟏. 𝟎  (−𝟎. 𝟕, −𝟓) −𝟓 −𝟏𝟎  Will either the 𝑥- or 𝑦-coordinates require a change of scale in the plane? Explain.   How could we change the number of units represented per grid line to better show the points in the given set?   The 𝑥-coordinates range from −0.7 to 0.8 which, if each grid line represented one unit, means the points would all be very close to the 𝑦-axis, and therefore difficult to interpret. Divide 1 unit into tenths so that each grid line represents a tenth of a unit, and the 𝑥-axis then ranges from −1 to 1. Draw and label the coordinate plane then locate and label the set of points. Lesson 17: Date: © 2013 Common Core, Inc. Some rights reserved. commoncore.org Drawing the Coordinate Plane and Points on the Plane 2/28/14 This work is licensed under a Creative Commons Attribution-NonCommercial-ShareAlike 3.0 Unported License. 163
  • 5.
    Lesson 17 NYS COMMONCORE MATHEMATICS CURRICULUM 6•3 Example 4 (8 minutes): Drawing the Coordinate Plane Using a Different Number Scale for Both Axes Students appropriately scale the axes in the coordinate plane in order to graph a given set of ordered pairs. Note that the provided grid is 16 × 16, with fewer grid lines than the previous examples. Example 4: Drawing a Coordinate Plane Using a Different Number Scale for Both Axes Draw a coordinate plane on the grid below then locate and label the following points: {(−𝟏𝟒, 𝟐), (−𝟒, −𝟎. 𝟓), (𝟔, −𝟑. 𝟓), (𝟏𝟒, 𝟐. 𝟓), (𝟎, 𝟑. 𝟓), (−𝟖, −𝟒)} 𝒚 𝟒  (𝟎, 𝟑. 𝟓) 𝟑  (𝟏𝟒, 𝟐. 𝟓) 𝟐  (−𝟏𝟒, 𝟐) 𝟏 𝒙 − 𝟏𝟔 −𝟏𝟐 −𝟖 −𝟒  (−𝟒, −𝟎. 𝟓) −𝟏 𝟎 𝟒 𝟖 𝟏𝟐 𝟏𝟔 −𝟐 −𝟑  (𝟔, −𝟑. 𝟓)  −𝟒 (−𝟖, −𝟒) 𝟓 Determine a scale for the 𝒙-axis that will allow all 𝒙-coordinates to be shown on your grid. The grid is 𝟏𝟔 units wide and the 𝒙-coordinates range from −𝟏𝟒 to 𝟏𝟒. If I let each grid line represent 𝟐 units, then the 𝒙axis will range from −𝟏𝟔 to 𝟏𝟔. Determine a scale for the 𝒚-axis that will allow all 𝒚-coordinates to be shown on your grid. The grid is 𝟏𝟔 units high and the 𝒚-coordinates range from −𝟒 to 𝟑. 𝟓. I could let each grid line represent one unit, but if I let each grid line represent 𝟏 𝟐 of a unit, the points will be easier to graph. Draw and label the coordinate plane then locate and label the set of points.  How was this example different than the first three examples in this lesson?   The given set of points caused me to change the scales on both axes and the given grid had fewer grid lines. Did these differences affect your decision making as you created the coordinate plane? Explain.  Shrinking the scale of the 𝑥-axis allowed me to show a larger range of numbers, but fewer grid lines limited that range. Lesson 17: Date: © 2013 Common Core, Inc. Some rights reserved. commoncore.org Drawing the Coordinate Plane and Points on the Plane 2/28/14 This work is licensed under a Creative Commons Attribution-NonCommercial-ShareAlike 3.0 Unported License. 164
  • 6.
    Lesson 17 NYS COMMONCORE MATHEMATICS CURRICULUM 6•3 Closing (2 minutes)  Why is it important to label the axes when setting up a coordinate plane?   So that the person viewing the graph knows which axis represents which coordinate and also so they know what scale is being used. If a person does not know the scale being used, they will likely misinterpret the graph. Why shouldn’t you draw and label the entire coordinate grid before looking at the points to be graphed?  Looking at the range of values in a given set of points allows you to decide whether or not a change of scale is necessary (or desired). If you set a scale before observing the given values, you will likely have to change the scale on your axes. Lesson Summary  The axes of the coordinate plane must be drawn using a straight edge and labeled 𝒙 (horizontal axis) and 𝒚 (vertical axis).  Before assigning a scale to the axes it is important to assess the range of values found in a set of points, as well as the number of grid lines available. This will allow you to determine if the number of units per grid line should be increased or decreased so that all points can be represented on the coordinate plane that you construct. Exit Ticket (4 minutes) Lesson 17: Date: © 2013 Common Core, Inc. Some rights reserved. commoncore.org Drawing the Coordinate Plane and Points on the Plane 2/28/14 This work is licensed under a Creative Commons Attribution-NonCommercial-ShareAlike 3.0 Unported License. 165
  • 7.
    Lesson 17 NYS COMMONCORE MATHEMATICS CURRICULUM Name ___________________________________________________ 6•3 Date____________________ Lesson 17: Drawing the Coordinate Plane and Points on the Plane Exit Ticket Determine an appropriate scale for the set of points given below. Draw and label the coordinate plane then locate and label the set of points. {(10, 0.2)(−25, 0.8), (0, −0.4), (20, 1), (−5, −0.8)} Lesson 17: Date: © 2013 Common Core, Inc. Some rights reserved. commoncore.org Drawing the Coordinate Plane and Points on the Plane 2/28/14 This work is licensed under a Creative Commons Attribution-NonCommercial-ShareAlike 3.0 Unported License. 166
  • 8.
    Lesson 17 NYS COMMONCORE MATHEMATICS CURRICULUM 6•3 Exit Ticket Sample Solutions Determine an appropriate scale for the set of points given below. Draw and label the coordinate plane, then locate and label the set of points. {(𝟏𝟎, 𝟎. 𝟐)(−𝟐𝟓, 𝟎. 𝟖), (𝟎, −𝟎. 𝟒), (𝟐𝟎, 𝟏), (−𝟓, −𝟎. 𝟖)} The 𝒙-coordinates range from −𝟐𝟓 to 𝟐𝟎. The grid is 𝟏𝟎 units wide. If I let each grid line represent 𝟓 units, then the 𝒙axis will range from −𝟐𝟓 to 𝟐𝟓. The 𝒚-coordinates range from −𝟎. 𝟖 to 𝟏. The grid is 𝟏𝟎 units high. If I let each grid line represent 𝟐-tenths of a unit, then the 𝒚-axis will range from −𝟏 to 𝟏. 𝒚  (−𝟐𝟓, 𝟎. 𝟖)  (𝟐𝟎, 𝟏) 𝟎. 𝟖 𝟎. 𝟒  (𝟏𝟎, 𝟎. 𝟐) −𝟐𝟎 −𝟏𝟎 𝟎 𝟏𝟎 𝒙 𝟐𝟎 −𝟎. 𝟒  (𝟎, −𝟎. 𝟒) (−𝟓, −𝟎. 𝟖)  −𝟎. 𝟖 Problem Set Sample Solutions 1. Label the coordinate plane then locate and label the set of points below. { (𝟎. 𝟑, 𝟎. 𝟗), (−𝟎. 𝟏, 𝟎. 𝟕), (−𝟎. 𝟓, −𝟎. 𝟏), } (−𝟎. 𝟗, 𝟎. 𝟑), (𝟎, −𝟎. 𝟒) 𝒚 𝟏. 𝟎  (𝟎. 𝟑, 𝟎. 𝟗) (−𝟎. 𝟏, 𝟎. 𝟕)  𝟎. 𝟓  (−𝟎. 𝟗, 𝟎. 𝟑) − 𝟏. 𝟎 −𝟎. 𝟓 𝟎  (−𝟎. 𝟓, −𝟎. 𝟏) −𝟎. 𝟓 𝟎. 𝟓 𝟏. 𝟎 𝒙  (𝟎, −𝟎. 𝟒) −𝟏. 𝟎 Lesson 17: Date: © 2013 Common Core, Inc. Some rights reserved. commoncore.org Drawing the Coordinate Plane and Points on the Plane 2/28/14 This work is licensed under a Creative Commons Attribution-NonCommercial-ShareAlike 3.0 Unported License. 167
  • 9.
    Lesson 17 NYS COMMONCORE MATHEMATICS CURRICULUM 2. 6•3 Label the coordinate plane then locate and label the set of points below. { (𝟗𝟎, 𝟗), (−𝟏𝟏𝟎, −𝟏𝟏), (𝟒𝟎, 𝟒), } (−𝟔𝟎, −𝟔), (−𝟖𝟎, −𝟖) 𝒚 𝟏𝟎  (𝟗𝟎, 𝟗) 𝟓  (𝟒𝟎, 𝟒) 𝒙 −𝟏𝟎𝟎 −𝟓𝟎 𝟎 𝟓𝟎 𝟏𝟎𝟎 −𝟓  (−𝟔𝟎, −𝟔)  (−𝟖𝟎, −𝟖)  (−𝟏𝟏𝟎, −𝟏𝟏) −𝟏𝟎 Extension: On the back, describe the pattern you see in the coordinates in question 2 and the pattern you see in the points. Are these patterns consistent for other points too? The 𝒙-coordinate for each of the given points is 𝟏𝟎 times its 𝒚-coordinate. When I graphed the points, they appear to make a straight line. I checked other ordered pairs with the same pattern, such as (−𝟏𝟎𝟎, −𝟏𝟎), (𝟐𝟎, 𝟐) and even (𝟎, 𝟎) and it appears that these points are also in that line. Lesson 17: Date: © 2013 Common Core, Inc. Some rights reserved. commoncore.org Drawing the Coordinate Plane and Points on the Plane 2/28/14 This work is licensed under a Creative Commons Attribution-NonCommercial-ShareAlike 3.0 Unported License. 168