Download to read offline

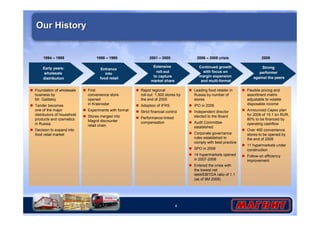
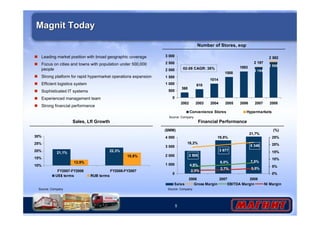
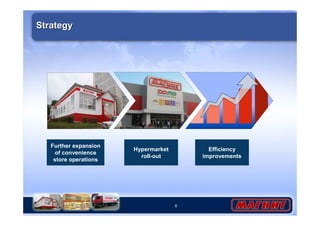
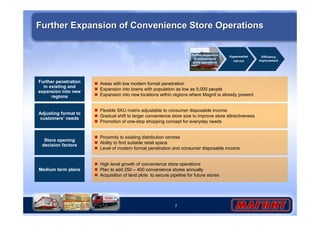
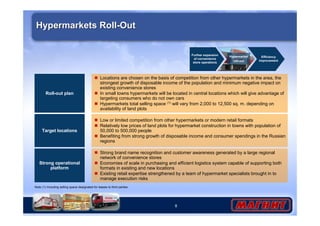
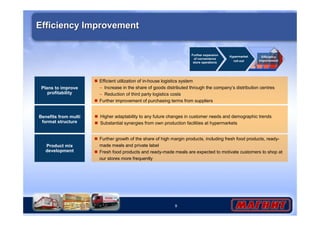

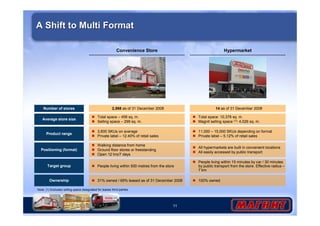

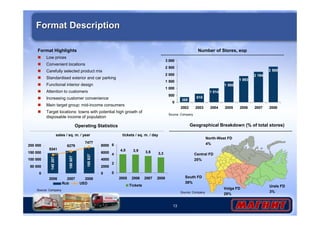
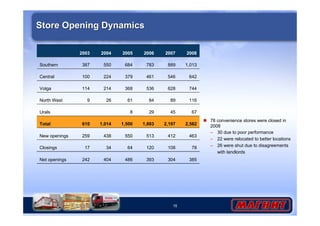
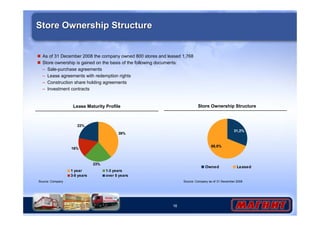

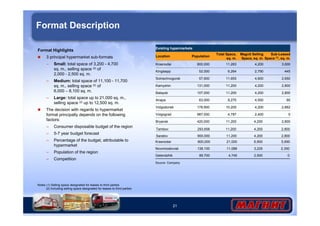


The document summarizes Magnit's 2008 results and provides an overview of its business. It discusses Magnit's continued expansion of its convenience store operations, with plans to add 250-400 stores annually. It also outlines Magnit's strategy to rollout hypermarkets in smaller Russian towns, with a target of 11 hypermarkets under construction by the end of 2009. The document highlights Magnit's focus on ongoing efficiency improvements across its expanding multi-format operations.


