THIS PRESENTATION IS BEING PROVIDED TO YOU SOLELY FOR YOUR INFORMATION AND MAY NOT BE REPRODUCED OR PUBLISHED (IN WHOLE OR INPART) OR FURTHER DISTRIBUTED TO ANY PERSON FOR ANY PURPOSE.
THIS PRESENTATION ISBEING PROVIDED TO YOU SOLELY FOR YOUR INFORMATION AND MAY NOT BE REPRODUCED OR PUBLISHED (IN WHOLE OR INPART) OR FURTHER DISTRIBUTED TO ANY PERSON FOR ANY PURPOSE.
IMPORTANT: You must read the following before continuing. This presentation, which includes oral statements made or videos shown at the presentation hereof, any question and answer session and any written or oral material discussed or distributed during the meeting to present this
document or otherwise in connection with it (this “Presentation”) contains confidential information regarding Akciju sabiedrība "Attīstības finanšu institūcija ALTUM" (the “Company”), and is being provided on a strictly confidential basis. This Presentation has been prepared by the Company
for information purposes only in connection with preliminary discussions relating to the Company as set out in this Presentation and may in particular not be used in making any investment decision.
This Presentation is strictly confidential and may not be copied, reproduced, redistributed or passed on, in whole or in part, or disclosed, directly or indirectly, to any other person or published, in whole or in part, by any medium or for any purpose. Any unauthorized disclosure of this
Presentation or any information contained in or relating to it could damage the interests of the Company and have serious consequences. This Presentation is being distributed to selected recipients only and is not intended for distribution to, or use by any person or entity in, any jurisdiction
or country where such distribution or use would be contrary to local law or regulation. By receiving this Presentation, the recipient agrees that it will not distribute, disclose, or provide any information or material disclosed in this Presentation to any other person.
This Presentation was prepared solely based on information obtained from the Company and public sources on or prior to the date hereof and has not been independently verified. This Presentation only contains summary information and no representation or warranty, express or implied, is
or will be made in relation to and no reliance should be placed on the fairness, accuracy, correctness or completeness of the information or opinions contained in this Presentation.
In addition, certain information in this Presentation is based on management estimates. Such estimates have been made in good faith and represent the beliefs of applicable members of management at the moment of preparing this Presentation. Those management members believe
that such estimates are founded on reasonable grounds. However, by their nature, estimates may not be correct or complete. Accordingly, no representation or warranty (expressor implied) is given that such estimates are correct or complete.
Further, this Presentation may include market and industry data obtained by the Company from industry publications and surveys. The Company may not have access to the facts and assumptions underlying the numerical data, market data and other information extracted from public
sources and as a result neither the Company nor any of the Company’s advisors or representatives are able to verify such information, and assume no responsibility for the correctness of any such information. To the extent available, the industry, market and competitive position data
contained in this Presentation has come from official or third party sources. Third party industry publications, studies and surveys generally state that the data contained therein have been obtained from sources believed to be reliable, but that there is no guarantee of the accuracy,
correctness, fairness or completeness of such data. While the Company believes that each of these publications, studies and surveys has been prepared by a reputable source, the Company has not independently verified the data contained therein and do not accept any liability for
their accuracy, correctness, fairness or completeness.
This Presentation may contain certain financial information and operating data that has not been audited nor reviewed by the Company’s auditors. Such financial information and operating data is based on the Company’s internal estimates, assumptions, calculations, expectations and
business plan and strategy. Some of these number may be subject to further review in due course, may be amended and the final numbers may differ from those set out in the Presentation.
Any information contained or views expressed in this Presentation do not purport to be comprehensive and are based on financial, economic, market and other conditions prevailing as of the date of this Presentation and are subject to change without notice. Neither the Company nor
any other person undertakes any obligation to update or revise any information or statement contained in the Presentation, whether as a result of new information, future events or otherwise, except to the extent required by law. The information contained in the Presentation may not be
relied upon for any purpose. Neither the Company nor any other person, legal or natural, accepts any responsibility, obligation or liability in any manner whatsoever for any information contained in this Presentation.
This Presentation contains forward-looking statements, which are based on current expectations, projections and assumptions about future events. Statements contained in the Presentation, other than statements of historical fact, regarding future events or prospects, are forward-looking
statements. The words “may”, “will”, “should”, “expect”, “anticipate”, “believe”, “estimate”, “plan”, “predict”, “intend” or variations of these words, as well as other statements regarding matters that are not historical fact or regarding future events or prospects, constitute forward-looking
statements. Any forward-looking statements in this Presentation are based on the Company’s current assumptions and expectations and, by their nature, forward-looking statements are subject to a number of risks and uncertainties, many of which are beyond the Company’s control, that
could cause actual business results and performance to differ materially from any expected future results or performance expressed or implied by any forward-looking statements. You are cautioned not to place undue reliance on any forward-looking statements. Neither the Company, nor
any of its directors, officers, employees, agents, affiliates or advisers accepts any responsibility whatsoever for the reasonableness of assumptions made or opinions stated or the likelihood of the achievement of projections, prospects or returns. Any responsibility or liability for any such
information is expressly disclaimed. Nothing in this Presentation is, or should be relied upon as, a promise or representation of the future. In addition, no statement in this Presentation is intended to be nor may be construed as a profit forecast. Past performance of the Company cannot be
relied on as a guide to future performance.
The financial information included in this Presentation includes certain non-IFRS measures which are not accounting measures as defined by the International Financial Reporting Standards as adopted by the European Union (“IFRS”). The Company has presented these measures because it
believes that they are useful indication so fits financial performance and can assist the reader of this document in evaluating the Company’s business. However, these measures should not be used instead of, or considered alternatives to, the audited consolidated financial statements of
the Company based on IFRS.
Certain figures contained in this Presentation, including financial information, have been subject to rounding adjustments. Accordingly, in certain instances, the sum or percentage change of the numbers contained in this Presentation may not conform exactly to the total figure given.
Neither the Company, any of its shareholders, nor any of their respective directors, officers, employees, agents, affiliates or advisers accepts any responsibility whatsoever for any direct, indirect or consequential loss or damage suffered by any person as a result of relying on any statement in
or omission from this Presentation or any other written or oral communication and (save in the case of fraud) any such liability is expressly disclaimed.
This Presentation is not directed to, or intended for distribution to or use by, any person or entity that is a citizen or resident or located in any locality, state, country or other jurisdiction where such distribution, publication, availability or use would be contrary to law or regulation or which
would require any registration or licensing within such jurisdiction. THIS PRESENTATION IS NOT FOR PUBLICATION, RELEASE OR DISTRIBUTION, DIRECTLY OR INDIRECTLY, INTO THE UNITED STATES, AUSTRALIA, CANADA, JAPAN, HONG KONG, SOUTH AFRICA, SINGAPORE, RUSSIA, BELARUS OR ANY
OTHER JURISDICTION IN WHICH SUCH PUBLICATION, RELEASE OR DISTRIBUTION WOULD BE UNLAWFUL.
This Presentation does not constitute and is not intended to form part of any offer, or the solicitation of any offer, to buy, subscribe for or sell any securities of the Company or any subsidiary of the Company and nothing in this Presentation shall in any way constitute or form part of any legal
agreement or be relied on in connection with, any contract, commitment or investment decision. Each recipient of the information contained in this Presentation is responsible for making its own independent assessment of the business, financial condition, prospects, status and affairs of the
Company. No person shall have any right of action against the Company or any other person in relation to the accuracy or completeness of the information contained in the Presentation.
This Presentation and the information contained herein are not a solicitation of an offer to buy securities or an offer for the sale of securities in the United States (within the meaning of Regulation S under the United States Securities Act of 1933, as amended (the “Securities Act”)). The
Company has not and does not expect to register any securities that it may offer under the Securities Act, or the securities laws of any state of the United States or any other jurisdiction thereof, and any such securities may not be offered or sold in the United States absent registration under
the Securities Act or an available exemption from it.
This Presentation does not constitute a prospectus for the purposes of Regulation (EU) 2017/1129, as amended of the European Parliament and of the Council of 14 June 2017 on the prospectus to be published when securities are offered to the public or admitted to trading on a regulated
market, and repealing Directive 2003/71/EC (the “EU Prospectus Regulation”). This Presentation is only addressed to and directed at persons in member states of the European Economic Area (the “EEA”) who are “qualified investors” within the meaning of Article 2(e) of the EU Prospectus
Regulation (“Qualified Investors”). This Presentation and its contents must not be acted on or relied upon in any member state of the EEA by persons who are not Qualified Investors . The communication of this Presentation in any member state of the EEA (other than the United Kingdom) to
persons who are not Qualified Investors is unauthorized and may contravene applicable law.
Nothing in this Presentation constitutes investment advice and any recommendations that may be contained herein have not been based upon a consideration of the investment objectives, financial situation or particular needs of any specific recipient. If you have received this
Presentation and you are in the EEA and are not a Qualified Investor, you must return it immediately to the Company.
This Presentation, including this disclaimer, shall be governed by and construed in accordance with the laws of the Republic of Latvia, and any claim arising out of, relating to or in connection with this Presentation shall be governed by the laws of the Republic of Latvia. By accepting this
Presentation, you hereby submit to the jurisdiction of the courts of the Republic of Latvia for the purposes of any suit, action or other proceeding arising out of, relating to or in connection with this Presentation.
By accepting this Presentation you agree to be bound by the above terms and undertake to act in accordance with them.
LEGAL DISCLAIMER
General Information
Key CreditHighlights
Portfolio Overview
Operating Model and Performance
Sustainable Financing
Financial Profile
Transaction Overview
5.
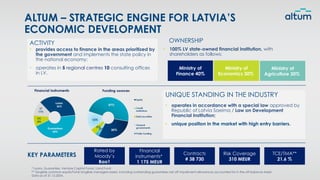
ALTUM – STRATEGICENGINE FOR LATVIA’S
ECONOMIC DEVELOPMENT
• provides access to finance in the areas prioritized by
the government and implements the state policy in
the national economy;
• operates in 5 regional centres 10 consulting offices
in LV.
• 100% LV state-owned financial institution, with
shareholders as follows:
OWNERSHIP
ACTIVITY
• operates in accordance with a special law approved by
Republic of Latvia Saeima / Law on Development
Financial Institution;
• unique position in the market with high entry barriers.
UNIQUE STANDING IN THE INDUSTRY
* Loans, Guaranties, Venture Capital Funds, Land Fund
** Tangible common equity/Total tangible managed assets, including outstanding guarantees net off impairment allowances accounted for in the off-balance sheet
Data as of 31.12.2024.
Ministry of
Economics 30%
Ministry of
Agriculture 30%
Ministry of
Finance 40%
Financial
instruments*
1 175 MEUR
Risk Coverage
310 MEUR
Contracts
# 38 730
Rated by
Moody’s
Baa1
TCE/TMA**
21.6 %
KEY PARAMETERS
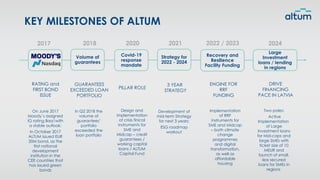
6.
RATING and
FIRST BOND
ISSUE
GUARANTEES
EXCEEDEDLOAN
PORTFOLIO
On June 2017
Moody`s assigned
IG rating Baa1with
a stable outlook;
In October 2017
ALTUM issued EUR
20M bond, as the
first national
development
institution in the
CEE countries that
has issued green
bonds
Development of
mid-term Strategy
for next 3 years;
ESG roadmap
workout
Design and
implementation
of crisis finical
instruments for
SME and
Midcap – credit
guarantees /
working capital
loans / ALTUM
Capital Fund
Implementation
of RRF
instruments for
SME and Midcap
– both climate
change
programmes
and digital
transformation,
as well as
affordable
housing
PILLAR ROLE
3 YEAR
STRATEGY
ENGINE FOR
RRF
FUNDING
2017 2018 2020 2021 2022 / 2023 2024
Recovery and
Resilience
Facility Funding
Covid-19
response
mandate
In Q2 2018 the
volume of
guarantees’
portfolio
exceeded the
loan portfolio
Strategy for
2022 - 2024
Large
Investment
loans / lending
in regions
Volume of
guarantees
DRIVE
FINANCING
PACE IN LATVIA
Two poles:
Active
Implementation
of Large
Investment loans
for Mid-caps and
large SMEs with
ticket size of 10
MEUR and
launch of small,
less secured
loans for SMEs in
regions
KEY MILESTONES OF ALTUM
7.
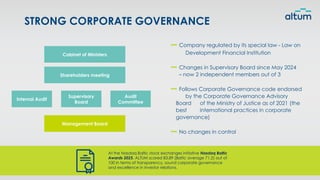
STRONG CORPORATE GOVERNANCE
Companyregulated by its special law - Law on
Development Financial Institution
Changes in Supervisory Board since May 2024
– now 2 independent members out of 3
Follows Corporate Governance code endorsed
by the Corporate Governance Advisory
Board of the Ministry of Justice as of 2021 (the
best international practices in corporate
governance)
No changes in control
At the Nasdaq Baltic stock exchanges initiative Nasdaq Baltic
Awards 2025, ALTUM scored 83.89 (Baltic average 71.2) out of
100 in terms of transparency, sound corporate governance
and excellence in investor relations.
Cabinet of Ministers
Shareholders meeting
Internal Audit
Supervisory
Board
Audit
Committee
Management Board
8.
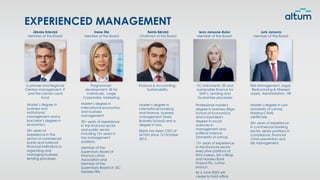
Finance & Accounting,
Sustainability
Customerand Regional
Centers management, IT
and the Latvian Land
Fund
Programmes’
development, EE for
Individuals, Large
Corporates, Marketing
VC instruments, EE and
sustainable finance for
SME’s, Lending and
Guarantee processes
EXPERIENCED MANAGEMENT
Risk Management, Legal,
Restructuring & Stressed
assets, Administration, HR
Jēkabs Krieviņš
Member of the Board
Inese Zīle
Member of the Board
Reinis Bērziņš
Chairman of the Board
Ieva Jansone-Buka
Member of the Board
Juris Jansons
Member of the Board
Master’s degree in
international banking
and finance, business
management (Swiss
Business School) and a
degree in law.
Reinis has been CEO of
ALTUM since 12 October
2015.
Professional master's
degree in business (Riga
School of Economics)
and a bachelor's
degree in social
sciences in
management and
political science
(University of Latvia).
15+ years of experience
in the financial sector
executive positions at
IPAS Indexo, SIA IJ Birojs
and Nordea Bank
Finland Plc. Latvia
branch.
By 6 June 2025 will
cease to hold office.
Master’s degree in
international economics
and business
management.
20+ years of experience
in the financial sector
and public sector,
including 15+ years in
top management
positions.
Member of the
Supervisory Board of
Finance Latvia
Association and
Member of the
Supervisory Board at JSC
Sadales tīkls.
Master’s degree in
business and
institutional
management and a
bachelor’s degree in
economics.
20+ years of
experience in the
sector of commercial
banks and national
financial institutions in
organizing and
managing business
lending processes.
Master’s degree in Law
(University of Latvia).
Holding CAMS
certificate.
20+ years of experience
in commercial banking
sector, senior positions in
compliance, financial
crime prevention and
risk management.
9.
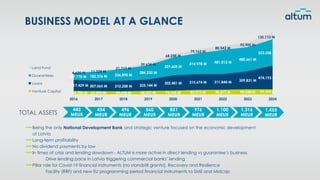
443
MEUR
454
MEUR
496
MEUR
560
MEUR
851
MEUR
976
MEUR
1,100
MEUR
1,316
MEUR
1,455
MEUR
TOTAL ASSETS
BUSINESS MODELAT A GLANCE
Being the only National Development Bank and strategic venture focused on the economic development
of Latvia
Long-term profitability
No dividend payments by law
In times of crisis and lending slowdown - ALTUM is more active in direct lending vs guarantee’s business.
Drive lending pace in Latvia triggering commercial banks’ lending
Pillar role for Covid-19 financial instruments (no standstill grants!), Recovery and Resilience
Facility (RRF) and new EU programming period financial instruments to SME and Midcap
2016 2017 2018 2019 2020 2021 2022 2023 2024
64,785 M 62,299 M 59,698 M 68,331 M 73,165 M 85,973 M 90,277 M 98,548 M 97,999 M
217,429 M 207,065 M 210,208 M 225,144 M
302,481 M 315,674 M 311,844 M 359,831 M
474,193 M
147,175 M 182,376 M 236,895 M
284,232 M
359,605 M
414,978 M 481,013 M
480,661 M
523,538 M
4,635 M 11,328 M
21,717 M
39,634 M
68,258 M
79,163 M
80,542 M
95,905 M
135,113 M
Land Fund
Guarantees
Loans
Venture Capital
10.
MACROECONOMIC FUNDAMENTALS
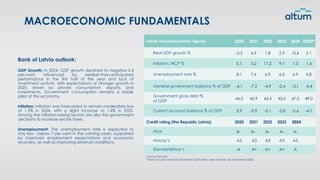
Latvia macroeconomicfigures 2020 2021 2022 2023 2024 2025F*
Real GDP growth % -3.5 6.9 1.8 2.9 -0.4 2.1
Inflation, HICP % 0.1 3.2 17.2 9.1 1.3 1.4
Unemployment rate % 8.1 7.6 6.9 6.5 6.9 6.8
General government balance % of GDP -4.1 -7.2 -4.9 -2.4 -3.1 -3.4
Government gross debt %
of GDP
44.0 45.9 44.4 45.0 47.0 49.0
Current account balance % of GDP 2.9 -3.9 -5.1 -3.8 -2.6 -4.1
Credit rating (the Republic Latvia) 2020 2021 2022 2023 2024
Fitch A- A- A- A- A-
Moody’s A3 A3 A3 A3 A3
Standart&Poor’s A A+ A+ A+ A
Source: Eurostat
* Bank of Latvia forecast December 2024 (data used for forecast: November 2024).
Bank of Latvia outlook:
GDP Growth: In 2024, GDP growth declined to negative 0.4
per-cent, influenced by weaker-than-anticipated
performance in the first half of the year and lack of
investment activity, with expectations of stronger growth in
2025, driven by private consumption, exports, and
investments. Government consumption remains a stable
pillar of the economy.
Inflation: Inflation was forecasted to remain moderately low
at 1.3% in 2024, with a slight increase to 1.4% in 2025.
Among the inflation-raising factors are also the government
decisions to increase excise taxes.
Unemployment: The unemployment rate is expected to
stay low - below 7 per cent in the coming years, supported
by improved employment expectations and economic
recovery, as well as improving external conditions.
11.
General Information
Key CreditHighlights
Portfolio Overview
Operating Model and Performance
Sustainable Financing
Financial Profile
Transaction Overview
12.
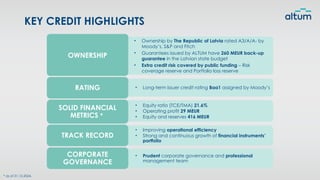
• Ownership byThe Republic of Latvia rated A3/A/A- by
Moody’s, S&P and Fitch
• Guarantees issued by ALTUM have 260 MEUR back-up
guarantee in the Latvian state budget
• Extra credit risk covered by public funding – Risk
coverage reserve and Portfolio loss reserve
• Long-term issuer credit rating Baa1 assigned by Moody’s
RATING
• Equity ratio (TCE/TMA) 21.6%
• Operating profit 29 MEUR
• Equity and reserves 416 MEUR
SOLID FINANCIAL
METRICS *
• Improving operational efficiency
• Strong and continuous growth of financial instruments’
portfolio
TRACK RECORD
• Prudent corporate governance and professional
management team
CORPORATE
GOVERNANCE
KEY CREDIT HIGHLIGHTS
* as of 31.12.2024.
OWNERSHIP
13.
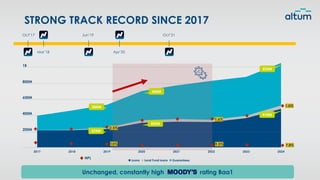
2017 2018 20192020 2021 2022 2023 2024
Loans Land Fund loans Guarantees
STRONG TRACK RECORD SINCE 2017
Unchanged, constantly high rating Baa1
Oct’17
Mar’18
Oct’21
Apr’20
Jun’19
200M
400M
600M
800M
1B
302M
15%
2.5%
9.3%
1.6%
7.8%
1.0%
524M
474M
284M
360M
NPL
225M
14.
General Information
Key CreditHighlights
Portfolio Overview
Operating Model and Performance
Sustainable Financing
Financial Profile
Transaction Overview
15.
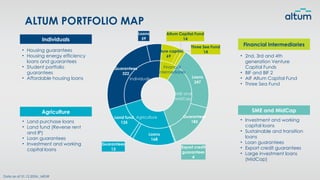
• Housing guarantees
•Housing energy efficiency
loans and guarantees
• Student portfolio
guarantees
• Affordable housing loans
Individuals
• Land purchase loans
• Land fund (Reverse rent
and IP)
• Loan guarantees
• Investment and working
capital loans
Agriculture
• 2nd, 3rd and 4th
generation Venture
Capital Funds
• BIF and BIF 2
• AIF Altum Capital Fund
• Three Sea Fund
Financial intermediaries
• Investment and working
capital loans
• Sustainable and transition
loans
• Loan guarantees
• Export credit guarantees
• Large investment loans
(MidCap)
SME and MidCap
Data as of 31.12.2024., MEUR
ALTUM PORTFOLIO MAP
SME and
MidCap
Agriculture
Individuals
Financial
intermediaries
Loans
247
Guarantees
185
Export credit
guarantees
4
Loans
168
Guarantees
13
Land fund
135
Guarantees
322
Loans
59
Venture capital
69
Altum Capital Fund
14
Three See Fund
14
16.
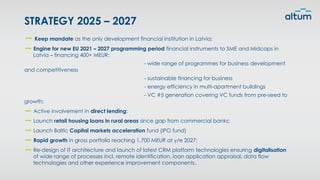
Keep mandate asthe only development financial institution in Latvia;
Engine for new EU 2021 – 2027 programming period financial instruments to SME and Midcaps in
Latvia – financing 400+ MEUR:
- wide range of programmes for business development
and competitiveness
- sustainable financing for business
- energy efficiency in multi-apartment buildings
- VC #5 generation covering VC funds from pre-seed to
growth;
Active involvement in direct lending;
Launch retail housing loans in rural areas since gap from commercial banks;
Launch Baltic Capital markets acceleration fund (IPO fund)
Rapid growth in gross portfolio reaching 1,700 MEUR at y/e 2027;
Re-design of IT architecture and launch of latest CRM platform technologies ensuring digitalisation
of wide range of processes incl. remote identification, loan application appraisal, data flow
technologies and other experience improvement components.
STRATEGY 2025 – 2027
17.
2020 2021 20222023 2024
0
200,000
400,000
600,000
800,000
1,000,000
1,200,000
167,238 219,699 281,391 323,825 380,692
182,688
202,595
217,621
242,488
316,049
380,320
387,531
373,940
369,816
436,083
73,243
85,991
90,724
97,959
98,005
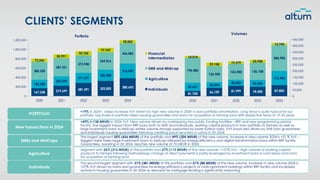
Portfolio
+19% in 2024 – steep increase YoY driven by high new volume in 2024 vs slow portfolio amortisation. Long tenor is quite typical for our
portfolio, big share of portfolio takes housing guarantees and loans for acquisition of farming land with respective tenor of 10-20 years.
PORTFOLIO
+49% (+138 MEUR) in 2024 YoY. New volume driven by overlapping two public funding facilities – RRF and new programming period
facility. The biggest impact from RRF loans both to SME and Individuals, working capital products in loan portfolio to farmers as well as
large investment loans to Midcap where volume strongly supported by lower Euribor rates. YoY boost also driven by SME loan guarantees
and Individuals housing guarantees following crediting pace recovery in Latvia in 2H 2024.
New transactions in 2024
The second largest segment with 31% (381 MEUR) of the portfolio and 21% (88 MEUR) of the new volume. Increase in new volume 2024 is
+27% YoY driven by loans and guarantees for energy-efficiency projects of multi-apartment buildings within RRF facility and increased
activity in housing guarantees in 2H 2024 as demand for mortgage lending is significantly improving.
Individuals
The largest segment 35% (436 MEUR) of the portfolio and 49% (205 MEUR) of the new volume. Increase in new volume 2024 is +51 % YoY –
biggest stake takes large investment loans to Midcap followed by energy-efficiency and digital transformation loans within RRF facility.
Guarantees, boosting in 2H 2024, reaches new volume of 70 MEUR in 2024.
SMEs and MidCaps
Segment with 26% (316 MEUR) of the portfolio and 27% (112 MEUR) of the new volume. +107% YoY – high volume of working capital
products to farmers following methodology change of direct payments is partly leveraged by investment loans in rural areas and loans
for acquisition of farming land.
Agriculture
CLIENTS’ SEGMENTS
2020 2021 2022 2023 2024
0
50,000
100,000
150,000
200,000
250,000
300,000
350,000
400,000
450,000
41,750 66,159 81,999 74,400 87,803
65,621
45,494
48,083 54,300
112,443
196,482
126,905
126,430 136,100
204,903
14,014
29,158
19,379 23,900
15,745
Volumes
Financial
intermediaries
SME and Midcap
Agriculture
Individuals
18.
34
MEUR
23
MEUR
6 343 ha
VIDZEME
19
MEUR
39
MEUR
20
MEUR
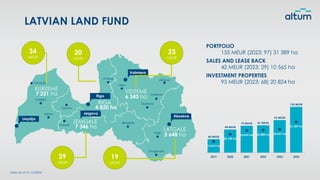
PORTFOLIO
135MEUR (2023: 97) 31 389 ha
SALES AND LEASE BACK
42 MEUR (2023: 29) 10 565 ha
5 648 ha
LATGALE
7 231 ha
KURZEME
7 346 ha
ZEMGALE
4 820 ha
RIGA
Data as of 31.12.2024.
LATVIAN LAND FUND
2019 2020 2021 2022 2023 2024
40 MEUR
68 MEUR
79 MEUR 81 MEUR
96 MEUR
135 MEUR
13,413 ha
20,104 ha
23,439 ha 23,888 ha 24,507 ha
31,389 ha
INVESTMENT PROPERTIES
93 MEUR (2023: 68) 20 824 ha
19.
General Information
Key CreditHighlights
Portfolio Overview
Operating Model and Performance
Sustainable Financing
Financial Profile
Transaction Overview
20.
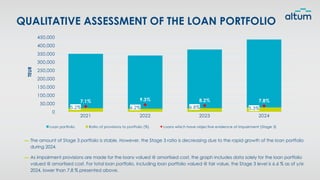
QUALITATIVE ASSESSMENT OFTHE LOAN PORTFOLIO
▬ The amount of Stage 3 portfolio is stable. However, the Stage 3 ratio is decreasing due to the rapid growth of the loan portfolio
during 2024.
▬ As impairment provisions are made for the loans valued @ amortised cost, the graph includes data solely for the loan portfolio
valued @ amortised cost. For total loan portfolio, including loan portfolio valued @ fair value, the Stage 3 level is 6.6 % as of y/e
2024, lower than 7.8 % presented above.
2021 2022 2023 2024
0
50,000
100,000
150,000
200,000
250,000
300,000
350,000
400,000
450,000
5.2% 6.2% 6.8% 5.3%
7.1% 9.3% 8.2% 7.8%
Loan portfolio Ratio of provisions to portfolio (%) Loans which have objective evidence of impairment (Stage 3)
TEUR
21.
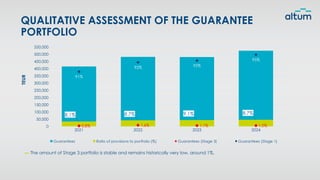
QUALITATIVE ASSESSMENT OFTHE GUARANTEE
PORTFOLIO
2021 2022 2023 2024
0
50,000
100,000
150,000
200,000
250,000
300,000
350,000
400,000
450,000
500,000
550,000
8.1% 8.7% 9.1% 8.7%
0.8% 1.6% 1.1% 1.0%
91%
92% 95%
95%
Guarantees Ratio of provisions to portfolio (%) Guarantees (Stage 3) Guarantees (Stage 1)
▬ The amount of Stage 3 portfolio is stable and remains historically very low, around 1%.
TEUR
22.
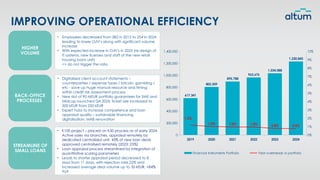
IMPROVING OPERATIONAL EFFICIENCY
HIGHER
VOLUME
BACK-OFFICE
PROCESSES
STREAMLINEOF
SMALL LOANS
• Employees decreased from 282 in 2015 to 254 in 2024
leading to lower O/H’s along with significant volume
increase
• With expected increase in O/H’s in 2025 (re-design of
IT systems, new licenses and staff of the new retail
housing loans unit)
=> do not trigger the ratio
• Digitalised client account statements –
counterparties / expense types / bitcoin, gambling /
etc - save up huge manual resource and timing
within credit risk assessment process
• New slot of 90 MEUR portfolio guarantees for SME and
Midcap launched Q4 2024, ticket size increased to
500 kEUR from 250 kEUR
• Expert hubs to increase competence and loan
appraisal quality – sustainable financing,
digitalisation, MAB renovation
• K100 project – placed on K50 process as of early 2024.
Active sales via branches, appraisal remotely by
dedicated centralized unit. 43% of new loan deals
approved centralised remotely (2023: 25%)
• Loan appraisal process streamlined by integration of
quantitative scoring parameters
• Leads to shorter appraisal period decreased to 8
days from 11 days, with rejection rate 22% and
increased average deal volume up to 35 kEUR, +84%
YoY
2019 2020 2021 2022 2023 2024
0
200,000
400,000
600,000
800,000
1,000,000
1,200,000
1,400,000
0%
1%
2%
3%
4%
5%
6%
7%
8%
9%
10%
617,341
803,509
895,788
963,676
1,034,088
1,230,843
1.2%
1.0% 1.0% 1.0% 0.8% 0.8%
Financial Instruments Portfolio Year overheads vs portfolio
23.
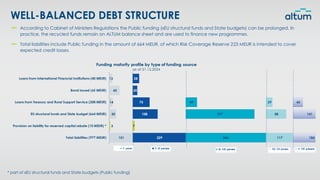
WELL-BALANCED DEBT STRUCTURE
Accordingto Cabinet of Ministers Regulations the Public funding («EU structural funds and State budget») can be prolonged. In
practice, the recycled funds remain on ALTUM balance sheet and are used to finance new programmes.
Total liabilities include Public funding in the amount of 664 MEUR, of which Risk Coverage Reserve 223 MEUR is intended to cover
expected credit losses.
* part of «EU structural funds and State budget» (Public funding)
24.
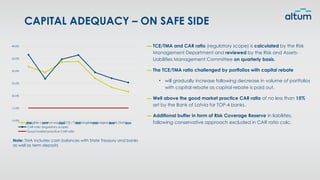
▬ TCE/TMA andCAR ratio (regulatory scope) is calculated by the Risk
Management Department and reviewed by the Risk and Assets-
Liabilities Management Committee on quarterly basis.
▬ The TCE/TMA ratio challenged by portfolios with capital rebate
• will gradually increase following decrease in volume of portfolios
with capital rebate as capital rebate is paid out.
▬ Well above the good market practice CAR ratio of no less than 15%
set by the Bank of Latvia for TOP-4 banks.
▬ Additional buffer in form of Risk Coverage Reserve in liabilities,
following conservative approach excluded in CAR ratio calc.
Note: TMA includes cash balances with State Treasury and banks
as well as term deposits
CAPITAL ADEQUACY – ON SAFE SIDE
2018 2019 2020 2021 2022 2023 2024
10.0%
15.0%
20.0%
25.0%
30.0%
35.0%
40.0%
Tangible common equity (TCE) / Total tangible managed assets (TMA)
CAR ratio (regulatory scope)
Good market practice CAR ratio
25.
General Information
Key CreditHighlights
Portfolio Overview
Operating Model and Performance
Sustainable Financing
Financial Profile
Transaction Overview
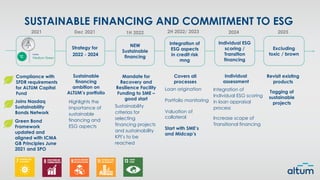
26.
2021 Dec 20212025
1H 2022 2H 2022/ 2023
Sustainable
financing
ambition on
ALTUM’s portfolio
Mandate for
Recovery and
Resilience Facility
Funding to SME –
good start
Highlights the
importance of
sustainable
financing and
ESG aspects
Covers all
processes
Loan origination
Portfolio monitoring
Valuation of
collateral
Start with SME’s
and Midcap’s
Sustainability
criterias for
selecting
financing projects
and sustainability
KPI’s to be
reached
Strategy for
2022 - 2024
Excluding
toxic / brown
Individual ESG
scoring /
Transition
financing
Compliance with
SFDR requirements
for ALTUM Capital
Fund
Joins Nasdaq
Sustainability
Bonds Network
Green Bond
Framework
updated and
aligned with ICMA
GB Principles June
2021 and SPO
SUSTAINABLE FINANCING AND COMMITMENT TO ESG
Revisit existing
products
Tagging of
sustainable
projects
NEW
Sustainable
financing
Integration of
ESG aspects
in credit risk
mng
2024
Individual
assessment
Integration of
Individual ESG scoring
in loan appraisal
process
Increase scope of
Transitional financing
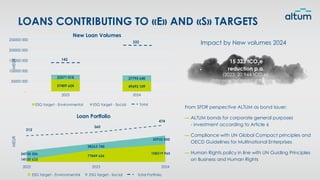
27.
2023 2024
-
50000 000
100000000
150000 000
200000 000
250000 000
57409 624 49693 109
22571 018 27795 640
New Loan Volumes
ESG target - Environmental ESG target - Social
Impact by New volumes 2024
LOANS CONTRIBUTING TO «E» AND «S» TARGETS
15 323 tCO2e
reduction p.a.
(2023: 20 944 tCO2e)
(total expected impact of the projects)
From SFDR perspective ALTUM as bond issuer:
▬ ALTUM bonds for corporate general purposes
- investment according to Article 6
▬ Compliance with UN Global Compact principles and
OECD Guidelines for Multinational Enterprises
▬ Human Rights policy in line with UN Guiding Principles
on Business and Human Rights
Total
MEUR
222
142
MEUR
Total Portfolio
2022 2023 2024
14130 633
77849 626
108519 965
54730 506
38263 740
55935 850
Loan Portfolio
ESG target - Environmental ESG target - Social
474
360
312
28.
General Information
Key CreditHighlights
Portfolio Overview
Operating Model and Performance
Sustainable Financing
Financial Profile
Transaction Overview
Appendix
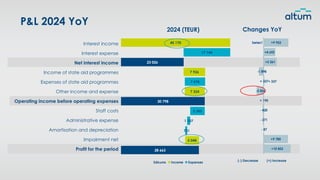
29.
P&L 2024 YoY
Interestincome
Interest expense
Net interest income
Income of state aid programmes
Expenses of state aid programmes
Other income and expense
Operating income before operating expenses
Staff costs
Administrative expense
Amortisation and depreciation
Impairment net
Profit for the period
2024 (TEUR) Changes YoY
(-) Decrease (+) Increase
Series1 +9 953
+5 261
+ 190
- 420
- 371
- 87
+9 785
+10 853
+4 692
-1 898
+ 337
-2 836
40 170
7 926
7 324
5 048
17 144
7 478
5 345
1 107
731
23 026
30 798
28 663
Sākums Income Expenses
+ 337
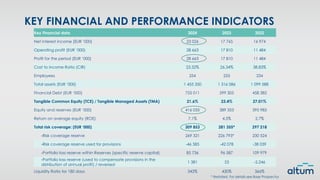
30.
KEY FINANCIAL ANDPERFORMANCE INDICATORS
Key Financial data 2024 2023 2022
Net interest income (EUR ‘000) 23 026 17 765 16 974
Operating profit (EUR ‘000) 28 663 17 810 11 484
Profit for the period (EUR ‘000) 28 663 17 810 11 484
Cost to income Ratio (CIR) 23.32% 26.34% 38.83%
Employees 254 255 234
Total assets (EUR ‘000) 1 455 350 1 316 086 1 099 588
Financial Debt (EUR ‘000) 755 011 599 305 458 382
Tangible Common Equity (TCE) / Tangible Managed Assets (TMA) 21.6% 23.4% 27.01%
Equity and reserves (EUR ‘000) 416 055 389 353 395 983
Return on average equity (ROE) 7.1% 4.5% 2.7%
Total risk coverage: (EUR ‘000) 309 853 281 355* 297 218
-Risk coverage reserve 269 321 226 793* 230 524
-Risk coverage reserve used for provisions -46 585 -42 078 -38 039
-Portfolio loss reserve within Reserves (specific reserve capital) 85 736 96 587 109 979
-Portfolio loss reserve (used to compensate provisions in the
distribution of annual profit) / reversed
1 381 53 -5,246
Liquidity Ratio for 180 days 342% 430% 366%
* Restated, For details see Base Prospectus
31.
KEY FINANCIAL ANDPERFORMANCE INDICATORS
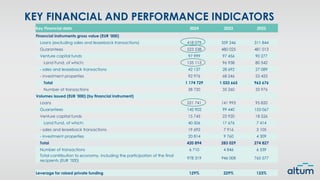
Key Financial data 2024 2023 2022
Financial instruments gross value (EUR ‘000)
Loans (excluding sales and leaseback transactions) 418 079 359 246 311 844
Guarantees 523 538 480 025 481 013
Venture capital funds 97 999 97 456 90 277
Land Fund, of which: 135 113 96 938 80 542
- sales and leaseback transactions 42 137 28 692 27 089
- investment properties 92 976 68 246 53 453
Total 1 174 729 1 033 665 963 676
Number of transactions 38 730 35 260 33 976
Volumes issued (EUR ‘000) (by financial instrument)
Loans 221 741 141 993 95 820
Guarantees 142 902 99 440 153 067
Venture capital funds 15 745 23 920 18 526
Land Fund, of which: 40 506 17 676 7 414
- sales and leaseback transactions 19 692 7 916 3 105
- investment properties 20 814 9 760 4 309
Total 420 894 283 029 274 827
Number of transactions 6 710 4 846 6 539
Total contribution to economy, including the participation of the final
recipients (EUR ’000)
978 319 946 008 765 577
Leverage for raised private funding 129% 229% 123%
32.
General Information
Key CreditHighlights
Portfolio Overview
Operating Model and Performance
Sustainable Financing
Financial Profile
Transaction Overview
33.
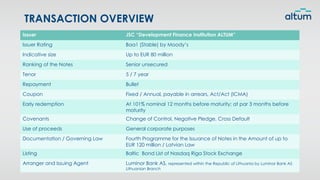
TRANSACTION OVERVIEW
Issuer JSC“Development Finance Institution ALTUM”
Issuer Rating Baa1 (Stable) by Moody’s
Indicative size Up to EUR 80 million
Ranking of the Notes Senior unsecured
Tenor 5 / 7 year
Repayment Bullet
Coupon Fixed / Annual, payable in arrears, Act/Act (ICMA)
Early redemption At 101% nominal 12 months before maturity; at par 3 months before
maturity
Covenants Change of Control, Negative Pledge, Cross Default
Use of proceeds General corporate purposes
Documentation / Governing Law Fourth Programme for the Issuance of Notes in the Amount of up to
EUR 120 million / Latvian Law
Listing Baltic Bond List of Nasdaq Riga Stock Exchange
Arranger and Issuing Agent Luminor Bank AS, represented within the Republic of Lithuania by Luminor Bank AS
Lithuanian Branch