Download as PDF, PPTX


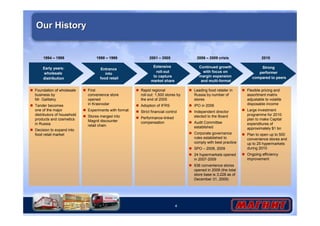
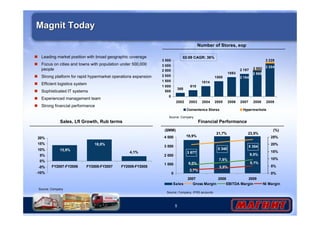
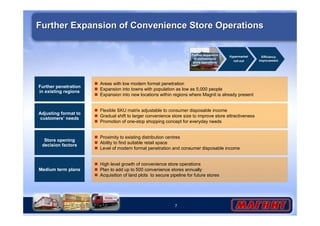
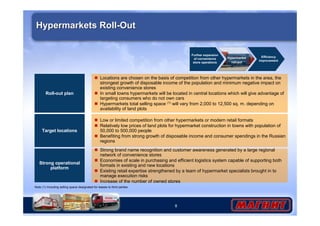
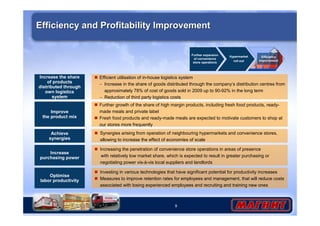

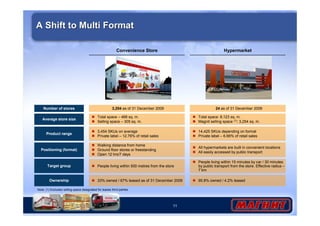

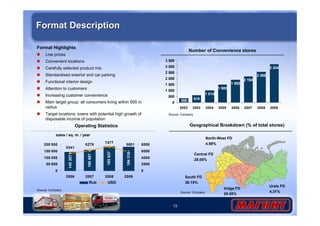
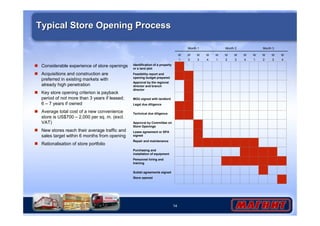
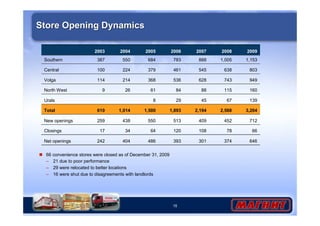
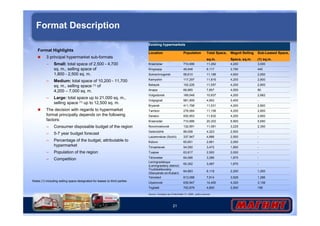
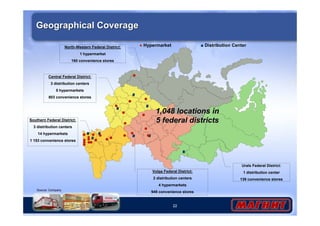
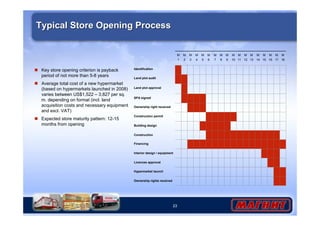

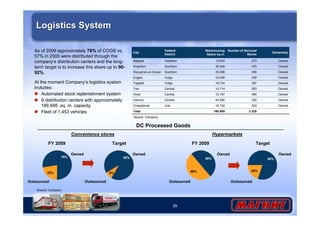


1) Magnit is a leading food retailer in Russia with over 3,200 convenience stores and hypermarkets. It aims to further expand its convenience store network by opening up to 500 new stores annually while also rolling out up to 25 new hypermarkets. 2) Magnit plans to improve efficiency through increasing the share of higher margin products, capturing synergies between stores, and utilizing its logistics system to distribute more goods internally. 3) The strategy focuses on expanding the convenience store network, rolling out hypermarkets in new locations, and driving profitability through cost efficiencies.


