Download to read offline

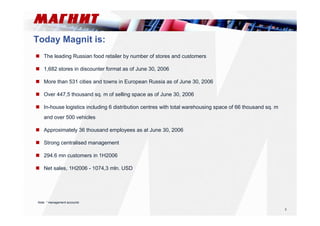
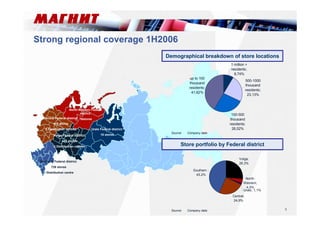


Magnit is the leading Russian food retailer with over 1,682 stores across European Russia as of June 30, 2006. In the first half of 2006, Magnit had net sales of $1,074.3 million and served over 294.6 million customers. Magnit focuses on providing a wide assortment of products including fresh and value-added items. Private label products account for over 10% of sales and Magnit aims to double this share by 2015. Magnit leverages its scale to obtain favorable purchasing terms from large national suppliers.


