Download to read offline


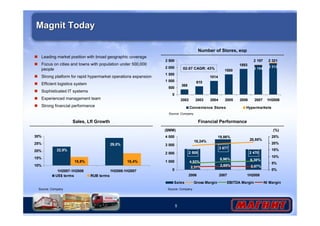


1. The document provides an overview of Magnit's 1H 2008 results, including its business operations and financial performance. It discusses Magnit's history and growth expanding from wholesale distribution into food retail starting in 1998. 2. As of August 2008, Magnit operated 2,367 convenience stores and 10 hypermarkets across Russia, with plans to continue expanding its convenience store and hypermarket operations. It aims to add 200-400 convenience stores annually. 3. Magnit reported strong financial results in 1H 2008, with sales increasing 52.5% and margins growing compared to the same period last year. It maintains a leading market position in Russia with broad geographic coverage.


