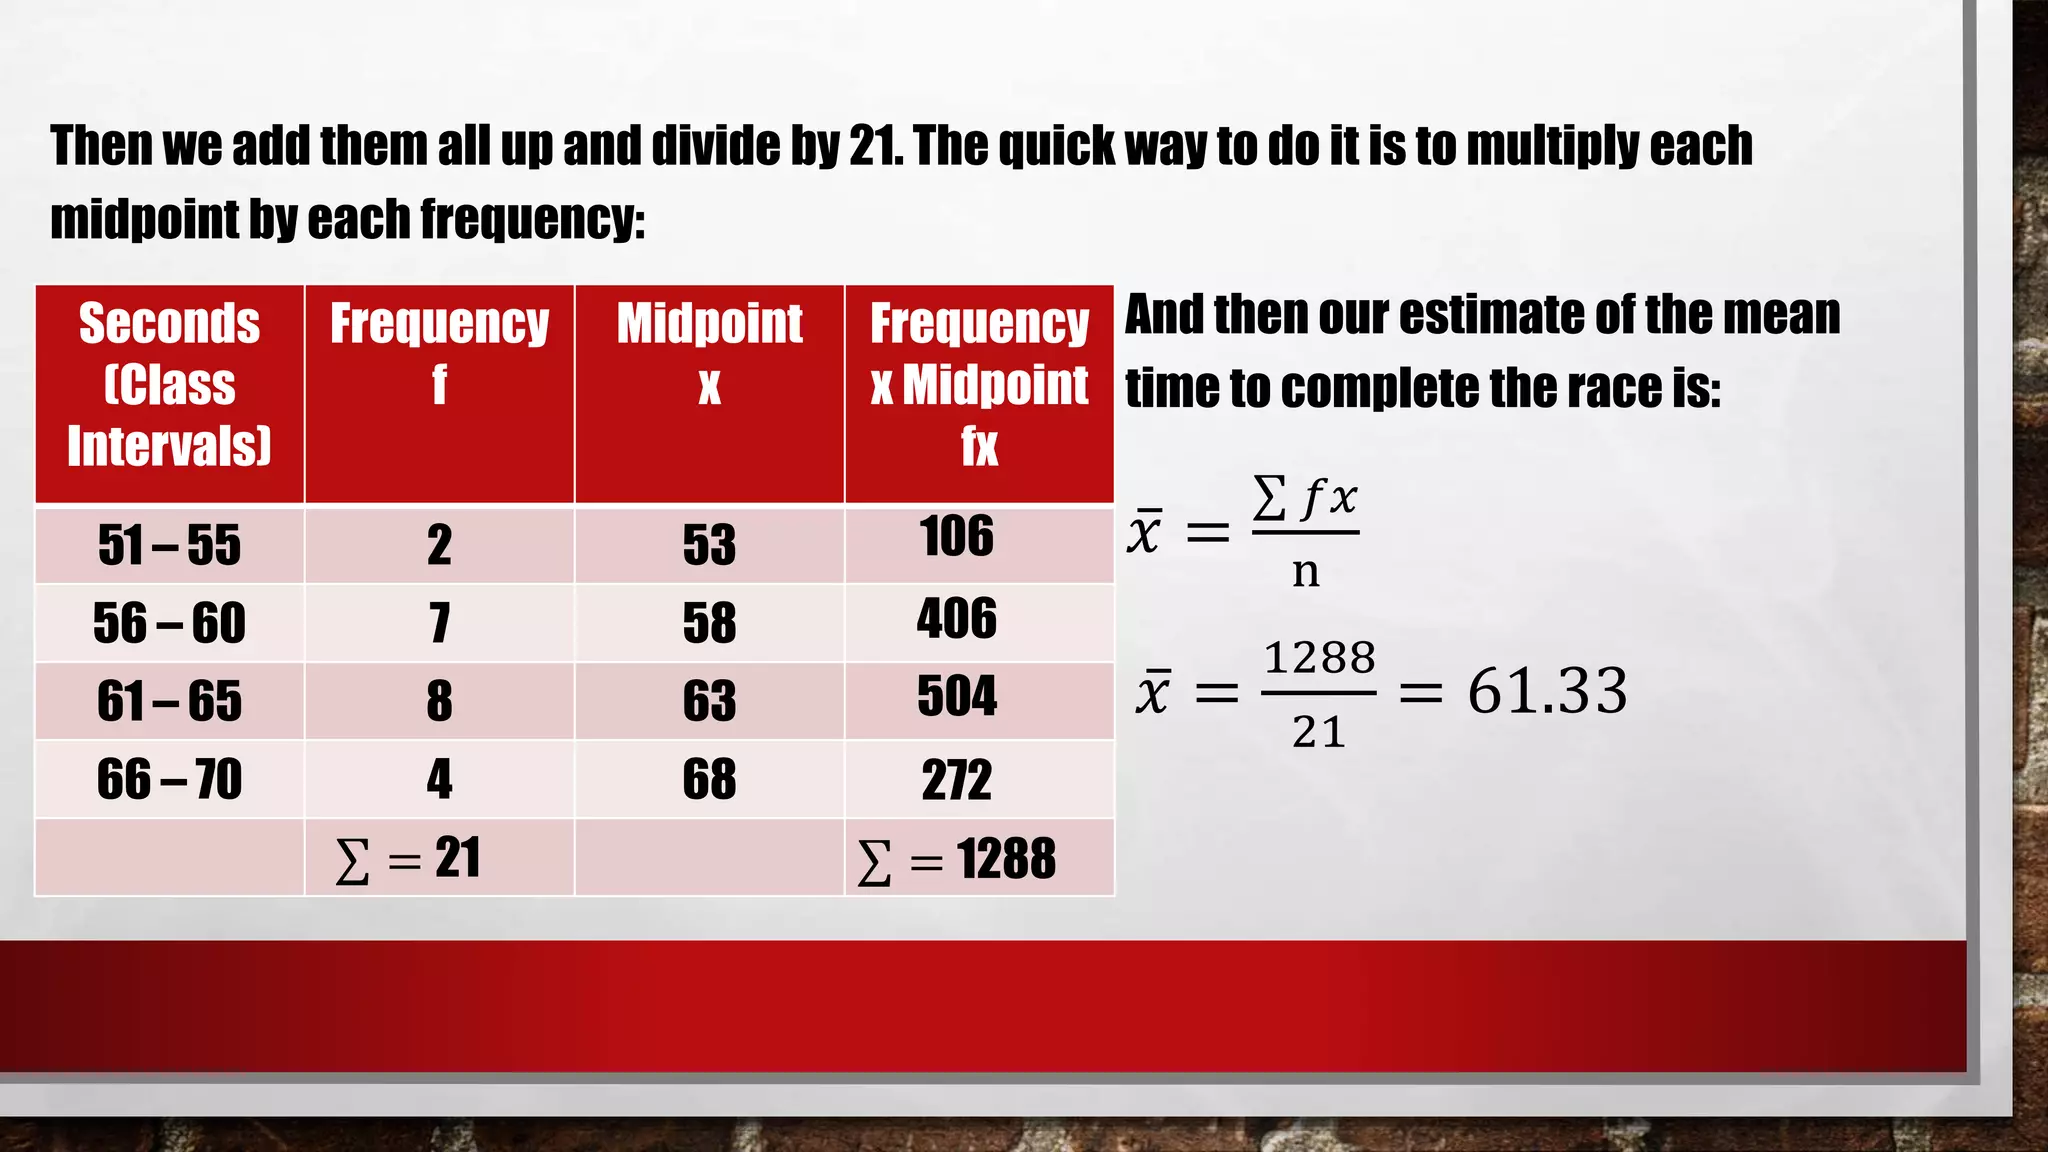
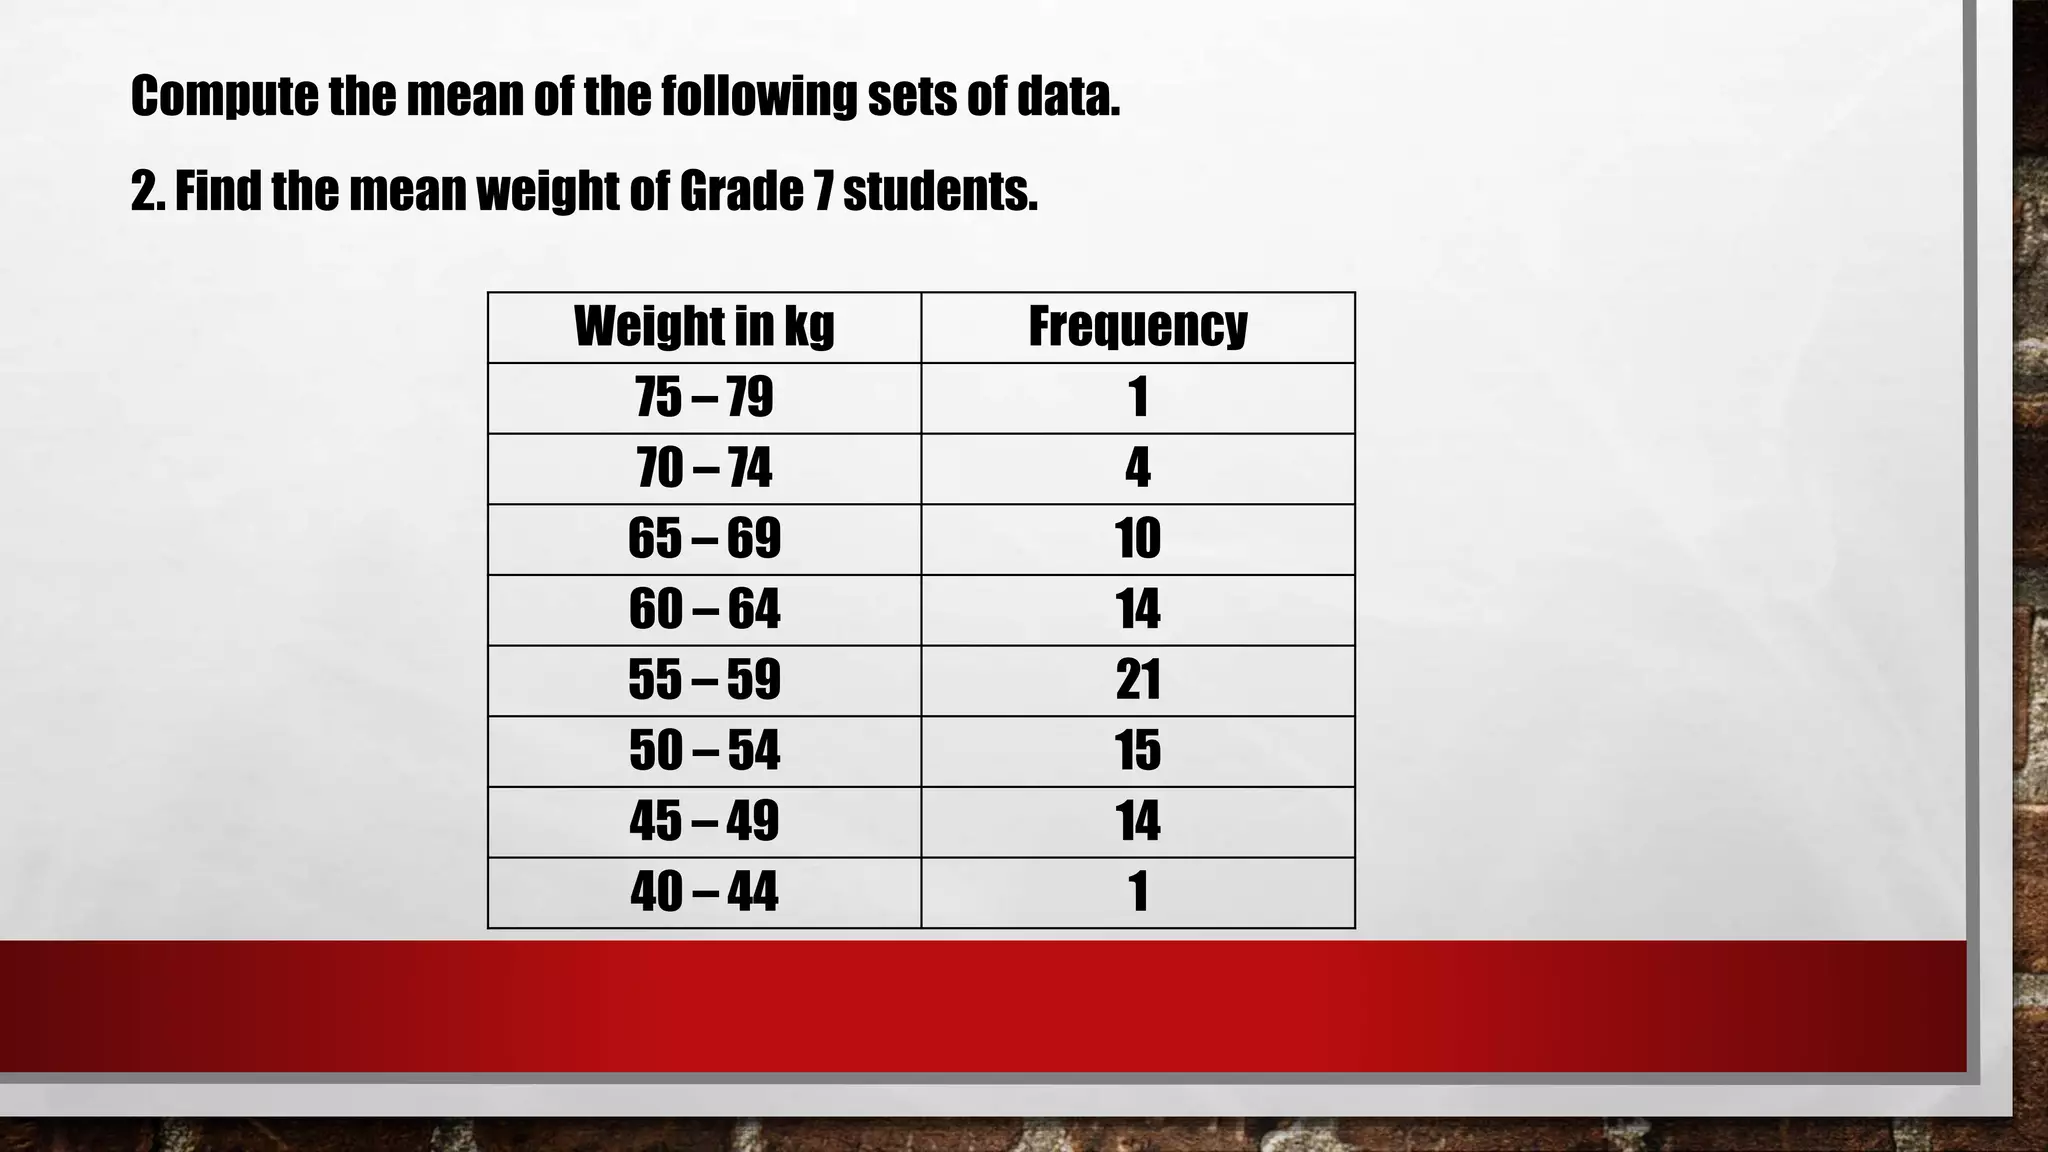
SlideShare a Scribd company logo
WHAT IS MEAN?
•The mean of a set of data is the sum of the data divided by the number of items in
the data set.
•The mean is also referred to as average.
MINI LAB
The number of marbles in each cup represents Jack’s scores for five math quizzes.
Move the marbles among the cups so that each cup has the same number of
marbles.
•What was Jack’s average score for the five quizzes?
Answer: 8
•If Jack scores 14 points on the next quiz, how many marbles would be in each
cup?
Answer: 9
The table shows the points scored by Manny Pacquiao over his opponent Adrien
Broner for the WBA “Regular” Welterweight Title. Pacquiao vs. Broner’s fight
reached up to 12 rounds. How many points need to be scored by Pacquiao during
the last round so that the average number of points scored is 9.75?
Answer: 10
Boxing Scene Scoreboard
Manny Pacquiao
10 10 10 9 10 10
10 10 9 10 9 ?
THE RACE AND THE NAUGHTY PUPPY
Edimar timed 21 people in a 10-meter race, to the nearest second: 59, 65, 61, 62, 53,
55, 60, 70, 64, 56, 58, 58, 62, 62, 68, 65, 56, 59, 68, 61, 67.
Mean: 61.38
THE RACE AND THE NAUGHTY PUPPY
Edimar then makes a grouped frequency table:
THE RACE AND THE NAUGHTY PUPPY
Suddenly all the original data gets lost (naughty puppy!)
Only the Grouped Frequency Table survived ...
... can we help Edimar calculate the Mean, Median and Mode from just that table?
Formula: 𝑥 =
𝑓𝑥
𝑛
where: 𝑥 = mean
f = frequency
x = midpoint
n= sum of frequency
ESTIMATING THE MEAN OF GROUPED DATA
1. Calculate the midpoint of all intervals, denoted by x.
2. Multiply each midpoint by the corresponding frequency, denoted by fx.
3. Find the sum of these products, 𝑓𝑥.
4. Divide this sum by n.
STEPS IN COMPUTING THE MEAN OF
STATISTICAL GROUPED DATA
ESTIMATING THE MEAN OF GROUPED DATA
So all we have left is: •The groups (51-55, 56-60, etc), also called
class intervals, are of width 5
•The midpoints are in the middle of each
class: 53, 58, 63 and 68
Then we add them all up and divide by 21. The quick way to do it is to multiply each
midpoint by each frequency:
And then our estimate of the mean
time to complete the race is:
𝑥 =
𝑓𝑥
n
𝑥 =
1288
21
= 61.33
Seconds
(Class
Intervals)
Frequency
f
Midpoint
x
Frequency
x Midpoint
fx
51 – 55 2 53
56 – 60 7 58
61 – 65 8 63
66 – 70 4 68
106
406
504
272
= 1288= 21
Compute the mean of the following sets of data.
1. The people living together on a small town are grouped according to age as
follows:
Age Number of People
41 - 50 25
31 - 40 22
21 - 30 25
11 - 20 20
0 - 10 15
Compute the mean of the following sets of data.
2. Find the mean weight of Grade 7 students.
Weight in kg Frequency
75 – 79 1
70 – 74 4
65 – 69 10
60 – 64 14
55 – 59 21
50 – 54 15
45 – 49 14
40 – 44 1
ASSIGNMENT
Research about the median of statistical grouped data. How to find the median of
grouped data?

More Related Content

What's hot

Box and whiskers power point
Box and whiskers power pointBox and whiskers power point
Box and whiskers power point
manswag123
 
decile ungrouped data.pptx
decile ungrouped data.pptxdecile ungrouped data.pptx
decile ungrouped data.pptx
mark528335
 

What's hot (20)

Median
MedianMedian
Median
 
MEAN MEDIAN MODE.ppt
MEAN MEDIAN MODE.pptMEAN MEDIAN MODE.ppt
MEAN MEDIAN MODE.ppt
 
Frequency distribution table
Frequency distribution tableFrequency distribution table
Frequency distribution table
 
Median of grouped data
Median of grouped dataMedian of grouped data
Median of grouped data
 
3A. MEASURES OF CENTRAL TENDENCY UNGROUP AND GROUP DATA.pptx
3A. MEASURES OF CENTRAL TENDENCY UNGROUP AND GROUP DATA.pptx3A. MEASURES OF CENTRAL TENDENCY UNGROUP AND GROUP DATA.pptx
3A. MEASURES OF CENTRAL TENDENCY UNGROUP AND GROUP DATA.pptx
 
Mode of Grouped Data - Math 7 (4th Quarter)
Mode of Grouped Data - Math 7 (4th Quarter)Mode of Grouped Data - Math 7 (4th Quarter)
Mode of Grouped Data - Math 7 (4th Quarter)
 
frequency distribution
 frequency distribution frequency distribution
frequency distribution
 
Box and whiskers power point
Box and whiskers power pointBox and whiskers power point
Box and whiskers power point
 
Introduction to Statistics
Introduction to StatisticsIntroduction to Statistics
Introduction to Statistics
 
Quartile
QuartileQuartile
Quartile
 
Measures of position. gouped data
Measures of position. gouped dataMeasures of position. gouped data
Measures of position. gouped data
 
Measures of Central Tendency, Variability and Shapes
Measures of Central Tendency, Variability and ShapesMeasures of Central Tendency, Variability and Shapes
Measures of Central Tendency, Variability and Shapes
 
Introduction to Statistics (Part -I)
Introduction to Statistics (Part -I)Introduction to Statistics (Part -I)
Introduction to Statistics (Part -I)
 
decile ungrouped data.pptx
decile ungrouped data.pptxdecile ungrouped data.pptx
decile ungrouped data.pptx
 
Ppt central tendency measures
Ppt central tendency measuresPpt central tendency measures
Ppt central tendency measures
 
Measure of central tendency
Measure of central tendencyMeasure of central tendency
Measure of central tendency
 
MANN WHITNEY U TEST.pptx
MANN WHITNEY U TEST.pptxMANN WHITNEY U TEST.pptx
MANN WHITNEY U TEST.pptx
 
Standard deviation
Standard deviationStandard deviation
Standard deviation
 
Mean for Grouped Data
Mean for Grouped DataMean for Grouped Data
Mean for Grouped Data
 
The Interpretation Of Quartiles And Percentiles July 2009
The Interpretation Of Quartiles And Percentiles   July 2009The Interpretation Of Quartiles And Percentiles   July 2009
The Interpretation Of Quartiles And Percentiles July 2009
 

Similar to Mean of Grouped Data

Frequency Distribution (Class-interval- Tally).pptx
Frequency Distribution (Class-interval- Tally).pptxFrequency Distribution (Class-interval- Tally).pptx
Frequency Distribution (Class-interval- Tally).pptx
AlwinCAsuncion
 
F4 06 Statistics Iii
F4 06 Statistics IiiF4 06 Statistics Iii
F4 06 Statistics Iii
guestcc333c
 
Kumpulan soal statistik dalam Bahasa Inggris
Kumpulan soal statistik dalam Bahasa InggrisKumpulan soal statistik dalam Bahasa Inggris
Kumpulan soal statistik dalam Bahasa Inggris
Retna Rindayani
 

Similar to Mean of Grouped Data (20)

analytical representation of data
 analytical representation of data analytical representation of data
analytical representation of data
 
Assessment compiled
Assessment compiledAssessment compiled
Assessment compiled
 
MEASURE OF CENTRAL TENDENCY
MEASURE OF CENTRAL TENDENCY  MEASURE OF CENTRAL TENDENCY
MEASURE OF CENTRAL TENDENCY
 
Frequency Distribution (Class-interval- Tally).pptx
Frequency Distribution (Class-interval- Tally).pptxFrequency Distribution (Class-interval- Tally).pptx
Frequency Distribution (Class-interval- Tally).pptx
 
Group 3 measures of central tendency and variation - (mean, median, mode, ra...
Group 3  measures of central tendency and variation - (mean, median, mode, ra...Group 3  measures of central tendency and variation - (mean, median, mode, ra...
Group 3 measures of central tendency and variation - (mean, median, mode, ra...
 
Analysis and interpretation of Assessment.pptx
Analysis and interpretation of Assessment.pptxAnalysis and interpretation of Assessment.pptx
Analysis and interpretation of Assessment.pptx
 
Chapter-6-Variance.pptx
Chapter-6-Variance.pptxChapter-6-Variance.pptx
Chapter-6-Variance.pptx
 
F4 06statisticsiii-090716074100-phpapp01
F4 06statisticsiii-090716074100-phpapp01F4 06statisticsiii-090716074100-phpapp01
F4 06statisticsiii-090716074100-phpapp01
 
F4 06 Statistics Iii
F4 06 Statistics IiiF4 06 Statistics Iii
F4 06 Statistics Iii
 
Chapter 3.2
Chapter 3.2Chapter 3.2
Chapter 3.2
 
central tendency
central tendency central tendency
central tendency
 
Measures of variability grouped data
Measures of variability grouped dataMeasures of variability grouped data
Measures of variability grouped data
 
Arithmetic Mean in Business Statistics
Arithmetic Mean in Business StatisticsArithmetic Mean in Business Statistics
Arithmetic Mean in Business Statistics
 
Statistics1
Statistics1Statistics1
Statistics1
 
Oneway ANOVA - Overview
Oneway ANOVA - OverviewOneway ANOVA - Overview
Oneway ANOVA - Overview
 
C23.2
C23.2C23.2
C23.2
 
Education Assessment in Learnings 1.pptx
Education Assessment in Learnings 1.pptxEducation Assessment in Learnings 1.pptx
Education Assessment in Learnings 1.pptx
 
Statistics+-+11th+Elite+(1).pdf
Statistics+-+11th+Elite+(1).pdfStatistics+-+11th+Elite+(1).pdf
Statistics+-+11th+Elite+(1).pdf
 
central tendency.pptx
central tendency.pptxcentral tendency.pptx
central tendency.pptx
 
Kumpulan soal statistik dalam Bahasa Inggris
Kumpulan soal statistik dalam Bahasa InggrisKumpulan soal statistik dalam Bahasa Inggris
Kumpulan soal statistik dalam Bahasa Inggris
 

Recently uploaded

Recently uploaded (20)

The Benefits and Challenges of Open Educational Resources
The Benefits and Challenges of Open Educational ResourcesThe Benefits and Challenges of Open Educational Resources
The Benefits and Challenges of Open Educational Resources
 
How to Break the cycle of negative Thoughts
How to Break the cycle of negative ThoughtsHow to Break the cycle of negative Thoughts
How to Break the cycle of negative Thoughts
 
Mattingly "AI & Prompt Design: Limitations and Solutions with LLMs"
Mattingly "AI & Prompt Design: Limitations and Solutions with LLMs"Mattingly "AI & Prompt Design: Limitations and Solutions with LLMs"
Mattingly "AI & Prompt Design: Limitations and Solutions with LLMs"
 
Advances in production technology of Grapes.pdf
Advances in production technology of Grapes.pdfAdvances in production technology of Grapes.pdf
Advances in production technology of Grapes.pdf
 
aaaaaaaaaaaaaaaaaaaaaaaaaaaaaaaaaaaaaaaaa
aaaaaaaaaaaaaaaaaaaaaaaaaaaaaaaaaaaaaaaaaaaaaaaaaaaaaaaaaaaaaaaaaaaaaaaaaaaaaaaaaa
aaaaaaaaaaaaaaaaaaaaaaaaaaaaaaaaaaaaaaaaa
 
Application of Matrices in real life. Presentation on application of matrices
Application of Matrices in real life. Presentation on application of matricesApplication of Matrices in real life. Presentation on application of matrices
Application of Matrices in real life. Presentation on application of matrices
 
Solid waste management & Types of Basic civil Engineering notes by DJ Sir.pptx
Solid waste management & Types of Basic civil Engineering notes by DJ Sir.pptxSolid waste management & Types of Basic civil Engineering notes by DJ Sir.pptx
Solid waste management & Types of Basic civil Engineering notes by DJ Sir.pptx
 
Danh sách HSG Bộ môn cấp trường - Cấp THPT.pdf
Danh sách HSG Bộ môn cấp trường - Cấp THPT.pdfDanh sách HSG Bộ môn cấp trường - Cấp THPT.pdf
Danh sách HSG Bộ môn cấp trường - Cấp THPT.pdf
 
How to Create Map Views in the Odoo 17 ERP
How to Create Map Views in the Odoo 17 ERPHow to Create Map Views in the Odoo 17 ERP
How to Create Map Views in the Odoo 17 ERP
 
Home assignment II on Spectroscopy 2024 Answers.pdf
Home assignment II on Spectroscopy 2024 Answers.pdfHome assignment II on Spectroscopy 2024 Answers.pdf
Home assignment II on Spectroscopy 2024 Answers.pdf
 
Matatag-Curriculum and the 21st Century Skills Presentation.pptx
Matatag-Curriculum and the 21st Century Skills Presentation.pptxMatatag-Curriculum and the 21st Century Skills Presentation.pptx
Matatag-Curriculum and the 21st Century Skills Presentation.pptx
 
Benefits and Challenges of Using Open Educational Resources
Benefits and Challenges of Using Open Educational ResourcesBenefits and Challenges of Using Open Educational Resources
Benefits and Challenges of Using Open Educational Resources
 
Operations Management - Book1.p - Dr. Abdulfatah A. Salem
Operations Management - Book1.p  - Dr. Abdulfatah A. SalemOperations Management - Book1.p  - Dr. Abdulfatah A. Salem
Operations Management - Book1.p - Dr. Abdulfatah A. Salem
 
Ethnobotany and Ethnopharmacology ......
Ethnobotany and Ethnopharmacology ......Ethnobotany and Ethnopharmacology ......
Ethnobotany and Ethnopharmacology ......
 
[GDSC YCCE] Build with AI Online Presentation
[GDSC YCCE] Build with AI Online Presentation[GDSC YCCE] Build with AI Online Presentation
[GDSC YCCE] Build with AI Online Presentation
 
Students, digital devices and success - Andreas Schleicher - 27 May 2024..pptx
Students, digital devices and success - Andreas Schleicher - 27 May 2024..pptxStudents, digital devices and success - Andreas Schleicher - 27 May 2024..pptx
Students, digital devices and success - Andreas Schleicher - 27 May 2024..pptx
 
Salient features of Environment protection Act 1986.pptx
Salient features of Environment protection Act 1986.pptxSalient features of Environment protection Act 1986.pptx
Salient features of Environment protection Act 1986.pptx
 
Sectors of the Indian Economy - Class 10 Study Notes pdf
Sectors of the Indian Economy - Class 10 Study Notes pdfSectors of the Indian Economy - Class 10 Study Notes pdf
Sectors of the Indian Economy - Class 10 Study Notes pdf
 
50 ĐỀ LUYỆN THI IOE LỚP 9 - NĂM HỌC 2022-2023 (CÓ LINK HÌNH, FILE AUDIO VÀ ĐÁ...
50 ĐỀ LUYỆN THI IOE LỚP 9 - NĂM HỌC 2022-2023 (CÓ LINK HÌNH, FILE AUDIO VÀ ĐÁ...50 ĐỀ LUYỆN THI IOE LỚP 9 - NĂM HỌC 2022-2023 (CÓ LINK HÌNH, FILE AUDIO VÀ ĐÁ...
50 ĐỀ LUYỆN THI IOE LỚP 9 - NĂM HỌC 2022-2023 (CÓ LINK HÌNH, FILE AUDIO VÀ ĐÁ...
 
The Art Pastor's Guide to Sabbath | Steve Thomason
The Art Pastor's Guide to Sabbath | Steve ThomasonThe Art Pastor's Guide to Sabbath | Steve Thomason
The Art Pastor's Guide to Sabbath | Steve Thomason
 

Mean of Grouped Data

  • 1.
  • 2. WHAT IS MEAN? •The mean of a set of data is the sum of the data divided by the number of items in the data set. •The mean is also referred to as average.
  • 3. MINI LAB The number of marbles in each cup represents Jack’s scores for five math quizzes. Move the marbles among the cups so that each cup has the same number of marbles.
  • 4. •What was Jack’s average score for the five quizzes? Answer: 8 •If Jack scores 14 points on the next quiz, how many marbles would be in each cup? Answer: 9
  • 5. The table shows the points scored by Manny Pacquiao over his opponent Adrien Broner for the WBA “Regular” Welterweight Title. Pacquiao vs. Broner’s fight reached up to 12 rounds. How many points need to be scored by Pacquiao during the last round so that the average number of points scored is 9.75? Answer: 10 Boxing Scene Scoreboard Manny Pacquiao 10 10 10 9 10 10 10 10 9 10 9 ?
  • 6. THE RACE AND THE NAUGHTY PUPPY Edimar timed 21 people in a 10-meter race, to the nearest second: 59, 65, 61, 62, 53, 55, 60, 70, 64, 56, 58, 58, 62, 62, 68, 65, 56, 59, 68, 61, 67. Mean: 61.38
  • 7. THE RACE AND THE NAUGHTY PUPPY Edimar then makes a grouped frequency table:
  • 8. THE RACE AND THE NAUGHTY PUPPY Suddenly all the original data gets lost (naughty puppy!) Only the Grouped Frequency Table survived ... ... can we help Edimar calculate the Mean, Median and Mode from just that table?
  • 9.
  • 10. Formula: 𝑥 = 𝑓𝑥 𝑛 where: 𝑥 = mean f = frequency x = midpoint n= sum of frequency ESTIMATING THE MEAN OF GROUPED DATA
  • 11. 1. Calculate the midpoint of all intervals, denoted by x. 2. Multiply each midpoint by the corresponding frequency, denoted by fx. 3. Find the sum of these products, 𝑓𝑥. 4. Divide this sum by n. STEPS IN COMPUTING THE MEAN OF STATISTICAL GROUPED DATA
  • 12. ESTIMATING THE MEAN OF GROUPED DATA So all we have left is: •The groups (51-55, 56-60, etc), also called class intervals, are of width 5 •The midpoints are in the middle of each class: 53, 58, 63 and 68
  • 13. Then we add them all up and divide by 21. The quick way to do it is to multiply each midpoint by each frequency: And then our estimate of the mean time to complete the race is: 𝑥 = 𝑓𝑥 n 𝑥 = 1288 21 = 61.33 Seconds (Class Intervals) Frequency f Midpoint x Frequency x Midpoint fx 51 – 55 2 53 56 – 60 7 58 61 – 65 8 63 66 – 70 4 68 106 406 504 272 = 1288= 21
  • 14. Compute the mean of the following sets of data. 1. The people living together on a small town are grouped according to age as follows: Age Number of People 41 - 50 25 31 - 40 22 21 - 30 25 11 - 20 20 0 - 10 15
  • 15. Compute the mean of the following sets of data. 2. Find the mean weight of Grade 7 students. Weight in kg Frequency 75 – 79 1 70 – 74 4 65 – 69 10 60 – 64 14 55 – 59 21 50 – 54 15 45 – 49 14 40 – 44 1
  • 16. ASSIGNMENT Research about the median of statistical grouped data. How to find the median of grouped data?

Editor's Notes

  1. So 2 runners took between 51 and 55 seconds, 7 took between 56 and 60 seconds, etc
  2. The answer is ... no we can't. Not accurately anyway. But, we can make estimates.
  3. Our thinking is: "2 people took 53 sec, 7 people took 58 sec, 8 people took 63 sec and 4 took 68 sec". In other words we imagine the data looks like this: 53, 53, 58, 58, 58, 58, 58, 58, 58, 63, 63, 63, 63, 63, 63, 63, 63, 68, 68, 68, 68
  4. Very close to the exact answer we got earlier.