C23.2
•
0 likes•19 views
The document contains 10 questions about constructing frequency distribution tables from sets of data. The data includes test scores, weights, heights, wages, and temperatures. For each question, the student is asked to analyze the data, determine the class intervals and range, and construct a frequency table representing how many values fall into each class.
Report
Share
Report
Share
Download to read offline

Recommended
MEASURES OF DISPERSION OF UNGROUPED DATA
This document contains 7 math problems involving statistical concepts like range, interquartile range, mean, variance, standard deviation, box plots, stem-and-leaf diagrams, and manipulating data sets. The problems cover finding measures of central tendency and dispersion for various data sets, comparing data visually using box plots, determining how changing data values affects statistical properties, and justifying which measures of dispersion to use for a given data set.
Chapter 3.2
The document defines and provides examples to calculate the mean, median, and mode of data sets. It explains that the mode is the most frequently occurring value, the median is the middle value when data is arranged in order, and the mean is calculated by summing all values and dividing by the total number of data points. Examples are provided to demonstrate calculating the mean, median, and mode of data sets containing test scores, sleeping hours, and death rates in Surabaya in 1999.
Vedic maths
This document provides tutorials on methods for performing basic mathematical operations like addition, subtraction, multiplication and division mentally or with minimal writing. The methods use principles like taking digits from 9 or 10, multiplying vertically and crosswise, and using remainders to simplify calculations involving fractions, numbers close to multiples of 10, squares, and division by 9. Worked examples demonstrate applying the methods to practice problems in each topic area.
Frequency distribution
The document provides instructions on how to construct a frequency distribution for a set of data by determining the class interval size. It gives an example of marks obtained by 50 students ranging from 12 to 77. It shows how to find the number of classes, calculate the class interval size, and determine the class boundaries to organize the data into classes for the frequency distribution. It then provides two practice questions asking to draw the frequency distribution for additional data sets.
Statistics for math (English Version)
The document discusses different types of data and statistical methods. It provides examples of qualitative and quantitative data. It also explains various ways to represent data visually, including pie charts, bar charts, histograms, line graphs, and more. Finally, it gives examples of calculating common statistical measures like the mean, median, mode, and quartiles from raw data sets.
Partial Products
The document explains how to multiply multi-digit numbers using the partial products method. It shows an example of multiplying 742 * 29 step-by-step, including expanding the numbers, multiplying each place value, and adding the partial products. It then discusses how to handle decimals, which involves counting the number of decimal places in the factors and writing that many decimal places in the product.
Data presentation Lecture
This document provides information on various methods of presenting data, including tabular, graphical, and textual presentation. It discusses principles of data presentation and different types of tables, charts, and diagrams that can be used including simple tables, frequency distribution tables, bar charts, histograms, line graphs and pie charts. It also covers concepts like class intervals, frequency, relative frequency and discusses worked examples of various methods of data presentation.
Cumulative Frequency Revision
The documents provide information about cumulative frequency curves and distributions:
1) Cumulative frequency curves are drawn from cumulative frequency tables and plot the upper class boundaries against the cumulative frequencies.
2) Examples of cumulative frequency tables are given showing the distribution of various data like exam marks and ages.
3) Measures of central tendency and spread like quartiles, median, and interquartile range can be estimated from a cumulative frequency curve by tracing specific fraction points on the y-axis.
4) Problems are worked out demonstrating how to calculate values from cumulative frequency tables, plot points on cumulative frequency curves, and estimate probabilities based on the curve distributions.
Kumpulan soal statistik dalam Bahasa Inggris
The document contains questions about analyzing and summarizing data sets. It includes questions about finding the highest value, lowest value, range, mean, median, mode and creating frequency distribution tables from raw data and grouped data. It asks the reader to calculate measures of central tendency like mean, median and mode for various data sets involving test scores, salaries, temperatures and more. It also includes questions about determining the number of data points above or below a given value and calculating percentages.
STATISTICS
This document discusses various statistical concepts including:
1. Collection, organization, and presentation of data through methods like observation, interviews, questionnaires, etc. and organizing data through tables, histograms, and frequency polygons.
2. Measures of central tendency including mode, median, and mean. Mode is the most frequent value, median is the middle value, and mean is the average. These can be calculated for grouped or ungrouped data.
3. Quartiles and percentiles which divide a distribution into four equal parts, with the lower quartile being the 25th percentile, median the 50th, and upper quartile the 75th. Quartiles for grouped data use the lower boundary and frequency of the relevant class
C24
This document contains 12 questions about histograms. Each question provides data in the form of frequencies, counts, or other variables. For each question, the solution constructs a histogram by plotting the variables on the x and y-axes to visually represent the frequency distribution of the data. Additional details like class widths, class marks, maximum/minimum frequencies are also determined from the histograms.
Analysis and interpretation of Assessment.pptx
The document provides information on statistics, frequency distributions, measures of central tendency (mean, median, mode), and how to calculate and interpret them. It defines statistics, descriptive and inferential statistics, and frequency distributions. It outlines the steps to construct a frequency distribution and calculate the mean, median, and mode for both ungrouped and grouped data. Examples are provided to demonstrate calculating each measure of central tendency.
Chapter 7 statistics
The document provides information about measures of central tendency and dispersion in statistics. It discusses finding the mode, median, and mean of ungrouped and grouped data. It also discusses determining the range and interquartile range of ungrouped and grouped data. Formulas are provided for calculating the mean, median, mode, range, interquartile range, and variance of data sets. Examples are worked through to demonstrate calculating these statistical measures from raw data sets and frequency distribution tables.
Ch 6 10Math.pdf
This document provides information and examples about constructing frequency distributions and other statistical concepts. It defines key terms like frequency, grouped and ungrouped data, frequency distribution, class limits, class boundaries, class width, and mid-point. Examples are given to show how to construct frequency tables from raw data by grouping it into classes of equal intervals. The document also discusses histograms and frequency polygons as visual representations of grouped data distributions.
C23.1
This document contains 10 questions about key statistical concepts like observations, raw data, frequency distributions, class intervals, and constructing frequency tables from data sets. For each question, it provides the definitions or explanations of terms and shows the step-by-step work of arranging data, determining values like range and frequency, and creating frequency distribution tables to organize and summarize the data.
Frequency Distribution Table 4
The document summarizes a lesson on creating frequency distribution tables from quantitative data. It includes two examples of constructing frequency tables from lists of marks and parts used in a mill. The class intervals are grouped and the frequency of data points within each interval is counted. Multiple choice questions at the end review key concepts like calculating the number of classes and identifying class intervals versus class limits.
frequency distribution table 4
The document summarizes a lesson on quantitative techniques that included:
1) Preparing frequency distribution tables with continuous series problems and examples using student marks and machine part replacements.
2) The class intervals, tallies, and frequencies were shown for the example problems.
3) Multiple choice questions were provided to test understanding of key concepts like calculating the number of classes and identifying class intervals versus limits.
Frequency Distribution (Class-interval- Tally).pptx
The document defines various measures of central tendency including mean, median, and mode for both ungrouped and grouped data. It also defines key terms related to frequency distributions such as lower class limit, upper class limit, class boundaries, class marks, class width, and cumulative frequency. An example is provided to illustrate the construction of a grouped frequency distribution table involving 7 classes with a class width of 7 using data on exam scores of 40 students.
Average.pdf
- There are 63 students in Class A with an average of 32 and 21 students in Class B with an average of 44
- To find the overall average, we calculate the total weight of each class and add them together, then divide by the total number of students
- Using the balance method, we split the distance between the class averages (32 to 44) in proportion to the number of students in each class
- This gives us an overall combined average of 36
Utilization-of-assessment-data-assessmentinLearning1.pptx
The document discusses statistical concepts used in analyzing assessment data. It defines statistics as the science of collecting, organizing, summarizing, and interpreting data. Descriptive statistics are used to describe data through measures of central tendency like the mean, median, and mode, while inferential statistics make predictions about a larger data set based on a sample. The document outlines steps for constructing frequency distributions and calculating the mean, including determining class limits and sizes. Graphs like histograms and frequency polygons can be used to visually represent grouped assessment data.
ARITHMETIC MEAN, MEASURES OF CENTRAL TENDENCY
The document discusses measures of central tendency and arithmetic mean. It provides formulas to calculate the arithmetic mean for raw data, frequency data, and grouped frequency data. It includes examples such as finding the average marks of students, average weight of children, and average salary of employees. The arithmetic mean is used to solve problems involving changes to the original data or addition of new data points.
QUARTILE AND DECILE OF GROUPED DATA
The steps in computing the median are similar to that of Q1 and Q3
. In finding the median,
we need first to determine the median class. The Q1 class is the class interval where
the 𝑁
4
th score is contained, while the class interval that contains the 3𝑁
4
𝑡ℎ
score is the Q3 class.
Formula :𝑄𝑘 = LB +
𝑘𝑁
4
−𝑐𝑓𝑏
𝑓𝑄𝑘
𝑖
LB = lower boundary of the of the 𝑄𝑘 class
N = total frequency
𝑐𝑓𝑏= cumulative frequency of the class before the 𝑄𝑘 class
𝑓𝑄𝑘
= frequency of the 𝑄𝑘 class
i = size of the class interval
k = the value of quartile being asked
The interquartile range describes the middle 50% of values when
ordered from lowest to highest. To find the interquartile range (IQR),
first find the median (middle value) of the upper and the lower half of
the data. These values are Q1 and Q3
. The IQR is the difference
between Q3 and Q1
.
Interquartile Range (IQR) = Q3 – Q1
The quartile deviation or semi-interquartile range is one-half the
difference between the third and the first quartile.
Quartile Deviation (QD) =
𝑄3−𝑄1
2
The formula in finding the kth decile of a distribution is
𝐷𝑘 = 𝑙𝑏𝑑𝑘 +
(
𝑘
10)𝑁 − 𝑐𝑓
𝑓𝐷𝑘
𝑖
𝐿𝐵𝑑𝑘 − 𝐿𝑜𝑤𝑒𝑟 𝐵𝑜𝑢𝑛𝑑𝑎𝑟𝑦 𝑜𝑓 𝑡ℎ𝑒 𝑘𝑡ℎ 𝑑𝑒𝑐𝑖𝑙𝑒
𝑁 − 𝑡𝑜𝑡𝑎𝑙 𝑛𝑢𝑚𝑏𝑒𝑟 𝑜𝑓 𝑓𝑟𝑒𝑞𝑢𝑒𝑛𝑐𝑖𝑒𝑠
𝑐𝑓 − 𝑐𝑢𝑚𝑚𝑢𝑙𝑎𝑡𝑖𝑣𝑒 𝑓𝑟𝑒𝑞𝑢𝑒𝑛𝑐𝑦 𝑏𝑒𝑓𝑜𝑟𝑒 𝑡ℎ𝑒 𝑘𝑡ℎ 𝑑𝑒𝑐𝑖𝑙𝑒
𝐹𝑑𝑘 − 𝑓𝑟𝑒𝑞𝑢𝑒𝑛𝑐𝑦 𝑜𝑓 𝑡ℎ𝑒 𝑘𝑡ℎ 𝑑𝑒𝑐𝑖𝑙𝑒
𝑖 − 𝑐𝑙𝑎𝑠𝑠 𝑠𝑖𝑧𝑒
Frequency Distribution Table 5
This document discusses frequency distribution tables and includes three examples of creating frequency distribution tables from raw data. It summarizes the key steps as: 1) Preparation of Frequency Distribution Table - Continuous Series(Inclusive) Problems -03; 2) Three examples are provided of constructing frequency distribution tables from raw data by grouping the data into class intervals; 3) Multiple choice questions are then provided to test understanding of concepts related to frequency distribution tables like class intervals, class boundaries, and class limits.
frequency distribution table 5
This document discusses frequency distribution tables and includes three examples. It summarizes the key steps in creating frequency distribution tables: (1) grouping data into class intervals, (2) tallying the frequency of values within each interval, and (3) constructing a table with the class intervals, tallies, and frequencies. Three examples are provided that demonstrate creating frequency distribution tables using both inclusive and exclusive class intervals for sets of student test scores and worker hours. The document concludes with multiple choice questions to test understanding of class intervals, boundaries, and other concepts relating to frequency distribution tables.
Assessment compiled
The document discusses various methods for organizing and analyzing test score data, including:
1) Organizing scores in ascending or descending order. Ranking scores from highest to lowest.
2) Creating a stem-and-leaf plot to separate scores into "stems" and "leaves".
3) Calculating measures of central tendency (mean, median, mode) and using frequency distributions to analyze grouped score data.
Frequency distribution table
The document discusses frequency distribution tables and how to create them. It defines statistics, frequency distribution tables, and key terms like data, class, range, and class interval. It provides steps to create a frequency distribution table: 1) arrange data in ascending order, 2) find the range, 3) determine the number of classes, 4) form classes based on class interval, and 5) create a table with classes and frequencies. The document uses an example dataset to demonstrate how to apply these steps to create a frequency distribution table.
Arithmetic mean
This document discusses measures of central tendency, specifically the arithmetic mean. It provides examples and step-by-step solutions for calculating the arithmetic mean of individual data sets, discrete series with frequencies, and continuous series grouped into class intervals. For continuous series, the formula uses the mid-point of each class interval. The document also includes one problem that requires solving for a missing frequency given the calculated arithmetic mean.
Mean for Grouped Data
This document discusses measures of central tendency, specifically how to calculate the mean of grouped data. It provides the formula for calculating the mean of grouped data and walks through an example of finding the mean test scores of students. The document demonstrates how to find the midpoint of each score group, multiply by the frequency, sum the results, and divide by the total frequency to determine the mean.
More Related Content
Similar to C23.2
Kumpulan soal statistik dalam Bahasa Inggris
The document contains questions about analyzing and summarizing data sets. It includes questions about finding the highest value, lowest value, range, mean, median, mode and creating frequency distribution tables from raw data and grouped data. It asks the reader to calculate measures of central tendency like mean, median and mode for various data sets involving test scores, salaries, temperatures and more. It also includes questions about determining the number of data points above or below a given value and calculating percentages.
STATISTICS
This document discusses various statistical concepts including:
1. Collection, organization, and presentation of data through methods like observation, interviews, questionnaires, etc. and organizing data through tables, histograms, and frequency polygons.
2. Measures of central tendency including mode, median, and mean. Mode is the most frequent value, median is the middle value, and mean is the average. These can be calculated for grouped or ungrouped data.
3. Quartiles and percentiles which divide a distribution into four equal parts, with the lower quartile being the 25th percentile, median the 50th, and upper quartile the 75th. Quartiles for grouped data use the lower boundary and frequency of the relevant class
C24
This document contains 12 questions about histograms. Each question provides data in the form of frequencies, counts, or other variables. For each question, the solution constructs a histogram by plotting the variables on the x and y-axes to visually represent the frequency distribution of the data. Additional details like class widths, class marks, maximum/minimum frequencies are also determined from the histograms.
Analysis and interpretation of Assessment.pptx
The document provides information on statistics, frequency distributions, measures of central tendency (mean, median, mode), and how to calculate and interpret them. It defines statistics, descriptive and inferential statistics, and frequency distributions. It outlines the steps to construct a frequency distribution and calculate the mean, median, and mode for both ungrouped and grouped data. Examples are provided to demonstrate calculating each measure of central tendency.
Chapter 7 statistics
The document provides information about measures of central tendency and dispersion in statistics. It discusses finding the mode, median, and mean of ungrouped and grouped data. It also discusses determining the range and interquartile range of ungrouped and grouped data. Formulas are provided for calculating the mean, median, mode, range, interquartile range, and variance of data sets. Examples are worked through to demonstrate calculating these statistical measures from raw data sets and frequency distribution tables.
Ch 6 10Math.pdf
This document provides information and examples about constructing frequency distributions and other statistical concepts. It defines key terms like frequency, grouped and ungrouped data, frequency distribution, class limits, class boundaries, class width, and mid-point. Examples are given to show how to construct frequency tables from raw data by grouping it into classes of equal intervals. The document also discusses histograms and frequency polygons as visual representations of grouped data distributions.
C23.1
This document contains 10 questions about key statistical concepts like observations, raw data, frequency distributions, class intervals, and constructing frequency tables from data sets. For each question, it provides the definitions or explanations of terms and shows the step-by-step work of arranging data, determining values like range and frequency, and creating frequency distribution tables to organize and summarize the data.
Frequency Distribution Table 4
The document summarizes a lesson on creating frequency distribution tables from quantitative data. It includes two examples of constructing frequency tables from lists of marks and parts used in a mill. The class intervals are grouped and the frequency of data points within each interval is counted. Multiple choice questions at the end review key concepts like calculating the number of classes and identifying class intervals versus class limits.
frequency distribution table 4
The document summarizes a lesson on quantitative techniques that included:
1) Preparing frequency distribution tables with continuous series problems and examples using student marks and machine part replacements.
2) The class intervals, tallies, and frequencies were shown for the example problems.
3) Multiple choice questions were provided to test understanding of key concepts like calculating the number of classes and identifying class intervals versus limits.
Frequency Distribution (Class-interval- Tally).pptx
The document defines various measures of central tendency including mean, median, and mode for both ungrouped and grouped data. It also defines key terms related to frequency distributions such as lower class limit, upper class limit, class boundaries, class marks, class width, and cumulative frequency. An example is provided to illustrate the construction of a grouped frequency distribution table involving 7 classes with a class width of 7 using data on exam scores of 40 students.
Average.pdf
- There are 63 students in Class A with an average of 32 and 21 students in Class B with an average of 44
- To find the overall average, we calculate the total weight of each class and add them together, then divide by the total number of students
- Using the balance method, we split the distance between the class averages (32 to 44) in proportion to the number of students in each class
- This gives us an overall combined average of 36
Utilization-of-assessment-data-assessmentinLearning1.pptx
The document discusses statistical concepts used in analyzing assessment data. It defines statistics as the science of collecting, organizing, summarizing, and interpreting data. Descriptive statistics are used to describe data through measures of central tendency like the mean, median, and mode, while inferential statistics make predictions about a larger data set based on a sample. The document outlines steps for constructing frequency distributions and calculating the mean, including determining class limits and sizes. Graphs like histograms and frequency polygons can be used to visually represent grouped assessment data.
ARITHMETIC MEAN, MEASURES OF CENTRAL TENDENCY
The document discusses measures of central tendency and arithmetic mean. It provides formulas to calculate the arithmetic mean for raw data, frequency data, and grouped frequency data. It includes examples such as finding the average marks of students, average weight of children, and average salary of employees. The arithmetic mean is used to solve problems involving changes to the original data or addition of new data points.
QUARTILE AND DECILE OF GROUPED DATA
The steps in computing the median are similar to that of Q1 and Q3
. In finding the median,
we need first to determine the median class. The Q1 class is the class interval where
the 𝑁
4
th score is contained, while the class interval that contains the 3𝑁
4
𝑡ℎ
score is the Q3 class.
Formula :𝑄𝑘 = LB +
𝑘𝑁
4
−𝑐𝑓𝑏
𝑓𝑄𝑘
𝑖
LB = lower boundary of the of the 𝑄𝑘 class
N = total frequency
𝑐𝑓𝑏= cumulative frequency of the class before the 𝑄𝑘 class
𝑓𝑄𝑘
= frequency of the 𝑄𝑘 class
i = size of the class interval
k = the value of quartile being asked
The interquartile range describes the middle 50% of values when
ordered from lowest to highest. To find the interquartile range (IQR),
first find the median (middle value) of the upper and the lower half of
the data. These values are Q1 and Q3
. The IQR is the difference
between Q3 and Q1
.
Interquartile Range (IQR) = Q3 – Q1
The quartile deviation or semi-interquartile range is one-half the
difference between the third and the first quartile.
Quartile Deviation (QD) =
𝑄3−𝑄1
2
The formula in finding the kth decile of a distribution is
𝐷𝑘 = 𝑙𝑏𝑑𝑘 +
(
𝑘
10)𝑁 − 𝑐𝑓
𝑓𝐷𝑘
𝑖
𝐿𝐵𝑑𝑘 − 𝐿𝑜𝑤𝑒𝑟 𝐵𝑜𝑢𝑛𝑑𝑎𝑟𝑦 𝑜𝑓 𝑡ℎ𝑒 𝑘𝑡ℎ 𝑑𝑒𝑐𝑖𝑙𝑒
𝑁 − 𝑡𝑜𝑡𝑎𝑙 𝑛𝑢𝑚𝑏𝑒𝑟 𝑜𝑓 𝑓𝑟𝑒𝑞𝑢𝑒𝑛𝑐𝑖𝑒𝑠
𝑐𝑓 − 𝑐𝑢𝑚𝑚𝑢𝑙𝑎𝑡𝑖𝑣𝑒 𝑓𝑟𝑒𝑞𝑢𝑒𝑛𝑐𝑦 𝑏𝑒𝑓𝑜𝑟𝑒 𝑡ℎ𝑒 𝑘𝑡ℎ 𝑑𝑒𝑐𝑖𝑙𝑒
𝐹𝑑𝑘 − 𝑓𝑟𝑒𝑞𝑢𝑒𝑛𝑐𝑦 𝑜𝑓 𝑡ℎ𝑒 𝑘𝑡ℎ 𝑑𝑒𝑐𝑖𝑙𝑒
𝑖 − 𝑐𝑙𝑎𝑠𝑠 𝑠𝑖𝑧𝑒
Frequency Distribution Table 5
This document discusses frequency distribution tables and includes three examples of creating frequency distribution tables from raw data. It summarizes the key steps as: 1) Preparation of Frequency Distribution Table - Continuous Series(Inclusive) Problems -03; 2) Three examples are provided of constructing frequency distribution tables from raw data by grouping the data into class intervals; 3) Multiple choice questions are then provided to test understanding of concepts related to frequency distribution tables like class intervals, class boundaries, and class limits.
frequency distribution table 5
This document discusses frequency distribution tables and includes three examples. It summarizes the key steps in creating frequency distribution tables: (1) grouping data into class intervals, (2) tallying the frequency of values within each interval, and (3) constructing a table with the class intervals, tallies, and frequencies. Three examples are provided that demonstrate creating frequency distribution tables using both inclusive and exclusive class intervals for sets of student test scores and worker hours. The document concludes with multiple choice questions to test understanding of class intervals, boundaries, and other concepts relating to frequency distribution tables.
Assessment compiled
The document discusses various methods for organizing and analyzing test score data, including:
1) Organizing scores in ascending or descending order. Ranking scores from highest to lowest.
2) Creating a stem-and-leaf plot to separate scores into "stems" and "leaves".
3) Calculating measures of central tendency (mean, median, mode) and using frequency distributions to analyze grouped score data.
Frequency distribution table
The document discusses frequency distribution tables and how to create them. It defines statistics, frequency distribution tables, and key terms like data, class, range, and class interval. It provides steps to create a frequency distribution table: 1) arrange data in ascending order, 2) find the range, 3) determine the number of classes, 4) form classes based on class interval, and 5) create a table with classes and frequencies. The document uses an example dataset to demonstrate how to apply these steps to create a frequency distribution table.
Arithmetic mean
This document discusses measures of central tendency, specifically the arithmetic mean. It provides examples and step-by-step solutions for calculating the arithmetic mean of individual data sets, discrete series with frequencies, and continuous series grouped into class intervals. For continuous series, the formula uses the mid-point of each class interval. The document also includes one problem that requires solving for a missing frequency given the calculated arithmetic mean.
Mean for Grouped Data
This document discusses measures of central tendency, specifically how to calculate the mean of grouped data. It provides the formula for calculating the mean of grouped data and walks through an example of finding the mean test scores of students. The document demonstrates how to find the midpoint of each score group, multiply by the frequency, sum the results, and divide by the total frequency to determine the mean.
Similar to C23.2 (20)
Frequency Distribution (Class-interval- Tally).pptx
Frequency Distribution (Class-interval- Tally).pptx
Utilization-of-assessment-data-assessmentinLearning1.pptx
Utilization-of-assessment-data-assessmentinLearning1.pptx
More from BGEsp1
C26
The document contains solutions to 7 probability questions involving dice rolls, card draws, balls drawn from urns/bags. The solutions calculate the total possible outcomes and favorable outcomes to determine the probability of various events. For example, the probability of rolling a double on two dice is 1/6, drawing a black card from a deck is 1/2, and drawing a white ball from a bag with 3 red, 5 black and 4 white balls is 4/12.
C27.2
This document contains solutions to 9 questions about plotting graphs from tabular data. The solutions involve representing the variables in the tables on the x and y axes and plotting the points to form line graphs. Bar charts are also created from some of the data. The data relates to topics like hospital patient numbers over time, crop yields for farmers, relationships between variables like time/workers and task completion, and cricket scoring across overs.
C16
The document defines various terms related to quadrilaterals and regular polygons. It then provides solutions to 19 questions involving calculating missing angle measures, identifying properties, and determining the number of sides of regular polygons given the measure of each interior angle. The questions cover properties of quadrilaterals like total angle sum, relationships between adjacent/opposite angles and sides, using angle measures to find unknown angles, and properties of regular polygons.
C15
This document contains solutions to 7 questions about classifying and drawing different types of curves and polygons. It defines open and closed curves, and classifies example curves. It also defines properties of polygons like regular polygons, convex/concave polygons, and calculates the number of diagonals in different polygons. Examples include drawing a polygon with its interior shaded and diagonals, classifying curves as simple/closed/polygons, and naming regular polygons with different numbers of sides.
C19 19.1
The document discusses properties of polyhedrons and Euler's formula. It begins by defining a tetrahedron as having the minimum number of planes (4) to enclose a solid. It then answers questions about possible face configurations of polyhedrons and applies Euler's formula, which relates the number of faces, vertices and edges. Specifically, it states that a polyhedron can have any number of faces if it has 4 or more. It also equates a square prism to a cube. Finally, it works through examples verifying and applying Euler's formula to calculate unknown values for various polyhedrons.
C22 22.2
This document contains 35 multi-part math word problems involving the volume, surface area, radius, height, diameter, and other properties of cylinders. The problems provide these cylinder dimensions and ask the reader to calculate various volume, area, ratio, and other metrics. Sample solutions are provided that show the calculations for determining these values based on the cylinder geometry formulas of volume, surface area, etc.
C17 17.2
The document contains 14 multiple choice and short answer questions about properties of rhombi and parallelograms. Key points covered include:
- A rhombus is a parallelogram with 4 equal sides and diagonals that bisect each other at right angles.
- Properties of rhombi include having two pairs of parallel sides, two pairs of equal sides, and diagonals that bisect angles.
- A square is a special type of rhombus where all 4 angles are right angles.
- Questions involve identifying properties, constructing figures based on given properties, and calculating unknown values using properties of rhombi and parallelograms.
C21 21.1
This document contains 17 multi-part questions about calculating the surface areas and volumes of cubes, cuboids, and other shapes. The solutions show the formulas used and step-by-step workings to find the requested dimensions, areas, volumes, or costs. For example, Question 1 calculates the surface areas of cuboids with given lengths, breadths, and heights. Question 17 calculates the breadth of a school hall given its length, height, door/window areas, and total whitewashing cost.
C12 12.2
This document contains 27 math word problems with solutions. The problems involve calculating percentages, rates of change, ratios, and other calculations. Some key details extracted from across the problems include:
- Calculating percentages of totals like 22% of 120, 25% of Rs. 1000, etc.
- Finding original values given final values and percentage increases/decreases like if a 10% increase results in Rs. 3575, what was the original salary?
- Sharing totals according to given percentages, like sharing Rs. 3500 according to 50% ratios.
- Calculating population changes over time given annual percentage increases.
- Determining component percentages in alloys or mixtures.
More from BGEsp1 (20)
Recently uploaded
How to Fix the Import Error in the Odoo 17
An import error occurs when a program fails to import a module or library, disrupting its execution. In languages like Python, this issue arises when the specified module cannot be found or accessed, hindering the program's functionality. Resolving import errors is crucial for maintaining smooth software operation and uninterrupted development processes.
Exploiting Artificial Intelligence for Empowering Researchers and Faculty, In...
Exploiting Artificial Intelligence for Empowering Researchers and Faculty, In...Dr. Vinod Kumar Kanvaria
Exploiting Artificial Intelligence for Empowering Researchers and Faculty,
International FDP on Fundamentals of Research in Social Sciences
at Integral University, Lucknow, 06.06.2024
By Dr. Vinod Kumar KanvariaThe History of Stoke Newington Street Names
Presented at the Stoke Newington Literary Festival on 9th June 2024
www.StokeNewingtonHistory.com
Walmart Business+ and Spark Good for Nonprofits.pdf
"Learn about all the ways Walmart supports nonprofit organizations.
You will hear from Liz Willett, the Head of Nonprofits, and hear about what Walmart is doing to help nonprofits, including Walmart Business and Spark Good. Walmart Business+ is a new offer for nonprofits that offers discounts and also streamlines nonprofits order and expense tracking, saving time and money.
The webinar may also give some examples on how nonprofits can best leverage Walmart Business+.
The event will cover the following::
Walmart Business + (https://business.walmart.com/plus) is a new shopping experience for nonprofits, schools, and local business customers that connects an exclusive online shopping experience to stores. Benefits include free delivery and shipping, a 'Spend Analytics” feature, special discounts, deals and tax-exempt shopping.
Special TechSoup offer for a free 180 days membership, and up to $150 in discounts on eligible orders.
Spark Good (walmart.com/sparkgood) is a charitable platform that enables nonprofits to receive donations directly from customers and associates.
Answers about how you can do more with Walmart!"
Natural birth techniques - Mrs.Akanksha Trivedi Rama University
Natural birth techniques - Mrs.Akanksha Trivedi Rama UniversityAkanksha trivedi rama nursing college kanpur.
Natural birth techniques are various type such as/ water birth , alexender method, hypnosis, bradley method, lamaze method etcPengantar Penggunaan Flutter - Dart programming language1.pptx
Pengantar Penggunaan Flutter - Dart programming language1.pptx
The Diamonds of 2023-2024 in the IGRA collection
A review of the growth of the Israel Genealogy Research Association Database Collection for the last 12 months. Our collection is now passed the 3 million mark and still growing. See which archives have contributed the most. See the different types of records we have, and which years have had records added. You can also see what we have for the future.
Pollock and Snow "DEIA in the Scholarly Landscape, Session One: Setting Expec...
Pollock and Snow "DEIA in the Scholarly Landscape, Session One: Setting Expec...National Information Standards Organization (NISO)
This presentation was provided by Steph Pollock of The American Psychological Association’s Journals Program, and Damita Snow, of The American Society of Civil Engineers (ASCE), for the initial session of NISO's 2024 Training Series "DEIA in the Scholarly Landscape." Session One: 'Setting Expectations: a DEIA Primer,' was held June 6, 2024.ISO/IEC 27001, ISO/IEC 42001, and GDPR: Best Practices for Implementation and...
Denis is a dynamic and results-driven Chief Information Officer (CIO) with a distinguished career spanning information systems analysis and technical project management. With a proven track record of spearheading the design and delivery of cutting-edge Information Management solutions, he has consistently elevated business operations, streamlined reporting functions, and maximized process efficiency.
Certified as an ISO/IEC 27001: Information Security Management Systems (ISMS) Lead Implementer, Data Protection Officer, and Cyber Risks Analyst, Denis brings a heightened focus on data security, privacy, and cyber resilience to every endeavor.
His expertise extends across a diverse spectrum of reporting, database, and web development applications, underpinned by an exceptional grasp of data storage and virtualization technologies. His proficiency in application testing, database administration, and data cleansing ensures seamless execution of complex projects.
What sets Denis apart is his comprehensive understanding of Business and Systems Analysis technologies, honed through involvement in all phases of the Software Development Lifecycle (SDLC). From meticulous requirements gathering to precise analysis, innovative design, rigorous development, thorough testing, and successful implementation, he has consistently delivered exceptional results.
Throughout his career, he has taken on multifaceted roles, from leading technical project management teams to owning solutions that drive operational excellence. His conscientious and proactive approach is unwavering, whether he is working independently or collaboratively within a team. His ability to connect with colleagues on a personal level underscores his commitment to fostering a harmonious and productive workplace environment.
Date: May 29, 2024
Tags: Information Security, ISO/IEC 27001, ISO/IEC 42001, Artificial Intelligence, GDPR
-------------------------------------------------------------------------------
Find out more about ISO training and certification services
Training: ISO/IEC 27001 Information Security Management System - EN | PECB
ISO/IEC 42001 Artificial Intelligence Management System - EN | PECB
General Data Protection Regulation (GDPR) - Training Courses - EN | PECB
Webinars: https://pecb.com/webinars
Article: https://pecb.com/article
-------------------------------------------------------------------------------
For more information about PECB:
Website: https://pecb.com/
LinkedIn: https://www.linkedin.com/company/pecb/
Facebook: https://www.facebook.com/PECBInternational/
Slideshare: http://www.slideshare.net/PECBCERTIFICATION
DRUGS AND ITS classification slide share
Any substance (other than food) that is used to prevent, diagnose, treat, or relieve symptoms of a
disease or abnormal condition
Your Skill Boost Masterclass: Strategies for Effective Upskilling
Your Skill Boost Masterclass: Strategies for Effective UpskillingExcellence Foundation for South Sudan
Strategies for Effective Upskilling is a presentation by Chinwendu Peace in a Your Skill Boost Masterclass organisation by the Excellence Foundation for South Sudan on 08th and 09th June 2024 from 1 PM to 3 PM on each day.How to Add Chatter in the odoo 17 ERP Module
In Odoo, the chatter is like a chat tool that helps you work together on records. You can leave notes and track things, making it easier to talk with your team and partners. Inside chatter, all communication history, activity, and changes will be displayed.
BBR 2024 Summer Sessions Interview Training
Qualitative research interview training by Professor Katrina Pritchard and Dr Helen Williams
How to Make a Field Mandatory in Odoo 17
In Odoo, making a field required can be done through both Python code and XML views. When you set the required attribute to True in Python code, it makes the field required across all views where it's used. Conversely, when you set the required attribute in XML views, it makes the field required only in the context of that particular view.
The simplified electron and muon model, Oscillating Spacetime: The Foundation...
Discover the Simplified Electron and Muon Model: A New Wave-Based Approach to Understanding Particles delves into a groundbreaking theory that presents electrons and muons as rotating soliton waves within oscillating spacetime. Geared towards students, researchers, and science buffs, this book breaks down complex ideas into simple explanations. It covers topics such as electron waves, temporal dynamics, and the implications of this model on particle physics. With clear illustrations and easy-to-follow explanations, readers will gain a new outlook on the universe's fundamental nature.
How to Setup Warehouse & Location in Odoo 17 Inventory
In this slide, we'll explore how to set up warehouses and locations in Odoo 17 Inventory. This will help us manage our stock effectively, track inventory levels, and streamline warehouse operations.
Advanced Java[Extra Concepts, Not Difficult].docx
This is part 2 of my Java Learning Journey. This contains Hashing, ArrayList, LinkedList, Date and Time Classes, Calendar Class and more.
বাংলাদেশ অর্থনৈতিক সমীক্ষা (Economic Review) ২০২৪ UJS App.pdf
বাংলাদেশের অর্থনৈতিক সমীক্ষা ২০২৪ [Bangladesh Economic Review 2024 Bangla.pdf] কম্পিউটার , ট্যাব ও স্মার্ট ফোন ভার্সন সহ সম্পূর্ণ বাংলা ই-বুক বা pdf বই " সুচিপত্র ...বুকমার্ক মেনু 🔖 ও হাইপার লিংক মেনু 📝👆 যুক্ত ..
আমাদের সবার জন্য খুব খুব গুরুত্বপূর্ণ একটি বই ..বিসিএস, ব্যাংক, ইউনিভার্সিটি ভর্তি ও যে কোন প্রতিযোগিতা মূলক পরীক্ষার জন্য এর খুব ইম্পরট্যান্ট একটি বিষয় ...তাছাড়া বাংলাদেশের সাম্প্রতিক যে কোন ডাটা বা তথ্য এই বইতে পাবেন ...
তাই একজন নাগরিক হিসাবে এই তথ্য গুলো আপনার জানা প্রয়োজন ...।
বিসিএস ও ব্যাংক এর লিখিত পরীক্ষা ...+এছাড়া মাধ্যমিক ও উচ্চমাধ্যমিকের স্টুডেন্টদের জন্য অনেক কাজে আসবে ...
South African Journal of Science: Writing with integrity workshop (2024)
South African Journal of Science: Writing with integrity workshop (2024)Academy of Science of South Africa
A workshop hosted by the South African Journal of Science aimed at postgraduate students and early career researchers with little or no experience in writing and publishing journal articles.Recently uploaded (20)
Exploiting Artificial Intelligence for Empowering Researchers and Faculty, In...
Exploiting Artificial Intelligence for Empowering Researchers and Faculty, In...
Walmart Business+ and Spark Good for Nonprofits.pdf
Walmart Business+ and Spark Good for Nonprofits.pdf
Natural birth techniques - Mrs.Akanksha Trivedi Rama University
Natural birth techniques - Mrs.Akanksha Trivedi Rama University
Pengantar Penggunaan Flutter - Dart programming language1.pptx
Pengantar Penggunaan Flutter - Dart programming language1.pptx
Pollock and Snow "DEIA in the Scholarly Landscape, Session One: Setting Expec...
Pollock and Snow "DEIA in the Scholarly Landscape, Session One: Setting Expec...
ISO/IEC 27001, ISO/IEC 42001, and GDPR: Best Practices for Implementation and...
ISO/IEC 27001, ISO/IEC 42001, and GDPR: Best Practices for Implementation and...
Your Skill Boost Masterclass: Strategies for Effective Upskilling
Your Skill Boost Masterclass: Strategies for Effective Upskilling
The simplified electron and muon model, Oscillating Spacetime: The Foundation...
The simplified electron and muon model, Oscillating Spacetime: The Foundation...
How to Setup Warehouse & Location in Odoo 17 Inventory
How to Setup Warehouse & Location in Odoo 17 Inventory
বাংলাদেশ অর্থনৈতিক সমীক্ষা (Economic Review) ২০২৪ UJS App.pdf
বাংলাদেশ অর্থনৈতিক সমীক্ষা (Economic Review) ২০২৪ UJS App.pdf
South African Journal of Science: Writing with integrity workshop (2024)
South African Journal of Science: Writing with integrity workshop (2024)
C23.2
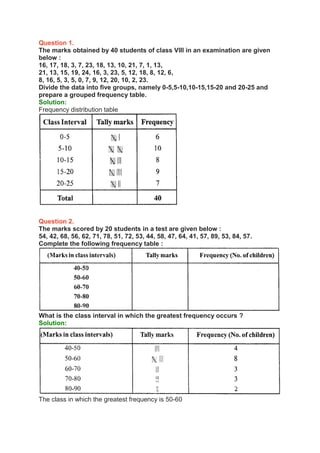
- 1. Question 1. The marks obtained by 40 students of class VIII in an examination are given below : 16, 17, 18, 3, 7, 23, 18, 13, 10, 21, 7, 1, 13, 21, 13, 15, 19, 24, 16, 3, 23, 5, 12, 18, 8, 12, 6, 8, 16, 5, 3, 5, 0, 7, 9, 12, 20, 10, 2, 23. Divide the data into five groups, namely 0-5,5-10,10-15,15-20 and 20-25 and prepare a grouped frequency table. Solution: Frequency distribution table Question 2. The marks scored by 20 students in a test are given below : 54, 42, 68, 56, 62, 71, 78, 51, 72, 53, 44, 58, 47, 64, 41, 57, 89, 53, 84, 57. Complete the following frequency table : What is the class interval in which the greatest frequency occurs ? Solution: The class in which the greatest frequency is 50-60
- 2. Question 3. The following is the distribution of weights (in kg) of 52 persons : (i) What is the lower limit of class 50-60 ? (ii) Find the class marks of the classes 40-50, 50-60. (iii) What is the class size ? Solution: (i) Lower limit of class 50-60 = 50 (ii) Class marks of 40-50 = (frac { 40+50 }{ 2 }) = (frac { 90 }{ 2 }) = 45 and of 50-60 = (frac { 50+60 }{ 2 }) = (frac { 110 }{ 2 }) =55 (iii) Class size is 10 Question 4. Construct a frequency table for the following weights (in gm) of 35 mangoes using the equal class intervals, one of them is 40-45 (45 not included): 30,40,45,32,43,50,55,62,70,70,61,62, 53,52, 50,42,35,37,53,55,65,70, 73, 74,45, 46, 58, 59, 60, 62, 74, 34, 35, 70 ,68. (i) What is the class mark of the class interval 40-45 ? (ii) What is the range of the above weights ? (iii) How many classes are there ? Solution: Smallest observation = 30 Greatest observation = 74 Range = 74 – 30 = 44 Now forming the distribution table
- 3. (i) Class mark of 40-45 = (frac { 40+45 }{ 2 }) = (frac { 85 }{ 2 }) = 42.5 (ii) Range = 74 – 30 = 44 (iii) Number of classes are 9 Question 5. Construct a frequency table with class-intervals 0-5 (5 not included) of the following marks obtained by a group of 30 students in an examination : 0, 5, 7,10, 12,15, 20, 22, 25, 27, 8, 11, 17,3, 6, 9,17,19, 21, 29, 31,35,37,40,42, 45, 49, 4, 50, 16. Solution:
- 4. Frequency distribution table. Question 6. The marks scored by 40 students of class VIII in mathematics are given below: 81,55, 68, 79,85,43,29,68,54,73,47, 35, 72,64,95,44,50, 77,64,35,79, 52, 45,54,70,83, 62′, 64,72,92,84,76,63, 43, 54, 38, 73, 68, 52, 54. Prepare a frequency distribution with class size of 10 marks. Solution: Largest marks = 95 Lowest marks = 29 Range = 95 – 29 = 66 Frequency distribution table
- 5. Question 7. The heights (in cm) of 30 students of class VIII are given below : 155.158.154.158.160.148.149.150.153, 159,161,148,157,153,157,162,159,151, 154,156,152,156,160,152,147,155,163,155,157,153. Prepare a frequency distribution table with 160-164 as one of the class intervals. Solution: Largest height =163 Lowest height =147 Range = 163- 147 = 16 Question 8. The monthly wages of 30 workers in a factory are given below : 830,835,890,810,835,836,869,845,898, 890, 820, 860, 832, 833, 855, 845, 804, 808, 812, 840, 885, 835, 836, 878, 840, 868, 890, 806, 840, 890. Represent the data in the form of a frequency distribution with class size 10. Solution: Highest wage = 898 Lowest wage = 804 Range = 898 – 804 = 94
- 6. Frequency distribution table Question 9. Construct a frequency table with equal class intervals from the following data on the monthly wages (in rupees) at 28 labourers working in a factory, taking one of the class intervals as 210-230 (230 not included): 220, 268, 258, 242, 210, 268, 272,242, 311, 290, 300, 320,319,304,302,318,306,292, 254, 278, 210,240, 280,316,306, 215, 256, 236. Solution: Highest wages = 320 Lowest wages = 210 Range = 320-210= 110 Frequency distribution table
- 7. Question 10. The daily minimum temperatures in degrees Celsius recorded in a certain Arctic region are as follows : -12.5, -10.8, -18.6, -8.4, -10.8, -4.2, -4.8, -6.7, -13.2, -11.8, -2.3,1.2, 2.6, 0, -2.4, 0, 3.2, 2.7,3.4,0, -2.4, -2.4, 0,3.2, 2.7,3.4, 0,2.4, -5.8, -8.9, -14.6, -12.3, -11.5, -7.8, – 2.9 Represent them as frequency distribution table taking -19.9 to -15 as the first class interval. Solution: Lowest temperature = -19.9 Highest temperature = 3.4 Frequency distribution table