The document discusses the use of computed tomography (CT) scanning to analyze the pore structure of rocks. CT scanning allows the internal density distribution of materials to be detected. Researchers have used CT scanning to observe pore morphology, fractures, and changes in rock microstructure under loading. The document focuses on using digital image processing and fractal theory to analyze CT images of rock samples and characterize pore structure. Specifically, it examines calculating the fractal dimension directly from gray-scale CT images to quantify the complexity and self-similarity of pore distributions, avoiding errors from binarizing images. Nine rock samples with different pore ratios were CT scanned at high resolution and their fractal dimensions were computed and compared.
The foremost by-product of this paper is the automation of geological undertakings, for instance, dealing
with exceptionally thin sections of rocks that were subjected to deformation alongside finite steps of time
which can be recorded in video for later analysis using image processing and numerical analysis
procedures. Markers are used in order to trace gradients of deformation over a sample and study other
mechanical properties. Image processing and video sequence analysis can be a very powerful investigation
tool and this paper shows preliminary results from its use on microtectonics. The proposed algorithm is a
combination of two well-known approaches: feature extraction and block matching.
The effect of disturbance factor on the stability of tunnels (Case study: Tun...IJRES Journal
Disturbance factor (D) is related to excavation method and cause damage and stress relief in the rock masses. The convergence and plastic zone around tunnels depends on the disturbance factor of rocks.This study has been in the tunnel No.2 of Kurdistan in NW of Iran which is composed of shale rocks. In tunnel modeling, different disturbance factors(0 to 1) areanalyzed using phase2 software and the amount of displacement and extent of plastic zone in around the tunnelis determined. The obtain results show that by increasing of disturbance factor, the displacement and plastic zone around the tunnel has increased and the most increase has occurred in disturbance factors 0.8 to 1. Therefore, for excavation of this tunnel, the blasting method should not be used and instead of it, the mechanical methods must be used.
Theresultsofstartupexperimentalinvestigationsonthepropertiesofaturbulentboundarylayerover
flat plates with a chaotic micro- and nanostructure possessing hierarchy of granularity (fractality) are
given. Experimental investigations were carried out in the low-turbulent and low-speed aerodynamic
T-36I wind tunnel at TsAGI. The samples in the experimental study were flat plates (160 × 160
mm 2 ) with a fractal surface, which were obtained by high-temperature plasma processing in the
fusion device, QSPA-T, of metallic plates that were originally smooth. The influence of the surface
fractal microstructure on the velocity spectrum and the structure of the turbulent boundary layer
were registered in both load and hot-wire experiments. Suppression of the low-frequency bandwidth
of the velocity spectrum and the change in aerodynamic drag were observed, which indicates the
possibility of turbulence control.
Role of rock mass fabric and faulting in the development of block caving indu...Dr. Alex Vyazmensky
Extraction of a large volume of ore during block caving can lead to the formation of significant surface subsidence. Current knowledge of the mechanisms that control subsidence development is limited as are our subsidence prediction capabilities. Mining experience suggests that, among other contributing factors, geological structures play a particularly important role in subsidence development. A conceptual modeling study has been undertaken to evaluate the significance of geological structure on surface subsidence. A hybrid finite/discrete element technique incorporating a coupled elasto-plastic fracture mechanics constitutive criterion is adopted; this allows physically realistic modeling of block caving through simulation of the transition from a continuum to a discontinuum. Numerical experiments presented emphasize the importance of joint orientation and fault location on mechanisms of subsidence development and the governing role of geological structure in defining the degree of surface subsidence asymmetry.
Numerical analysis of block caving induced instability in large open pit slopesDr. Alex Vyazmensky
This paper addresses one of the most challenging problems in mining rock engineering - the interaction between block cave mining and a large overlying open pit. The FEM/DEM modelling approach was utilized in the analysis of block caving-induced step-path failure development in a large open pit slope. Analysis indicated that there is a threshold percentage of critical intact rock bridges along a step-path failure plane that may ensure stability of an open pit throughout caving operations. Transition from open pit to underground mining at Palabora mine presents an important example of a pit wall instability triggered by caving. Using combined FEM/DEM-DFN modelling it was possible to investigate the formation of a basal failure surface within an open pit slope as a direct result of cave mining. The modelling of Palabora highlighted the importance of rock mass tensile strength and its influence on caving-induced slope response.
Time-History Analysis on Seismic Stability of Nuclear Island Bedrock with wea...ijceronline
This paper presents a three-dimensional numerical simulation method for the seismic response calculation of nuclear island foundation based on the nuclear power plant in Tai Shan. There are two weak interlayers in the bedrock. The numerical simulation aimed at the analysis and the evaluation of the stability of bedrock with the consideration of the interaction between the bedrock and nuclear island. Main features of nuclear numerical model are: (1) the mechanical interaction of nuclear island buildings, turbine room and bedrock have been taken into consideration, (2) the two weak interlayers may decrease the stability of the bedrock, which are the focused research in the models, (3) non-reflective free field boundary have been used in the boundary condition of model. The commercial numerical software FLAC3D has also been used in the simulation and analysis. A finite difference of numerical model for nuclear island bedrock was established and it have been used to analyze the bedrock’s mechanical phenomenon and safety performance. Dynamic characteristics, distributions of mechanical parameters and failure characteristics of bedrock have been studied under the action of seismic wave.
International Journal of Engineering Research and Development (IJERD)IJERD Editor
journal publishing, how to publish research paper, Call For research paper, international journal, publishing a paper, IJERD, journal of science and technology, how to get a research paper published, publishing a paper, publishing of journal, publishing of research paper, reserach and review articles, IJERD Journal, How to publish your research paper, publish research paper, open access engineering journal, Engineering journal, Mathemetics journal, Physics journal, Chemistry journal, Computer Engineering, Computer Science journal, how to submit your paper, peer reviw journal, indexed journal, reserach and review articles, engineering journal, www.ijerd.com, research journals,
yahoo journals, bing journals, International Journal of Engineering Research and Development, google journals, hard copy of journal
Numerical Investigation on the Stability of an Underground Mine Opening in ...Premier Publishers
The stability of an underground opening is an essential factor in the mine operation; the proper prediction of the stability is mandatory for the optimum support design and smooth mine operation. Previous researchers have identified the presence of pre-existing natural fractures as a critical factor for the stability of subsurface opening. However, the variation of natural fracture impact due to different fracture parameter value is yet to be identified. Fracture intensity, orientation, and opening are the most dominant parameters that determine the magnitude of the impact on stability. This study has built an underground mine tunnel model using Itasca’s software 3DEC and analysed the sensitivity of the aforementioned essential parameters. Moreover, the built model has been analysed for varying fracture density, orientation, scaling exponent and distribution and the corresponding displacements of the tunnel in different directions are simulated. The outcome of this study is helpful for the prediction of the mine opening stability and the optimization of support system design.
Geotechnical research group - Aarhus University Denmarkkks_eng
An overview of the research activities of the geotechnical research group at Aarhus University, Department of Enginering, civil and Architectural eng. section.
We are looking for researchers who can strengthen our research group within experimental geotechnics - contact for further info about possibilities.
Gravimetri Dersi için aşağıda ki videoları izleyebilirsiniz.
Link 01: https://www.youtube.com/watch?v=HTyjVaVGx0k
Link 02: https://www.youtube.com/watch?v=fUkfgI8XaOE
Geopsy yaygın olarak kullanılan profesyonel bir program. Özellikle, profesyonel program deneyimi yeni mezunlarda çok aranan bir özellik. Bir öğrencim çalışmasında kullanmayı planlıyor.
Model Attribute Check Company Auto PropertyCeline George
In Odoo, the multi-company feature allows you to manage multiple companies within a single Odoo database instance. Each company can have its own configurations while still sharing common resources such as products, customers, and suppliers.
Synthetic Fiber Construction in lab .pptxPavel ( NSTU)
Synthetic fiber production is a fascinating and complex field that blends chemistry, engineering, and environmental science. By understanding these aspects, students can gain a comprehensive view of synthetic fiber production, its impact on society and the environment, and the potential for future innovations. Synthetic fibers play a crucial role in modern society, impacting various aspects of daily life, industry, and the environment. ynthetic fibers are integral to modern life, offering a range of benefits from cost-effectiveness and versatility to innovative applications and performance characteristics. While they pose environmental challenges, ongoing research and development aim to create more sustainable and eco-friendly alternatives. Understanding the importance of synthetic fibers helps in appreciating their role in the economy, industry, and daily life, while also emphasizing the need for sustainable practices and innovation.
Students, digital devices and success - Andreas Schleicher - 27 May 2024..pptxEduSkills OECD
Andreas Schleicher presents at the OECD webinar ‘Digital devices in schools: detrimental distraction or secret to success?’ on 27 May 2024. The presentation was based on findings from PISA 2022 results and the webinar helped launch the PISA in Focus ‘Managing screen time: How to protect and equip students against distraction’ https://www.oecd-ilibrary.org/education/managing-screen-time_7c225af4-en and the OECD Education Policy Perspective ‘Students, digital devices and success’ can be found here - https://oe.cd/il/5yV
Unit 8 - Information and Communication Technology (Paper I).pdfThiyagu K
This slides describes the basic concepts of ICT, basics of Email, Emerging Technology and Digital Initiatives in Education. This presentations aligns with the UGC Paper I syllabus.
The Roman Empire A Historical Colossus.pdfkaushalkr1407
The Roman Empire, a vast and enduring power, stands as one of history's most remarkable civilizations, leaving an indelible imprint on the world. It emerged from the Roman Republic, transitioning into an imperial powerhouse under the leadership of Augustus Caesar in 27 BCE. This transformation marked the beginning of an era defined by unprecedented territorial expansion, architectural marvels, and profound cultural influence.
The empire's roots lie in the city of Rome, founded, according to legend, by Romulus in 753 BCE. Over centuries, Rome evolved from a small settlement to a formidable republic, characterized by a complex political system with elected officials and checks on power. However, internal strife, class conflicts, and military ambitions paved the way for the end of the Republic. Julius Caesar’s dictatorship and subsequent assassination in 44 BCE created a power vacuum, leading to a civil war. Octavian, later Augustus, emerged victorious, heralding the Roman Empire’s birth.
Under Augustus, the empire experienced the Pax Romana, a 200-year period of relative peace and stability. Augustus reformed the military, established efficient administrative systems, and initiated grand construction projects. The empire's borders expanded, encompassing territories from Britain to Egypt and from Spain to the Euphrates. Roman legions, renowned for their discipline and engineering prowess, secured and maintained these vast territories, building roads, fortifications, and cities that facilitated control and integration.
The Roman Empire’s society was hierarchical, with a rigid class system. At the top were the patricians, wealthy elites who held significant political power. Below them were the plebeians, free citizens with limited political influence, and the vast numbers of slaves who formed the backbone of the economy. The family unit was central, governed by the paterfamilias, the male head who held absolute authority.
Culturally, the Romans were eclectic, absorbing and adapting elements from the civilizations they encountered, particularly the Greeks. Roman art, literature, and philosophy reflected this synthesis, creating a rich cultural tapestry. Latin, the Roman language, became the lingua franca of the Western world, influencing numerous modern languages.
Roman architecture and engineering achievements were monumental. They perfected the arch, vault, and dome, constructing enduring structures like the Colosseum, Pantheon, and aqueducts. These engineering marvels not only showcased Roman ingenuity but also served practical purposes, from public entertainment to water supply.
2. Peng R D, et al. Chinese Sci Bull November (2011) Vol.56 No.31 3347
The measured results from various experimental testing
methods are usually different. However, there should be
some relationships among these different results because
any measured result is just a particular description of pore
structures from a certain perspective.
Since the invention of medical X-ray CT, the inner
defects and structures of materials have been detected
widely by CT scanning. In the late 1980s, medical and
industrial CT was used to observe the internal structure of
rocks. Raynaud et al. [8] obtained CT sliced images of ho-
mogeneous gypsum, granite, sandstone, dolomite and other
rock samples using a medical CT, and the inner fractures in
rocks can be observed clearly from such images. Buyu-
kozturk [9] obtained clear CT images of stones, mortars and
vugs in concrete specimens. In the early 1990s, the internal
structure of frozen soils was detected by a medical CT, and
the mechanism of frozen soil creep was studied [10]. Yang
et al. [11,12] were the first to employ this medical CT ma-
chine to observe changes in rock microstructure after com-
pression, which constituted the initial application of a re-
al-time CT observation for rocks. In 1999, Ge et al. [13,14]
designed a special static loading device integrated with
medical CT and successfully solved the problem of re-
al-time scanning by CT during the loading process, which is
called dynamic CT testing. Since then, many researchers
[15–19] have studied the mesoscopic mechanical behavior
of rocks under different loading conditions by means of
XCT. The size of CT number and its distribution were stud-
ied and the relationship between CT number and rock dam-
age was discussed. Hence steady progress has been made in
two areas, specifically the mechanism of evolving defects or
cracks and the elucidation of damage constitutive relation-
ships. Ju et al. [20–22] investigated the geometric features
and distribution properties of pores in rocks by means of CT
scanning tests of sandstone and foam concrete, and then
constructed a statistical model of rock pore structure that
was used in numerical simulation by finite-element software.
The results indicated the important role of CT technology
for researching microscopic damage of rock materials.
However, some shortcomings of current testing techniques
also have gradually been revealed over time. On the one
hand, there has been much interest in how to improve the
resolution of CT images and imaging speed. Because many
fine defects in rock materials need to be detected by high
resolution equipment, CT systems with micro- and even
nano-focus have been proposed to allow rapid scanning and
reconstruction. Furthermore, the algorithm for reconstruc-
tion and post-image processing has been improved to reduce
artifacts and noise. On the other hand, researchers are
currently trying to extract common problems from a
large number of experiments to establish controllable dam-
age models to predict damage behavior of rock materials
instead of only passively describing the product of damage
to rock materials. Thus, an urgent requirement is to
strengthen the identification and statistical analysis of CT
images so that a pore structure model of rock materials may
be built in which several parameters can be controlled and
used to reflect the characteristics of the pore structures
in rocks.
Fractal theory proposed by Mandelbrot provides a scien-
tific means to describe irregular pore distribution in rocks.
Xie first introduced fractal theory into the study of rock
mechanics in China [23,24]. Since then many scholars have
studied the fractal characteristics of pore structure in rocks.
It has been demonstrated by many studies that the pore dis-
tribution in rocks is statistically self-similar and fractal di-
mensions have been introduced to describe the fractal char-
acteristics of pore distribution. Yang et al. [25] produced a
fractal model of soil using the weight distribution of parti-
cles instead of their size distribution. He et al. [26] calcu-
lated the fractal dimension of pores in reservoir rocks ac-
cording to the expression of capillary pressure and a J func-
tion curve. Li et al. [27] calculated the fractal dimension of
cracks during rock failure by counting the box dimension
and then evaluated the relationships among fractal dimen-
sion, rock composition and stress state. Lian et al. [28] pro-
posed to evaluate rockmass quality by using fractal dimen-
sions to avoid most of the shortcomings of the Rock Quality
Designation (RQD). Xue et al. [29] studied multifractal
characteristics of pores in soil based on experimental data
measured by mercury intrusion methods. Fang et al. [30]
calculated the fractal dimension according to different mod-
el based on nitrogen adsorption and desorption experiments.
Zhou et al. [31] quantified the complexity of the flow
boundary by introducing the fractal dimension of boundary
shape. Zhang et al. [32] and Tao et al. [33] proposed fractal
models of pore volume fraction, particle volume fraction
and size distribution of pores or particles based on the mod-
els of the Sierpinski gasket and Menger sponge. They vali-
dated these models by SEM testing of soils. The calculation
of fractal dimension also has been used to analyze CT im-
ages of rocks; however, almost all the analyses and calcula-
tions are based on the binarization of CT images from gray
images to binary images [34–39]. For rocks with simple
large pores it is easy to obtain available binary images by
approaches such as threshold segmentation or edge detec-
tion, and the error caused by this binarization process is
negligible. However, for rocks with complex pore structures,
some fine pores might be lost to consideration of the sub-
sequent calculations of fractal dimension. If the fractal di-
mension can be calculated directly according to gray CT
images, such errors could be avoided and the calculation
process could be simplified. The natural characteristics of
gray CT images for rocks and the fractal characteristics of
pore structure in rocks are therefore studied in this paper. A
method to calculate the fractal dimension of pore structures
directly from gray CT images is discussed and validated to
better characterize the fractal pore structure.
3. 3348 Peng R D, et al. Chinese Sci Bull November (2011) Vol.56 No.31
1 Mechanism of CT scanning and test results
1.1 Test equipment and samples
CT is an abbreviation for Computerized Tomography,
which is usually actualized by penetrating sections of sam-
ples with X-rays and rotating the samples according a cer-
tain interval. The intensity of X-rays that have penetrated
the sample are measured by the detector and, at the same
time, the scanning movements of the X-ray source, the de-
tector and the sample are controlled by the system so that
the information required for reconstructing slice images is
acquired. Certain algorithms are adopted to analyze these
data and thus a series of image slices are reconstructed.
Figure 1 shows a typical CT system. Because the entire
process, from scanning to reconstructing of images, is con-
trolled by a computer and all the data calculations are made
with a computer, such methods are called Computerized
Tomography. Based on differences in scanning movement,
five generations of CT systems have been developed and
scanning velocity has become higher and higher. The 3rd
generation of scanning (TR) and the 4th generation of scan-
ning (RO) are commonly employed in present industrial CT
systems; the algorithms of parallel-beam reconstruction and
fan-beam reconstruction have correspondingly been adopted.
Chinese research related to CT scanning of rocks has
mainly been accomplished at the State Key Laboratory of
Frozen Soil Engineering in Lanzhou since the 1990s. The
equipment constitutes a medical SOMTOM-plus CT scan-
ner, with spatial resolution of 0.35 mm × 0.35 mm and a
minimum slice height of 1 mm. To improve the scanning
precision further, an ACTIS micro focus industrial XCT
was introduced at the Geological Scientific Research Insti-
tute of Shengli Petroleum Administrative Bureau in
Dongying, and a CT225kVFCB micro-CT experimental
system was co-designed by Taiyuan University of Tech-
nology and Applied Electronics Institute of Academy of
Engineering Physics of China, through which pores and
cracks on the scale of microns may be distinguished. Figure
2 shows a High Resolution Industry CT Real-time Imaging
System (ACTIS300-320/225CT/DR) that was co-designed
by the State Key Laboratory of Coal Resources and Safety
Mining of China University of Mining & Technology (Bei-
jing) and American Bio-Imaging Research (BIR) Inc. Using
this system, 16-bits images of CT slices could be obtained
by quick scanning with resolution at a micron scale. For a
sample with the diameter of 25 mm, about 50 s was required
to complete a scan and reconstruct a 16-bit gray image with
1024×1024 pixels based on 1440 views; both the resolution
in the slice plane and the resolution along the slice height
reached about 10 μm. Our tests were conducted using this
system.
Figure 1 A typical CT system.
Figure 2 High Resolution Industry CT Real-time Imaging System (ACTIS300-320/225CT/DR).
4. Peng R D, et al. Chinese Sci Bull November (2011) Vol.56 No.31 3349
For a given CT system, the scanning resolution is
strongly related to the sample size. Trying to reduce the
sample size as much as possible is helpful for increasing the
resolution of the final scanned images. According to fea-
tures of the CT testing system and the specifications of most
rock samples for testing in the laboratory, the rock sample
size was determined as a cylinder with a diameter of 25 mm
and height of 50 mm. To compare fractal characteristics of
the pore structure among various rock types with different
pore ratios, nine kinds of rock samples were considered in
the test: basalt, salt rock, coal, mudstone, sandstone, gyp-
sum, oil shale, corundum and concrete. After coring, sam-
ples were polished so that their two ends were parallel to
one another and vertical to the central axes of the samples.
This ensured that a series of slices could be obtained as sta-
ble concentric disks when samples were placed on a turnta-
ble.
1.2 Mechanism of CT scanning and imaging
When X-rays with certain energy pass through samples,
because of the photoelectric effect, Compton effect, electron
pair effects, Rayleigh scattering, and other complex physi-
cal processes, some rays are reflected, scattered or absorbed
by samples so that the intensity of X-rays penetrating the
samples decreases. The intensity of monoenergetic X-Rays
with narrow spectra before and after passing through ho-
mogeneous materials agrees with Lambert-Beer’s law de-
scribed as
0e x
I I
, (1)
where I0 is the intensity of incoming X-rays, I is the inten-
sity of penetrated X-rays, ∆x is the height of samples along
the forward direction of X-rays, μ is the linear attenuation
coefficient of materials which changes with variation in
energy E of X-rays and the physical properties of the tested
materials. When the voltage is less than 200 kV, the linear
attenuation coefficient depends mainly on Compton scat-
tering and photoelectric absorption, which can be deter-
mined by the following equation [40]:
3.8
3.2
Z
a b
E
, (2)
where ρ is the density of material, Z is the atomic number, a
is the Kline-Nishina coefficient, b is taken as 9.8×10⁻²⁴
, and
E is the energy of X-ray particles (keV). If the material in
the XY plane is uneven, the attenuation coefficient can be
expressed as μ(x, y, E, Z, ρ), which reflects the combined
results of a series of interactions between X-rays and mate-
rials. Thus the total attenuation along a path L in a certain
direction is
0
1
ln( / ) d
N
i
L
p I I l x
. (3)
This equation is the projection formula of X-rays in
which p is designated as the projection of X-rays after
passing through a material. Thereby the integrand function
μ can be solved by a series of projections p, and accordingly
the distribution of attenuation coefficients in the XY plane
can be obtained. Such a solving process is indeed the prin-
ciple of image reconstruction utilized by CT. When the ma-
terial in the XY plane is divided into N×N small cells, the
attenuation coefficient of each cell can be calculated via the
N2
times independent measurements. The calculated value
of the attenuation coefficient also approximately corre-
sponds to the density of each cell. With medical CTs, a def-
inition of CT number is introduced to describe the attenua-
tion coefficient of human tissue relative to the attenuation
coefficient of water. CT number is also known as the
Hounsfied number, which is defined as
1000w
w
, (4)
where μw is the attenuation coefficient of water.
A CT image can be obtained by mapping the attenuation
coefficient or the CT number of the material cell to the gray
value of each pixel by a certain proportional relation. Be-
cause of the effects of quantum statistical laws, partial
volume effects, X-ray hardening, multi spectral effects and
other factors, certain calibrations are required to ensure that
the gray value of pixels in CT images correspond well to the
density of the material cell. Because rocks are composed of
several types of minerals with various structures, the density
of every portion of a rock is different and thus the gray val-
ue of CT images of rocks are diverse in different regions.
Generally black pixels in CT images indicate objects with
lower density, while white indicates high density. The vari-
ation of pixel gray from black to white reflects the change
of density of the rock cell.
1.3 CT sliced images of rock samples
Taking into account the statistical nature of sample slices,
only the middle 10 mm of samples were scanned. The size
of scanning view field is 27 mm, and the size of corre-
sponding sliced images is 1024×1024 pixels. Thus the reso-
lution for each pixel is 26 μm. Samples were scanned to
obtain a slice layer at 1 mm intervals along the specimen
height, and thus 10 sliced images were obtained for each
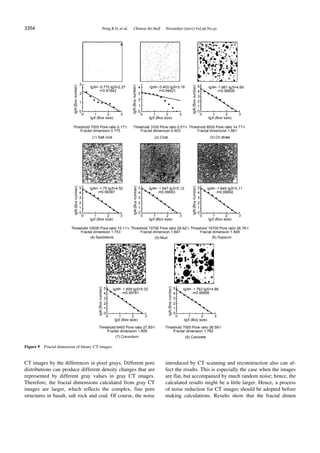
sample. Figure 3 shows one layer of slice images for several
kinds of samples. The gray value of each pixel in the CT
sliced images reflects the density of the corresponding posi-
tion. The initial CT slice image is a 16-bit Tiff image and
hence has relatively high resolution. However, because of
sample density are usually limited to a certain degree and
mainly concentrated in low-density regions, the initial im-
age slice represents low brightness and minimal contrast.
A histogram of initial CT sliced images was introduced
to analyze the distribution of gray for every pixel. The col-
ors in the four corners of the initial images are directly as-
signed as black or white when reconstructing images; hence,
5. 3350 Peng R D, et al. Chinese Sci Bull November (2011) Vol.56 No.31
Figure 3 Initial CT sliced images of various rock samples.
they are irrelevant to the scanned object and should be
omitted when counting gray values. Only the central circu-
lar regions of images constitute meaningful data and need to
be counted. Furthermore, the edge region of images could
be excised to facilitate subsequent image analysis because
the statistics of the data slices should be taken into account.
Therefore, only the central rectangular regions of rock core
samples were statistically analyzed. It is also helpful to
eliminate the effect of false images in edges produced by
scanning. Figure 4(a) and (c) show the histogram of the
initial slice data based on counting the central 512×512 pix-
el region of the initial 16-bit Tiff images for coal and con-
crete samples. It can be seen that the gray value is limited to
avery narrow range. Results from other samples also are
similar to this case. Because only 8-bit gray images can be
directly recognized and displayed in current computer sys-
tems, a kind of mapping operation from 16-bit to 8-bit gray
level is required to display gray images of CT slices. The
usual linear mapping as shown in Figure 5(a) cannot effec-
tively represent the variation in initial gray value. A subsec-
tion mapping operation was proposed to enhance image
contrast to facilitate observation. Figure 4(b) and (d) show
the histogram for 8-bit CT images after conducting subsec-
tion gray mapping, and the corresponding CT images are
shown in Figure 6. Comparing Figures 3 and 6, it can be
seen that the image contrast is effectively improved after
subsection gray mapping, and thus the internal pore struc-
ture of various rock samples was presented visually.
2 Analysis of rock pore ratio based on binary
images of CT slices
The density of a rock cell is decreased if there are some
pores in the rock cell, such that the color of the pixels that
correspond to the rock cell containing pores would be dark-
er than that with no pores. As mentioned previously, the
attenuation coefficient of rock cells corresponding to te pix-
els depends not only on the density and other physical
properties of the rock material, but also on a series of inter-
actions between X-rays and rock materials. Especially with
an industrial CT scan, both the voltage and current of the
X-ray source should be adjusted according to the density
and size of the samples. As well, detection results are often
not strictly calibrated. Therefore the gray values in CT
sliced data can only indicate the differences in density, and
the absolute magnitude of the gray values has no strict physi-
cal meaning. It is difficult to determine the kind of material
that is represented by the pixel simply by comparing
Figure 4 Histograms of initial 16-bit CT slice data and mapped 8-bit CT images. (a) Histogram of initial 16-bits coal slice; (b) histogram of mapped 8-bits
coal image; (c) histogram of initial 16-bits concrete slice; (d) histogram of mapped 8-bits concrete image.
6. Peng R D, et al. Chinese Sci Bull November (2011) Vol.56 No.31 3351
Figure 5 Mapping from 16-bit gray to 8-bit gray.
Figure 6 CT images of various rock samples after contrast enhancement.
the gray value of each pixel. In addition, when the pixel
resolution is too large, the corresponding rock cells might
contain various minerals and void. Therefore, the corre-
sponding attenuation coefficient of these rock cells should
be the comprehensive reflection of all attenuation coeffi-
cients of various substances in the rock cells. It means that
the gray value of pixels in CT images is usually the average
reflection of the densities of all substances in the corre-
sponding rock cell under certain scanning conditions. To
analyze the pore structure of rocks, several types of methods
based on image analysis and processing have been utilized,
such as threshold segmentation, edge detection, morpho-
logical operations (opening, closing, erosion and dilation),
and spectral identification. Thus, some binary images were
extracted to describe the pore structure.
Based on binary images of rock pore structures, pore ra-
tios can be calculated and the pore topology can be quanti-
tatively characterized. In fact, the advantage of CT scanning
is in revealing the inner topological structure of rock pores,
such as pore size, pore location distribution and pore con-
nectivity, whereas traditional tests can only determine the
value of pore ratios under specific test conditions. It should
be more effective for analyzing characteristics of rock pore
structures to integrate the CT scanning test and the tradi-
tional porosity measuring test. A consideration of the tradi-
tional porosity measuring test is also helpful to simplify the
complex image processing. The pore ratio is a simple bridge
between these two kinds of methods. The value of the pore
ratio calculated based on CT images should be equal or
equivalent to that measured from traditional tests.
Among the various approaches to extract binary images
of pore structures, threshold segmentation is a simple and
effective method. Although the gray value of pores in a CT
image is always taken as the smallest one, it is difficult to
determine the threshold of the pore gray value because there
will usually exist some pores the size of which are less than
the pixel resolution, and noise cannot be avoided when
scanning and reconstructing. Some CT images of rocks
have a histogram similar to Figure 4(c), which indicates the
characteristic of two peaks, and thus a particular threshold
segmentation algorithm could be introduced for these cases
so that better results could be obtained. However, these
cases only result where there are many large pores in rocks.
Under these conditions, the density of rock cells approxi-
mates the density of the rock matrix or the density of pores,
and thus its distribution has two peaks. In most cases, the
internal pore structure of the rock is very complicated and
thus the histogram of CT images of rocks cannot process the
characteristics of two peaks, similar to in Figure 4(a). For
these cases it is challenging to determine the segmentation
threshold directly based on histograms of gray value.
Figure 7 shows pore ratio curves calculated at different
thresholds. Correspondingly, the binary images of pore
structure obtained by segmentation at the different thresh-
olds are shown in Figure 8. If a low threshold is chosen, the
pores cannot be fully extracted and thus the calculated pore
ratio is relatively small. If a higher threshold is chosen,
some parts of the rock matrix would be extracted and thus
the calculated pore ratio is relatively large. The pore ratios
measured through traditional permeability tests are: 26% for
mudstone, 27% for artificial corundum, 28% for foam con-
crete. Figure 8 shows that the binary images obtained by
segmentation at the threshold corresponding to these pore
ratio are satisfactory. Therefore, the segmentation threshold
should be determined by inverse analysis based on the pore
ratio that is measured experimentally, and then used to
segment CT sliced images for obtaining binary images of
pore structure as shown in Figure 9. To further improve
accuracy, statistics should be used that are appropriate for
multi-layer slices; i.e., all the pixels that represent gray val-
ues should be counted if they are less than the given thresh-
old in all layers of slices.
3 Fractal characteristics of rock pores and cal-
culation of fractal dimensions
It has been demonstrated in many studies that pore structure
7. 3352 Peng R D, et al. Chinese Sci Bull November (2011) Vol.56 No.31
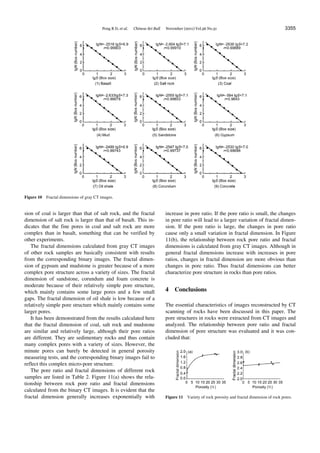
Figure 7 Rock pore ratio under different partition thresholds.
Figure 8 Binary images of rock pores under different threshold parti-
tions.
in rocks has fractal characteristics and contains a certain
self-similarity. When the pores in rocks were observed un-
der different magnifications, both distribution of the relative
size of pores and distribution of the relative location of
pores was statistically consistent. The calculation of rock
pore ratios is strongly related to the range of pore sizes. As
more and more micro-pores are considered, the calculated
values of the pore ratios also will increase. If only pores
with sizes larger than a certain value are considered, the
calculated value of the pore ratio will be decreased. There-
fore, the characteristics of pore structure in rocks cannot be
fully described only using pore ratio and the distribution of
pore size. The fractal characteristics of pore structure in
rocks should be described by fractal dimensions of pore
structure, which can be calculated based on CT images by
counting box dimensions. Nowadays the calculation of
fractal dimension for digital images is mainly focused on
the analysis of binary images, which requires pretreatment
of CT images by a particular binarization approach. Alt-
hough such an approach is helpful to extract the pore struc-
ture from CT images, the selection of binarization ap-
proaches is likely to affect image analysis and processing,
and sometimes might result in losing finely detailed infor-
mation in some proportion of images. As mentioned previ-
ously, the gray value in CT images reflects specific infor-
mation, and thus different binarization approaches will
produce different mesoscopic structures (e.g. holes, cracks),
with distinct fractal dimensions. In the following section the
methods to calculate the fractal dimensions of images is
first discussed, and then binary images and gray images are
studied to calculate their fractal dimensions.
3.1 Calculation of fractal dimensions based on images
Describing the fractal dimensions of research objects main-
ly depends on the characteristics of research objects and the
aims of the research. Physical fractals in nature usually
manifest randomly within some range of scales; i.e., fractal
characteristics are shown only in the specific size region
from the viewpoint of statistics. Therefore, fractal dimen-
sions are defined as different formulae [24], including
Hausdorff dimension DH, information dimension Di, similar
dimension Ds, correlation dimension Dg, capacity dimension
Dc, spectral dimension and Lyapunov dimension Dl. Dif-
ferent definitions can be adapted to calculate fractal dimen-
sions of different research objects. The counting box di-
mension (CBD) is widely used because its mathematical
calculation is relatively simple and it has intuitive physical
meaning.
The color mode of images should be considered when we
are selecting a specific algorithm to calculate the fractal
dimension of images [41,42]. The color for a binary CT
image has only two kinds of value (usually 0 or 1), and thus
the calculation of dimensions could be achieved in a two
dimensional plane. A gray CT image could be regarded as
three dimensional space {(x, y, z)}, where x, y indicate the
position of the pixel in the image plane, and z represents the
gray value of the pixel. Hence the gray value of the image
produces a rough surface, and thus the calculation of di-
mensions could be achieved based on tridimensional box
covering methods in this three dimensional space.
Binary CT images with the size of M×M pixels will be
considered subsequently in which black pixels with a gray
value of 0 indicate pores. The image is divided into a series
of grids with an edge length of δk and then the number Nδk
of grids containing black pixels is counted. When 0k ,
we can obtain lg lg(1/ )k BN δ D . Thus for a descend-
ing sequence {δk}, the data pair (-lgδk, lgNδk) can be fitted
by the least squares method in logarithmic coordinates. If
the correlation coefficient is large enough, the slope be-
comes just the approximation of the fractal dimension. The
decreasing sequence is usually selected by dichotomy
method, i.e. {M, M/2, M/4, M/8, M/16, ···}.
For a gray CT image with a size of an M×M pixel with
gray level 16 (i.e. gray value can vary from 0 to 65535), a
8. Peng R D, et al. Chinese Sci Bull November (2011) Vol.56 No.31 3353
series of box with a bottom edge length of δk×δk and a
height of Hk should be taken to cover the image. The de-
creasing sequence is usually selected by dichotomy method,
and the corresponding box height should be calculated ac-
cording the gray level as
max
k
kH I
M
. (5)
For a certain box with a different size of δk×δk×Hk, the
number Nδk of boxes that can cover all the pores in the im-
ages is different. Considering the relativity of the gray value
in CT images, only the spatial surface corresponding to the
gray of all pixels should be covered by the boxes, so
2
2
1
max( ( , )) min( ( , ))
k
k
n k
I i j I i j
N
H
, (6)
where I(i,j) indicate the set of gray value of all pixels in the
nth
grid corresponding to the size of δk. The data pair (-lgδk,
lgNδk) in the non-scale region can be linearly fitted by the
least squares method in logarithmic coordinates and thus a
linear equation can be determined as
lg ( lg )k kN a δ b , (7)
in which slope a is the fractal dimension DCB of pore images.
3.2 Fractal dimension of rock pores based on binary
images of CT slices
The fractal dimension calculated from binary images of CT
slices is shown in Figure 9. Results shown in Figure 9 indi-
cate that the correlation coefficients are generally larger
than 0.99; therefore, the calculated fractal dimension is val-
id. The pore ratio of basalt samples is close to 0, and thus
the corresponding binary image is a pure white image with
fractal dimension of 0 and is not listed in Figure 9.
The pore ratios of salt rock samples and coal samples are
lower, less than 1%, and the calculated fractal dimension is
less than 1. This indicates that the pores in the salt rock and
coal contain micro-holes isolated for each other.
The pore ratio of sandstone and oil shale samples are al-
most equal, at about 15%. However, their fractal dimen-
sions are distinct. The fractal dimension of sandstone sam-
ples is 1.75, while the fractal dimension of oil shale samples
is 1.66. Therefore, the pore structure in sandstone is more
complex than that in oil shale, as shown in Figures 6 and 9.
There are many large pores and a few small pores in oil
shale, while there are a few large pores and many fine pores
in sandstone.
The pore ratios of mudstone, gypsum, corundum and
foam concrete samples are almost equal, at about 27%, but
their fractal dimensions are different. The fractal dimension
of mudstone and gypsum samples is 1.85, corundum sam-
ples 1.81, and foam concrete samples 1.76. Images in Fig-
ures 6 and 9 show that the pores in mudstone and gypsum
are more complex than those in corundum, which in turn are
more complex than pores in foam concrete.
The fractal dimension of pore images can be well de-
scribed by calculating binary images of CT slices, but the
results of the calculations depend strongly on the segmenta-
tion threshold of binarization approaches. As shown in Fig-
ure 8, the binary images obtained according to different
segmentation thresholds are dissimilar, and therefore both
the pore ratio and the fractal dimension calculated from the
binary images are distinct, as listed in Table 1.
The results show that the fractal dimension of pore
structures would increase with increasing pore ratio, and
furthermore the fractal dimension of pore structures might
be distinct even if the pore ratio is equal. The more complex
the pore structure, the greater its fractal dimension. There-
fore, pore structure can be well characterized by fractal di-
mension. Especially for pore structures with the same pore
ratio, the fractal dimension could effectively characterize
their differing complexity.
3.3 Fractal dimension of rock pores based on gray im-
ages of CT slices
To eliminate the effect of binarization approaches on the
calculation of fractal dimensions, gray CT images were di-
rectly utilized to calculate fractal dimensions, as shown in
Figure 10. It is evident from the results shown in Figure 10
that the correlation coefficients are larger than 0.99, thus the
calculated fractal dimension is valid.
Results of calculations directly from gray images show
that the fractal dimension of basalt, rock salt and coal sam-
ples are relatively larger, which is different from the results
of calculation from binary images. This is caused by the fact
that many pixels cannot be extracted in binarization ap-
proaches and only a few pores with relatively large sizes
can be considered. Such a process is available only when
pores smaller than micron scale can be neglected. In fact,
rocks usually contain a large numbers of micro-pores
smaller than micron scale, which cannot easily be measured
by traditional test methods. Therefore the pore ratios meas-
ured in the present test were very low and only a few large
pores were extracted by binarization approaches based on
inverse analysis. However, the density of the rock cells con-
taining these pores would represent infinitesimal changes,
which can only be detected by CT and reflected in gray
Table 1 Porosity and fractal dimension of rock pores under different
segmentation thresholds
Mud Corundum Concrete
Pore ratio
(%)
Fractal
dimension
Pore ratio
(%)
Fractal
dimension
Pore ratio
(%)
Fractal
dimension
0.98 1.350 0.95 1.167 1.49 1.287
8.01 1.775 4.89 1.489 12.36 1.602
26.62 1.847 27.85 1.809 28.58 1.762
62.59 1.954 66.03 1.944 66.93 1.953
9. 3354 Peng R D, et al. Chinese Sci Bull November (2011) Vol.56 No.31
Figure 9 Fractal dimension of binary CT images.
CT images by the differences in pixel grays. Different pore
distributions can produce different density changes that are
represented by different gray values in gray CT images.
Therefore, the fractal dimensions calculated from gray CT
images are larger, which reflects the complex, fine pore
structures in basalt, salt rock and coal. Of course, the noise
introduced by CT scanning and reconstruction also can af-
fect the results. This is especially the case when the images
are flat, but accompanied by much random noise; hence, the
calculated results might be a little larger. Hence, a process
of noise reduction for CT images should be adopted before
making calculations. Results show that the fractal dimen
10. Peng R D, et al. Chinese Sci Bull November (2011) Vol.56 No.31 3355
Figure 10 Fractal dimensions of gray CT images.
sion of coal is larger than that of salt rock, and the fractal
dimension of salt rock is larger than that of basalt. This in-
dicates that the fine pores in coal and salt rock are more
complex than in basalt, something that can be verified by
other experiments.
The fractal dimensions calculated from gray CT images
of other rock samples are basically consistent with results
from the corresponding binary images. The fractal dimen-
sion of gypsum and mudstone is greater because of a more
complex pore structure across a variety of sizes. The fractal
dimension of sandstone, corundum and foam concrete is
moderate because of their relatively simple pore structure,
which mainly contains some large pores and a few small
gaps. The fractal dimension of oil shale is low because of a
relatively simple pore structure which mainly contains some
larger pores.
It has been demonstrated from the results calculated here
that the fractal dimension of coal, salt rock and mudstone
are similar and relatively large, although their pore ratios
are different. They are sedimentary rocks and thus contain
many complex pores with a variety of sizes. However, the
minute pores can barely be detected in general porosity
measuring tests, and the corresponding binary images fail to
reflect this complex micro-pore structure.
The pore ratio and fractal dimensions of different rock
samples are listed in Table 2. Figure 11(a) shows the rela-
tionship between rock pore ratio and fractal dimensions
calculated from the binary CT images. It is evident that the
fractal dimension generally increases exponentially with
increase in pore ratio. If the pore ratio is small, the changes
in pore ratio will lead to a larger variation of fractal dimen-
sion. If the pore ratio is large, the changes in pore ratio
cause only a small variation in fractal dimension. In Figure
11(b), the relationship between rock pore ratio and fractal
dimensions is calculated from gray CT images. Although in
general fractal dimensions increase with increases in pore
ratios, changes in fractal dimension are more obvious than
changes in pore ratio. Thus fractal dimensions can better
characterize pore structure in rocks than pore ratios.
4 Conclusions
The essential characteristics of images reconstructed by CT
scanning of rocks have been discussed in this paper. The
pore structures in rocks were extracted from CT images and
analyzed. The relationship between pore ratio and fractal
dimension of pore structure was evaluated and it was con-
cluded that:
Figure 11 Variety of rock porosity and fractal dimension of rock pores.
11. 3356 Peng R D, et al. Chinese Sci Bull November (2011) Vol.56 No.31
Table 2 Porosity and fractal dimension of various rock samples
Rock class Section threshold Pore ratio (%)
Fractal dimension of binary
image
Fractal dimension of gray
image
Basalt 10000 0 0 2.518
Salt rock 7000 0.17 0.775 2.604
Coal 3100 0.51 0.453 2.636
Oil shale 8500 14.71 1.661 2.499
Concrete 6000 27.85 1.718 2.530
Sandstone 10000 15.11 1.753 2.555
Corundum 6400 27.85 1.809 2.547
Gypsum 10700 26.76 1.848 2.584
Mud 10700 26.62 1.847 2.633
(1) The gray value of each pixel in CT images of rocks is
a comprehensive reflection of the attenuation coefficient of
all the material in the corresponding rock cell. The effect of
pores with all kinds of scales in rocks can be represented in
gray CT images obtained by scanning with a high resolution
industrial real-time CT imaging system.
(2) The contrast in CT images can be effectively en-
hanced by subsection gray mapping from the 16-bit initial
data to the 8-bit gray images. Accordingly all types of pore
structures in rocks can be clearly shown.
(3) A segmentation threshold can be determined by in-
verse analysis based on pore ratios that are measured ex-
perimentally, and subsequently binary images of rock pores
can be obtained to study the topological structures of rock
pores.
(4) The fractal dimension of rock pore structure increases
with increase in rock pore ratios. Fractal dimensions might
be different even though pore ratios are the same. The more
complex the structure of the rocks, the larger the fractal
dimension becomes. Therefore, pore structures are better
characterized by fractal dimensions. This is especially true
for those pore structures with the same pore ratio; whereby
the fractal dimension would effectively reflect their differ-
ential complexity.
(5) It was experimentally validated that fractal dimension
calculations directly from gray CT images of rocks are pos-
sible. This is helpful to simplify the calculation process by
eliminating binarization that would cause some disturbances
and errors. Moreover, this method also reflects the effect of
fine micro-pores as much as possible. Therefore, fractal
dimensions based on gray CT images complement pore ra-
tios, which can describe the fractal characteristics of pore
structures in rocks.
This work was supported by the National Natural Science Foundation of
China (10802092, 50974125), the National Basic Research Program of
China (2009CB724602, 2010CB226804), the Specialized Research Fund
for the Doctoral Program of Higher Education (20070290011) and the
Fundamental Research Funds for the Central Universities (2009QM03).
1 Liu P S. Introduction to Cellular Materials (in Chinese). Beijing:
Tsinghua University Press, 2004
2 Boer R. Reflections on the development of the theory of porous me-
dia. Appl Mech Rev, 2003, 56: R27–42
3 Tsakiroglou C D, Payatakes A C. Characterization of the pore struc-
ture of reservoir rocks with the aid of serial sectioning analysis, mer-
cury porosimetry and network simulation. Adv Water Resour, 2000,
23: 773–789
4 Song Y Q, Ryu S G, Sen P N. Determining multiple length scales in
rocks. Nature, 2000, 406: 178–181
5 Chen Q, Song Y Q. What is the shape of pores in natural rocks. J
Chem Phys, 2002, 116: 8247–8250
6 Radlinski A P, loannidis M A, Hinde A L, et al. Angstrom to milli-
meter characterization of sedimentary rock microstructure. J Colloid
Interf Sci, 2004, 274: 607–612
7 Xie Q, Jiang C X, Ling J M. Meso Mechanics of Rock Experiment
and Analysis (in Chinese). Chengdu: Southwest Jiaotong University
Press, 1997
8 Raynaud S, Fabre D, Mazerolle F, et al. Analysis of the internal
structure of rocks and characterization of mechanical deformation by
a non-destructive method: X-ray tomodensitometry. Tectonophysics,
1989, 159: 49–59
9 Buyukozturk O. Imaging of concrete structures. NDT and E Int, 1998,
31: 233–243
10 Pu Y B. The introduction of applying method for CT in frozen soil ex-
periment research (in Chinese). J Glaciol Geocry, 1993, 15: 196–198
11 Yang G S, Xie D Y, Zhang C Q, et al. CT identification of rock
damage properties (in Chinese). Chin J Rock Mech Eng, 1996, 15:
48–54
12 Yang G S, Xie D Y, Zhang C Q, et al. CT detection of damage of
coal and rock (in Chinese). Mech Engineer, 1996, 17: 14–16
13 Ge X R, Ren J X, Pu Y B, et al. Real-in time CT test of the rock me-
so-damage propagation law. Sci China Ser E-Tech Sci, 2001, 44:
328–336
14 Ge X R, Ren J X, Pu Y B, et al. Micro and Meso Experimental Stud-
ies on Damage Mechanics for Geotechnical Materials (in Chinese).
Beijing: Science Press, 2004
15 Ding W H, Wu Y Q, Pu Y B, et al. History and present situation of
X-ray Computerized Tomography (CT) of rocks (in Chinese). Seis-
molo Geo, 2003, 25: 467–476
16 Cnudde V, Masschaele B, Dierick M, et al. Recent progress in X-ray
CT as a geosciences tool. Appl Geochem, 2006, 21:826–832
17 Appoloni C R, Fernandes C P, Rodrigues C R O. X-ray microtomog-
raphy study of a sandstone reservoir rock. Nucl Instrum Meth A,
2007, 580: 629–632
18 Yang G S, Liu H. Study on the rock damage characteristics based on
the technique of CT image processing (in Chinese). J China Coal Soc,
2007, 32: 463–468
19 Yin X T, Dang F N, Ding W H, et al. Quantitative description of
crack based on the image measuring technique and CT test (in Chi-
nese). J Expl Mech, 2005, 20: 448–454
20 Ju Y, Yang Y M, Song Z D, et al. A statistical model for porous
structure of rocks. Sci China Ser E-Tech Sci, 2008, 51: 2040–2058
21 Ju Y, Yang Y M, Mao Y Z, et al. Laboratory investigation on mecha-
12. Peng R D, et al. Chinese Sci Bull November (2011) Vol.56 No.31 3357
nisms of stress wave propagations in porous media. Sci China Ser
E-Tech Sci, 2009, 52: 1374–1389
22 Ju Y, Wang H J, Yang Y M, et al. Numerical simulation of mecha-
nisms of deformation, failure and energy dissipation in porous rock
media subjected to wave stresses. Sci China Tech Sci-Tech Sci, 2010,
53: 1098–1113
23 Xie H P. Fractal geometry and its application to rock and soil materi-
als (in Chinese). Chin J Geotech Eng, 1992, 14: 14–24
24 Xie H P. Fractals in Rock Mechanics. Rotterdam: Balkema, 1993
25 Yang P L, Luo Y P, Shi Y C. Fractal feature of soil characterized by
weight distribution of grain size. Chinese Sci Bull, 1993, 38:
1896–1899
26 He C Z, Hua M Q. Fractal geometry description of reservoir pore
structure (in Chinese). Oil Gas Geology, 1998, 19: 15–23
27 Li T J, Wang Y H, Zhang M Y, et al. Fractal properties of crack in
rock and mechanism of rock-burst (in Chinese). Chin J Rock Mech
Eng, 2000, 19: 6–10
28 Lian J F, Shen N Q, Zhang J K. Application research on fractal theo-
ry in rockmass quality evaluation (in Chinese). Chin J Rock Mech
Eng, 2001, 20(Suppl): 1695–1698
29 Xue R, Hu R L, Mao L T. Fractal study on the microstructure varia-
tion of soft soils in consolidation process (in Chinese). China Civil
Enginee J, 2006, 39: 87–91
30 Fang H W, Chen M H, Chen Z H. Surface pore tension and adsorp-
tion characteristics of polluted sediment. Sci China Ser G-Phys Mech
Astron, 2008, 51: 1022–1028
31 Zhou H W, Zhang Y H, Li A M, et al. Experimental study on moving
boundaries of fluid flow in porous media. Chinese Sci Bull, 2008, 53:
2438–2445
32 Zhang J R, Tao G L, Huang L, et al. Porosity models for determining
the pore-size distribution of rocks and soils and their applications.
Chinese Sci Bull, 2010, 55: 3960–3970
33 Tao G L, Zhang J R. Two categories of fractal models of rock and
soil expressing volume and size-distribution of pores and grains.
Chinese Sci Bull, 2009, 54: 4458–4467
34 Feng J, Yu J Y. Determination fractal dimension of soil macropore us-
ing computed tomography (in Chinese). J Irrig Drain, 2005, 24: 26–28
35 Zhou S Z, Dang F N, Chen H Q, et al. Fractional characteristics of
damage and fracture of concrete under the uniaxial compression CT
test (in Chinese). J Hydroelectric Enginee, 2006, 25: 112–117
36 Chen X S, Wu A X, Yang B H, et al. Study on fractal characteristics
of pore structure of bulk rock-ore in dump leaching based on CT im-
age (in Chinese). Metal Mine, 2007, 385: 75–77
37 He J, Liu J L, Lv F. Characterizing fractal characteristics of soil pores
based on high-resolution digital CT images (in Chinese). Soils, 2008,
40: 662–666
38 Yin X T, Wang S L, Dang F N, et al. Study on fractal characteristics
of sandstone damage-fracture under CT test condition (in Chinese).
Chin J Rock Mech Eng, 2008, 27(Suppl): 2721–2726
39 Guo D M, Zuo J P, Zhang H, et al. Mechanics of crack propagation in
high performance concrete and its fractal dimensions based on ct ob-
servation(in Chinese). J Chinese Ceram Soc, 2009, 37: 1607–1612
40 Zhang C Z, Guo Z P, Zhang P, et al. Industrial CT Technology and
Principles (in Chinese). Beijing: Science Press, 2009
41 Peng R D, Xie H P, Ju Y. Computation method of fractal dimension
for 2-D digital image (in Chinese). J China Univer Min Technolo,
2004, 33: 19–24
42 Yang Y C, Peng R D, Zhou H W. Computation of fractal dimension
for digital image in a 3-D space (in Chinese). J China Univer Min
Technolo, 2009, 38: 251–258
Open Access This article is distributed under the terms of the Creative Commons Attribution License which permits any use, distribution, and reproduction
in any medium, provided the original author(s) and source are credited.