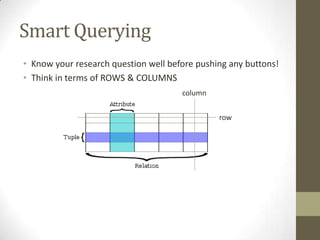
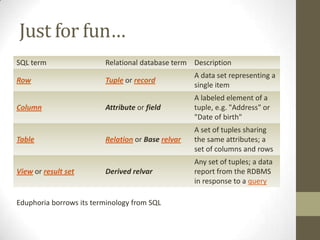
SlideShare a Scribd company logo
Data Analysis Fundamentals/Eduphoria Tutorial

Dr. Michael G. Richards
Director, Data & Accountability
District Testing Coordinator
What is a Relational Database?
• The invention of this database system has standardized the
way that data is stored and processed.
• A relational database consists of a collection of tables that
store particular sets of data.
• The concept of a relational database derives from the
principles of relational algebra, developed by E. F. Codd in the
1970s.
• Relational databases are built-in to software like EDUPHORIA,
so the database is generally invisible to the user.
What Does One Do With a Relational
Database?
1.
2.

Upload data
Query
Querying

1.
2.

Write code (SQL, R, SAS)
Employ a Graphic User Interface (GUI)
Smart Querying
• Know your research question well before pushing any buttons!
• Think in terms of ROWS & COLUMNS
column
row
Just for fun…
SQL term

Relational database term Description

Row

Tuple or record

A data set representing a
single item

Attribute or field

A labeled element of a
tuple, e.g. "Address" or
"Date of birth"

Relation or Base relvar

A set of tuples sharing
the same attributes; a
set of columns and rows

Derived relvar

Any set of tuples; a data
report from the RDBMS
in response to a query

Column

Table

View or result set

Eduphoria borrows its terminology from SQL
Shopping Analogy
Choosing
your mall is
equivalent
to choosing
ROWS

Filling your
shopping
cart is
equivalent
to choosing
COLUMNS
ROW/COLUMN Quiz
Q1. There is a teacher of 32 8th-grade math students and the teacher
has just given a DA and wants to debrief with her students. She
needs a quick read on how they did on each item.

A1. ROWS: students; COLUMNS: test items
Bonus: What will appear in the table cells?
answer choice and disposition
Let’s Complicate Things (Slightly)
• The BY function
• It is hidden by the GUI in Eduphoria
• Often used to create additional levels in either ROWS or
COLUMNS
• Ex: Scores: SE% correct BY ethnicity (extra level of COLUMNS)
• Student scores BY teacher (could be extra level of ROWS)
ROW/COLUMN Quiz
Q2. I want to know if the fifth graders did better this year on STAAR
math than they did last year.

A2. ROWS: students; COLUMNS: scores by test
Choosing ROWS through the Wizard
• Not as apparent as choosing COLUMNS
• You begin choosing ROWS as soon as you begin querying the
database by narrowing down the data (driving to the mall)
• “Select a Test”

• “How do you want to view the results?”

• “Select a timeframe”

Note: almost always choose “Where students are now”
Choosing COLUMNS Through the Wizard

Next
COLUMNS

My preference:

Next
Let’s Run the 2 Quiz Questions in Eduphoria

1.
2.
3.
4.
5.
6.
7.

Using (on not using) the Wizard
Color coding/heat mapping
Data pivot
Summary view options
Graphing
Editing
Exporting
The 2 Questions
• Q1. There is a teacher of 32 8th-grade math students and the
teacher has just given a DA and wants to debrief with her
students. She needs a quick read on how they did on each
item.
• Q2. I want to know if all 5th-graders did better this year on
STAAR math than they did last year.
Exporting Data from Eduphoria
• For distribution analysis
• For inferential analysis
Descriptive Stats
12 13
Inferential Stats: Significance

Signal
Noise

Significant difference or
relationship?

α = 0.05
Difference in the 5th Grade Math
Performance?
We are only 74% sure
FERPA
• Do not send emails with text or datasets (attached or
otherwise) that contain information identifying students
• All data analysis that leaves the campus or the district offices
must be vetted through C&I
Q&A

More Related Content

What's hot

SPSS an intro...
SPSS an intro...SPSS an intro...
SPSS an intro...
Jithin Zcs
 
Predict oscars (4:17)
Predict oscars (4:17)Predict oscars (4:17)
Predict oscars (4:17)
Thinkful
 

What's hot (20)

Business Journalism Professors 2014: Excel for Journalists by Steve Doig
Business Journalism Professors 2014: Excel for Journalists by Steve DoigBusiness Journalism Professors 2014: Excel for Journalists by Steve Doig
Business Journalism Professors 2014: Excel for Journalists by Steve Doig
 
Excel for Journalists by Steve Doig
Excel for Journalists by Steve DoigExcel for Journalists by Steve Doig
Excel for Journalists by Steve Doig
 
Various statistical software's in data analysis.
Various statistical software's in data analysis.Various statistical software's in data analysis.
Various statistical software's in data analysis.
 
SPSS an intro...
SPSS an intro...SPSS an intro...
SPSS an intro...
 
What Is the Use of SPSS in Data Analysis
What Is the Use of SPSS in Data AnalysisWhat Is the Use of SPSS in Data Analysis
What Is the Use of SPSS in Data Analysis
 
Predict oscars (4:17)
Predict oscars (4:17)Predict oscars (4:17)
Predict oscars (4:17)
 
603s129
603s129603s129
603s129
 
SPSS
SPSSSPSS
SPSS
 
ICT3909
ICT3909ICT3909
ICT3909
 
WRITING_SERVICES
WRITING_SERVICESWRITING_SERVICES
WRITING_SERVICES
 
An introduction to spss
An introduction to spssAn introduction to spss
An introduction to spss
 
Introduction to spss: define variables
Introduction to spss: define variablesIntroduction to spss: define variables
Introduction to spss: define variables
 
Statistical software
Statistical softwareStatistical software
Statistical software
 
What is SPSS?
What is SPSS?What is SPSS?
What is SPSS?
 
SPSS introduction Presentation
SPSS introduction Presentation SPSS introduction Presentation
SPSS introduction Presentation
 
Sql
SqlSql
Sql
 
Spss
SpssSpss
Spss
 
Introduction to spss 2
Introduction to spss 2Introduction to spss 2
Introduction to spss 2
 
An Introduction to SPSS
An Introduction to SPSSAn Introduction to SPSS
An Introduction to SPSS
 
Big Data LDN 2018: TIPS AND TRICKS TO WRANGLE BIG, DIRTY DATA
Big Data LDN 2018: TIPS AND TRICKS TO WRANGLE BIG, DIRTY DATABig Data LDN 2018: TIPS AND TRICKS TO WRANGLE BIG, DIRTY DATA
Big Data LDN 2018: TIPS AND TRICKS TO WRANGLE BIG, DIRTY DATA
 

Similar to Foundations of Data Analytics

Whats A Data Warehouse
Whats A Data WarehouseWhats A Data Warehouse
Whats A Data Warehouse
None None
 
Info systems databases
Info systems databasesInfo systems databases
Info systems databases
MR Z
 
Whats a datawarehouse
Whats a datawarehouseWhats a datawarehouse
Whats a datawarehouse
vijjudarling
 
Math kindergarten training
Math kindergarten trainingMath kindergarten training
Math kindergarten training
Anthony Smith
 

Similar to Foundations of Data Analytics (20)

Whats A Data Warehouse
Whats A Data WarehouseWhats A Data Warehouse
Whats A Data Warehouse
 
YASQLT – Yet Another SQL Tutor. A Pragmatic Approach
YASQLT – Yet Another SQL Tutor. A Pragmatic ApproachYASQLT – Yet Another SQL Tutor. A Pragmatic Approach
YASQLT – Yet Another SQL Tutor. A Pragmatic Approach
 
unit01-Activity-SQL-Query-Review-1.pptx
unit01-Activity-SQL-Query-Review-1.pptxunit01-Activity-SQL-Query-Review-1.pptx
unit01-Activity-SQL-Query-Review-1.pptx
 
Info systems databases
Info systems databasesInfo systems databases
Info systems databases
 
Hpd 1
Hpd 1Hpd 1
Hpd 1
 
Whats a datawarehouse
Whats a datawarehouseWhats a datawarehouse
Whats a datawarehouse
 
Learning from data
Learning from dataLearning from data
Learning from data
 
My sql
My sqlMy sql
My sql
 
04242024_CCC TUG_Joins and Relationships
04242024_CCC TUG_Joins and Relationships04242024_CCC TUG_Joins and Relationships
04242024_CCC TUG_Joins and Relationships
 
2 Day Android Workshop
2 Day Android Workshop2 Day Android Workshop
2 Day Android Workshop
 
Database Systems - Lecture Week 1
Database Systems - Lecture Week 1Database Systems - Lecture Week 1
Database Systems - Lecture Week 1
 
WSU new standards mean new baseline
WSU new standards mean new baselineWSU new standards mean new baseline
WSU new standards mean new baseline
 
An hour with Database and SQL
An hour with Database and SQLAn hour with Database and SQL
An hour with Database and SQL
 
MULTI-DIMENSIONAL DATABASES.pptx
MULTI-DIMENSIONAL DATABASES.pptxMULTI-DIMENSIONAL DATABASES.pptx
MULTI-DIMENSIONAL DATABASES.pptx
 
RDBMS Model
RDBMS ModelRDBMS Model
RDBMS Model
 
APSY3206 Lecture 1.pptx
APSY3206 Lecture 1.pptxAPSY3206 Lecture 1.pptx
APSY3206 Lecture 1.pptx
 
Data_base.pptx
Data_base.pptxData_base.pptx
Data_base.pptx
 
Webinar 11-13-14 - DIY E-Resources Management: Basics of Information Architec...
Webinar 11-13-14 - DIY E-Resources Management: Basics of Information Architec...Webinar 11-13-14 - DIY E-Resources Management: Basics of Information Architec...
Webinar 11-13-14 - DIY E-Resources Management: Basics of Information Architec...
 
Math kindergarten training
Math kindergarten trainingMath kindergarten training
Math kindergarten training
 
DATABASE MANAGEMENT SYSTEM
DATABASE MANAGEMENT SYSTEMDATABASE MANAGEMENT SYSTEM
DATABASE MANAGEMENT SYSTEM
 

Recently uploaded

Adversarial Attention Modeling for Multi-dimensional Emotion Regression.pdf
Adversarial Attention Modeling for Multi-dimensional Emotion Regression.pdfAdversarial Attention Modeling for Multi-dimensional Emotion Regression.pdf
Adversarial Attention Modeling for Multi-dimensional Emotion Regression.pdf
Po-Chuan Chen
 
Additional Benefits for Employee Website.pdf
Additional Benefits for Employee Website.pdfAdditional Benefits for Employee Website.pdf
Additional Benefits for Employee Website.pdf
joachimlavalley1
 

Recently uploaded (20)

Palestine last event orientationfvgnh .pptx
Palestine last event orientationfvgnh .pptxPalestine last event orientationfvgnh .pptx
Palestine last event orientationfvgnh .pptx
 
How to Create Map Views in the Odoo 17 ERP
How to Create Map Views in the Odoo 17 ERPHow to Create Map Views in the Odoo 17 ERP
How to Create Map Views in the Odoo 17 ERP
 
Jose-Rizal-and-Philippine-Nationalism-National-Symbol-2.pptx
Jose-Rizal-and-Philippine-Nationalism-National-Symbol-2.pptxJose-Rizal-and-Philippine-Nationalism-National-Symbol-2.pptx
Jose-Rizal-and-Philippine-Nationalism-National-Symbol-2.pptx
 
Synthetic Fiber Construction in lab .pptx
Synthetic Fiber Construction in lab .pptxSynthetic Fiber Construction in lab .pptx
Synthetic Fiber Construction in lab .pptx
 
Home assignment II on Spectroscopy 2024 Answers.pdf
Home assignment II on Spectroscopy 2024 Answers.pdfHome assignment II on Spectroscopy 2024 Answers.pdf
Home assignment II on Spectroscopy 2024 Answers.pdf
 
Salient features of Environment protection Act 1986.pptx
Salient features of Environment protection Act 1986.pptxSalient features of Environment protection Act 1986.pptx
Salient features of Environment protection Act 1986.pptx
 
Basic Civil Engg Notes_Chapter-6_Environment Pollution & Engineering
Basic Civil Engg Notes_Chapter-6_Environment Pollution & EngineeringBasic Civil Engg Notes_Chapter-6_Environment Pollution & Engineering
Basic Civil Engg Notes_Chapter-6_Environment Pollution & Engineering
 
How to Split Bills in the Odoo 17 POS Module
How to Split Bills in the Odoo 17 POS ModuleHow to Split Bills in the Odoo 17 POS Module
How to Split Bills in the Odoo 17 POS Module
 
Instructions for Submissions thorugh G- Classroom.pptx
Instructions for Submissions thorugh G- Classroom.pptxInstructions for Submissions thorugh G- Classroom.pptx
Instructions for Submissions thorugh G- Classroom.pptx
 
Adversarial Attention Modeling for Multi-dimensional Emotion Regression.pdf
Adversarial Attention Modeling for Multi-dimensional Emotion Regression.pdfAdversarial Attention Modeling for Multi-dimensional Emotion Regression.pdf
Adversarial Attention Modeling for Multi-dimensional Emotion Regression.pdf
 
Additional Benefits for Employee Website.pdf
Additional Benefits for Employee Website.pdfAdditional Benefits for Employee Website.pdf
Additional Benefits for Employee Website.pdf
 
Benefits and Challenges of Using Open Educational Resources
Benefits and Challenges of Using Open Educational ResourcesBenefits and Challenges of Using Open Educational Resources
Benefits and Challenges of Using Open Educational Resources
 
Phrasal Verbs.XXXXXXXXXXXXXXXXXXXXXXXXXX
Phrasal Verbs.XXXXXXXXXXXXXXXXXXXXXXXXXXPhrasal Verbs.XXXXXXXXXXXXXXXXXXXXXXXXXX
Phrasal Verbs.XXXXXXXXXXXXXXXXXXXXXXXXXX
 
Sectors of the Indian Economy - Class 10 Study Notes pdf
Sectors of the Indian Economy - Class 10 Study Notes pdfSectors of the Indian Economy - Class 10 Study Notes pdf
Sectors of the Indian Economy - Class 10 Study Notes pdf
 
Students, digital devices and success - Andreas Schleicher - 27 May 2024..pptx
Students, digital devices and success - Andreas Schleicher - 27 May 2024..pptxStudents, digital devices and success - Andreas Schleicher - 27 May 2024..pptx
Students, digital devices and success - Andreas Schleicher - 27 May 2024..pptx
 
Danh sách HSG Bộ môn cấp trường - Cấp THPT.pdf
Danh sách HSG Bộ môn cấp trường - Cấp THPT.pdfDanh sách HSG Bộ môn cấp trường - Cấp THPT.pdf
Danh sách HSG Bộ môn cấp trường - Cấp THPT.pdf
 
The Art Pastor's Guide to Sabbath | Steve Thomason
The Art Pastor's Guide to Sabbath | Steve ThomasonThe Art Pastor's Guide to Sabbath | Steve Thomason
The Art Pastor's Guide to Sabbath | Steve Thomason
 
INU_CAPSTONEDESIGN_비밀번호486_업로드용 발표자료.pdf
INU_CAPSTONEDESIGN_비밀번호486_업로드용 발표자료.pdfINU_CAPSTONEDESIGN_비밀번호486_업로드용 발표자료.pdf
INU_CAPSTONEDESIGN_비밀번호486_업로드용 발표자료.pdf
 
NCERT Solutions Power Sharing Class 10 Notes pdf
NCERT Solutions Power Sharing Class 10 Notes pdfNCERT Solutions Power Sharing Class 10 Notes pdf
NCERT Solutions Power Sharing Class 10 Notes pdf
 
Matatag-Curriculum and the 21st Century Skills Presentation.pptx
Matatag-Curriculum and the 21st Century Skills Presentation.pptxMatatag-Curriculum and the 21st Century Skills Presentation.pptx
Matatag-Curriculum and the 21st Century Skills Presentation.pptx
 

Foundations of Data Analytics

  • 1. Data Analysis Fundamentals/Eduphoria Tutorial Dr. Michael G. Richards Director, Data & Accountability District Testing Coordinator
  • 2. What is a Relational Database? • The invention of this database system has standardized the way that data is stored and processed. • A relational database consists of a collection of tables that store particular sets of data. • The concept of a relational database derives from the principles of relational algebra, developed by E. F. Codd in the 1970s. • Relational databases are built-in to software like EDUPHORIA, so the database is generally invisible to the user.
  • 3. What Does One Do With a Relational Database? 1. 2. Upload data Query
  • 4. Querying 1. 2. Write code (SQL, R, SAS) Employ a Graphic User Interface (GUI)
  • 5. Smart Querying • Know your research question well before pushing any buttons! • Think in terms of ROWS & COLUMNS column row
  • 6. Just for fun… SQL term Relational database term Description Row Tuple or record A data set representing a single item Attribute or field A labeled element of a tuple, e.g. "Address" or "Date of birth" Relation or Base relvar A set of tuples sharing the same attributes; a set of columns and rows Derived relvar Any set of tuples; a data report from the RDBMS in response to a query Column Table View or result set Eduphoria borrows its terminology from SQL
  • 7. Shopping Analogy Choosing your mall is equivalent to choosing ROWS Filling your shopping cart is equivalent to choosing COLUMNS
  • 8. ROW/COLUMN Quiz Q1. There is a teacher of 32 8th-grade math students and the teacher has just given a DA and wants to debrief with her students. She needs a quick read on how they did on each item. A1. ROWS: students; COLUMNS: test items Bonus: What will appear in the table cells? answer choice and disposition
  • 9. Let’s Complicate Things (Slightly) • The BY function • It is hidden by the GUI in Eduphoria • Often used to create additional levels in either ROWS or COLUMNS • Ex: Scores: SE% correct BY ethnicity (extra level of COLUMNS) • Student scores BY teacher (could be extra level of ROWS)
  • 10. ROW/COLUMN Quiz Q2. I want to know if the fifth graders did better this year on STAAR math than they did last year. A2. ROWS: students; COLUMNS: scores by test
  • 11. Choosing ROWS through the Wizard • Not as apparent as choosing COLUMNS • You begin choosing ROWS as soon as you begin querying the database by narrowing down the data (driving to the mall) • “Select a Test” • “How do you want to view the results?” • “Select a timeframe” Note: almost always choose “Where students are now”
  • 12. Choosing COLUMNS Through the Wizard Next
  • 14. Let’s Run the 2 Quiz Questions in Eduphoria 1. 2. 3. 4. 5. 6. 7. Using (on not using) the Wizard Color coding/heat mapping Data pivot Summary view options Graphing Editing Exporting
  • 15. The 2 Questions • Q1. There is a teacher of 32 8th-grade math students and the teacher has just given a DA and wants to debrief with her students. She needs a quick read on how they did on each item. • Q2. I want to know if all 5th-graders did better this year on STAAR math than they did last year.
  • 16. Exporting Data from Eduphoria • For distribution analysis • For inferential analysis
  • 18. Inferential Stats: Significance Signal Noise Significant difference or relationship? α = 0.05
  • 19. Difference in the 5th Grade Math Performance?
  • 20. We are only 74% sure
  • 21. FERPA • Do not send emails with text or datasets (attached or otherwise) that contain information identifying students • All data analysis that leaves the campus or the district offices must be vetted through C&I
  • 22. Q&A