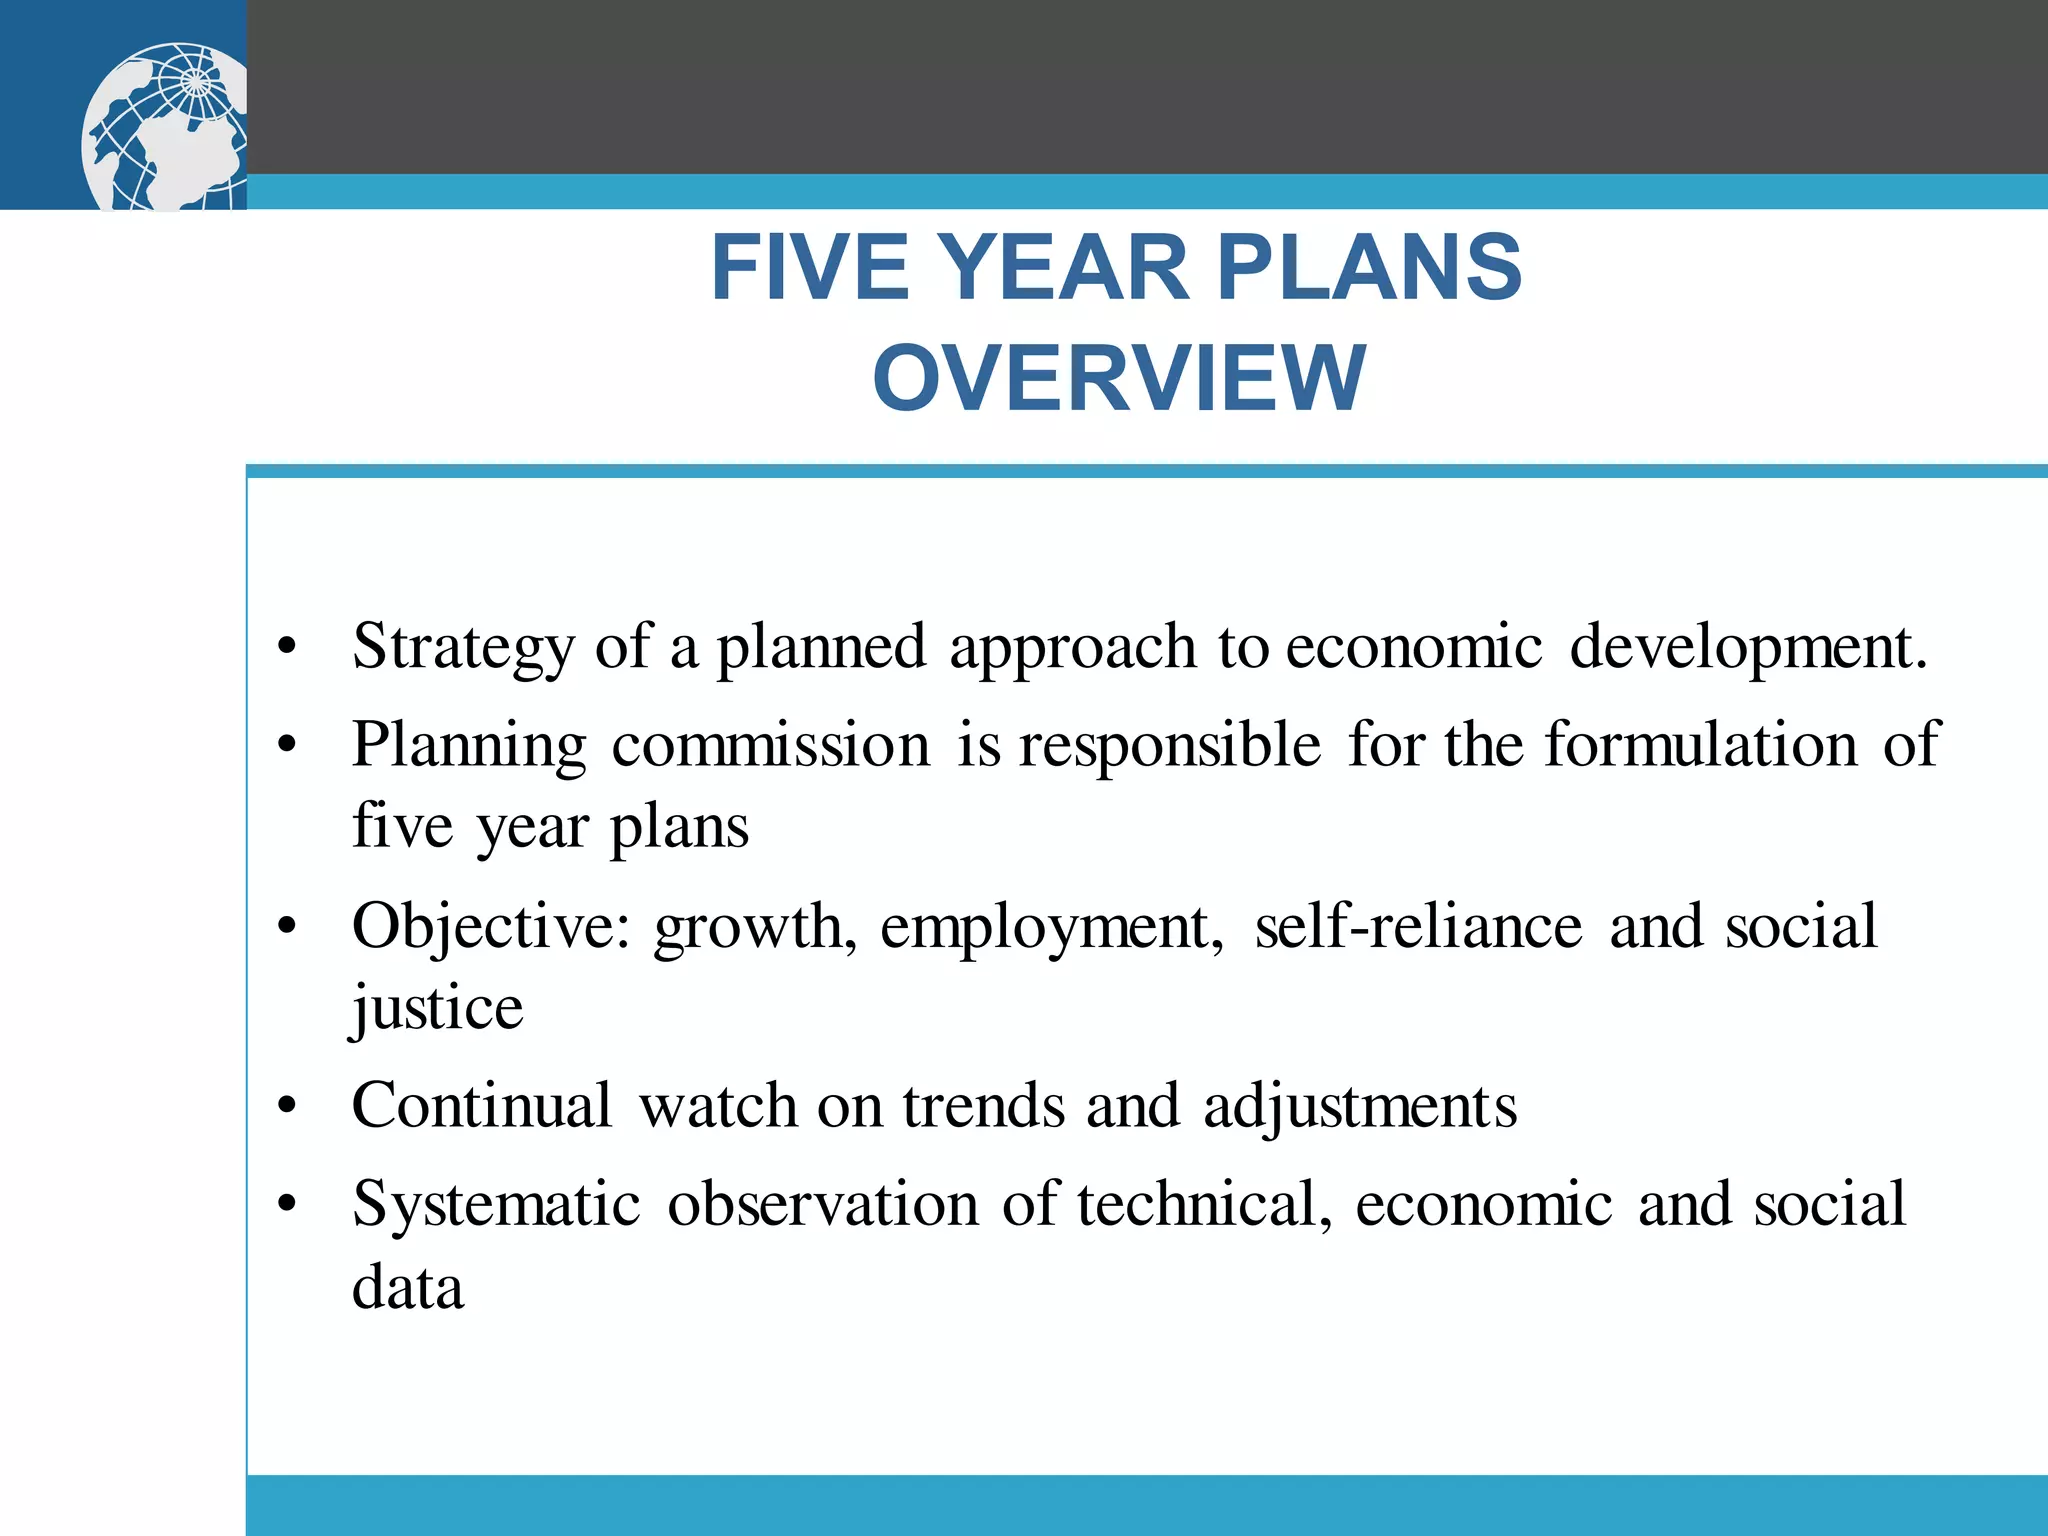
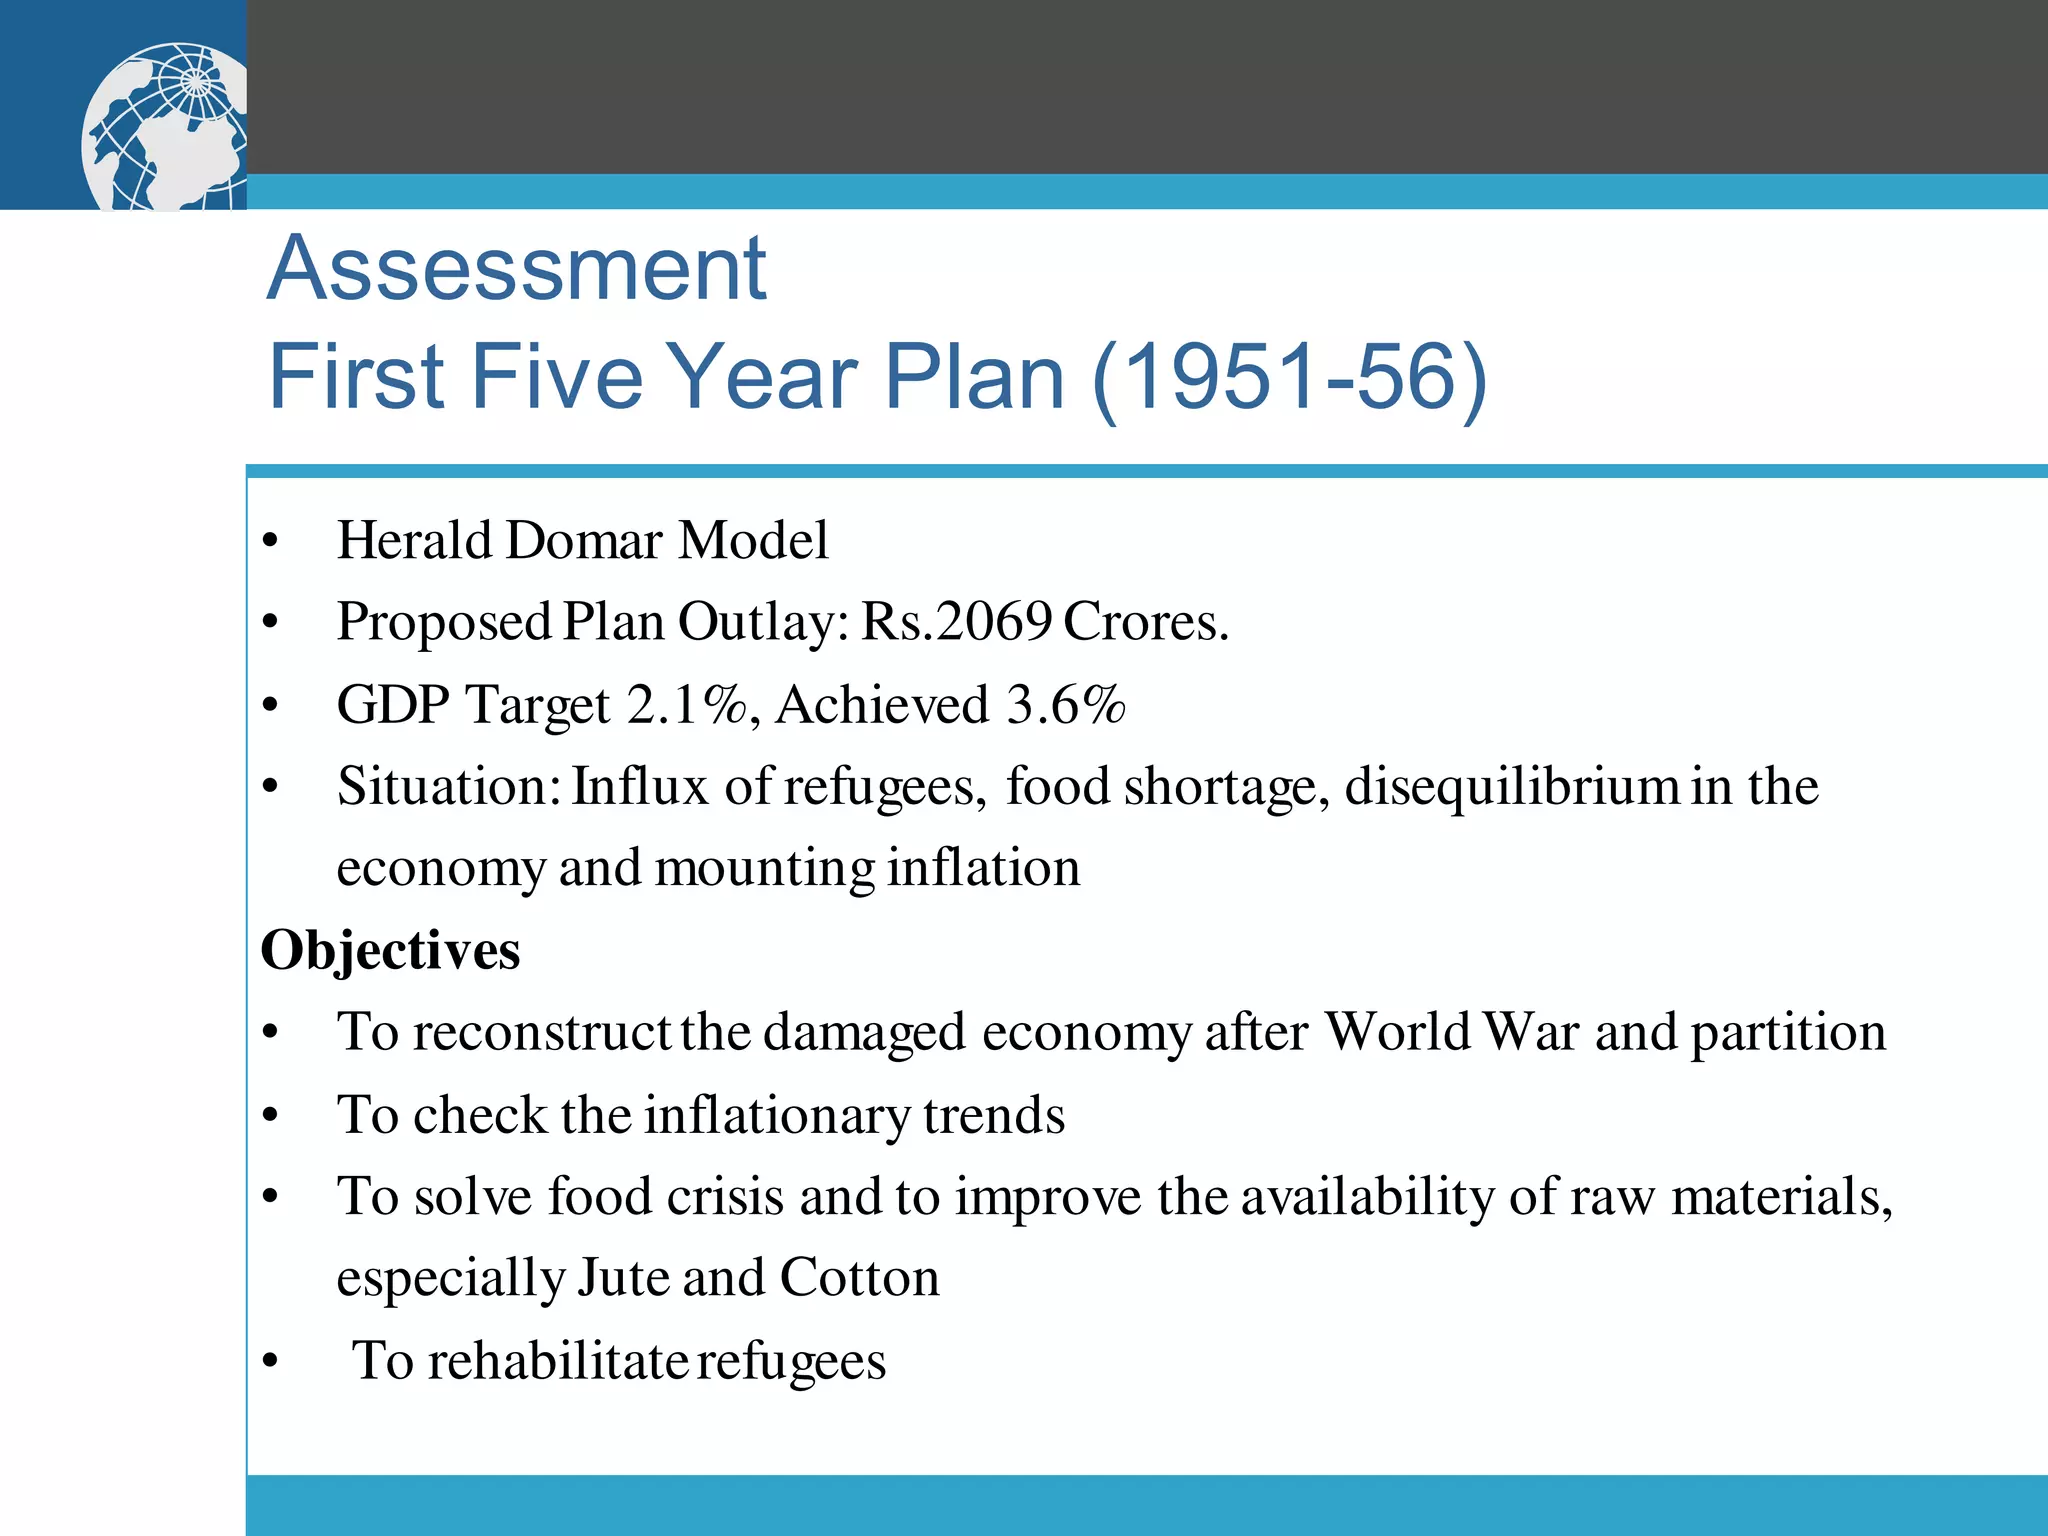
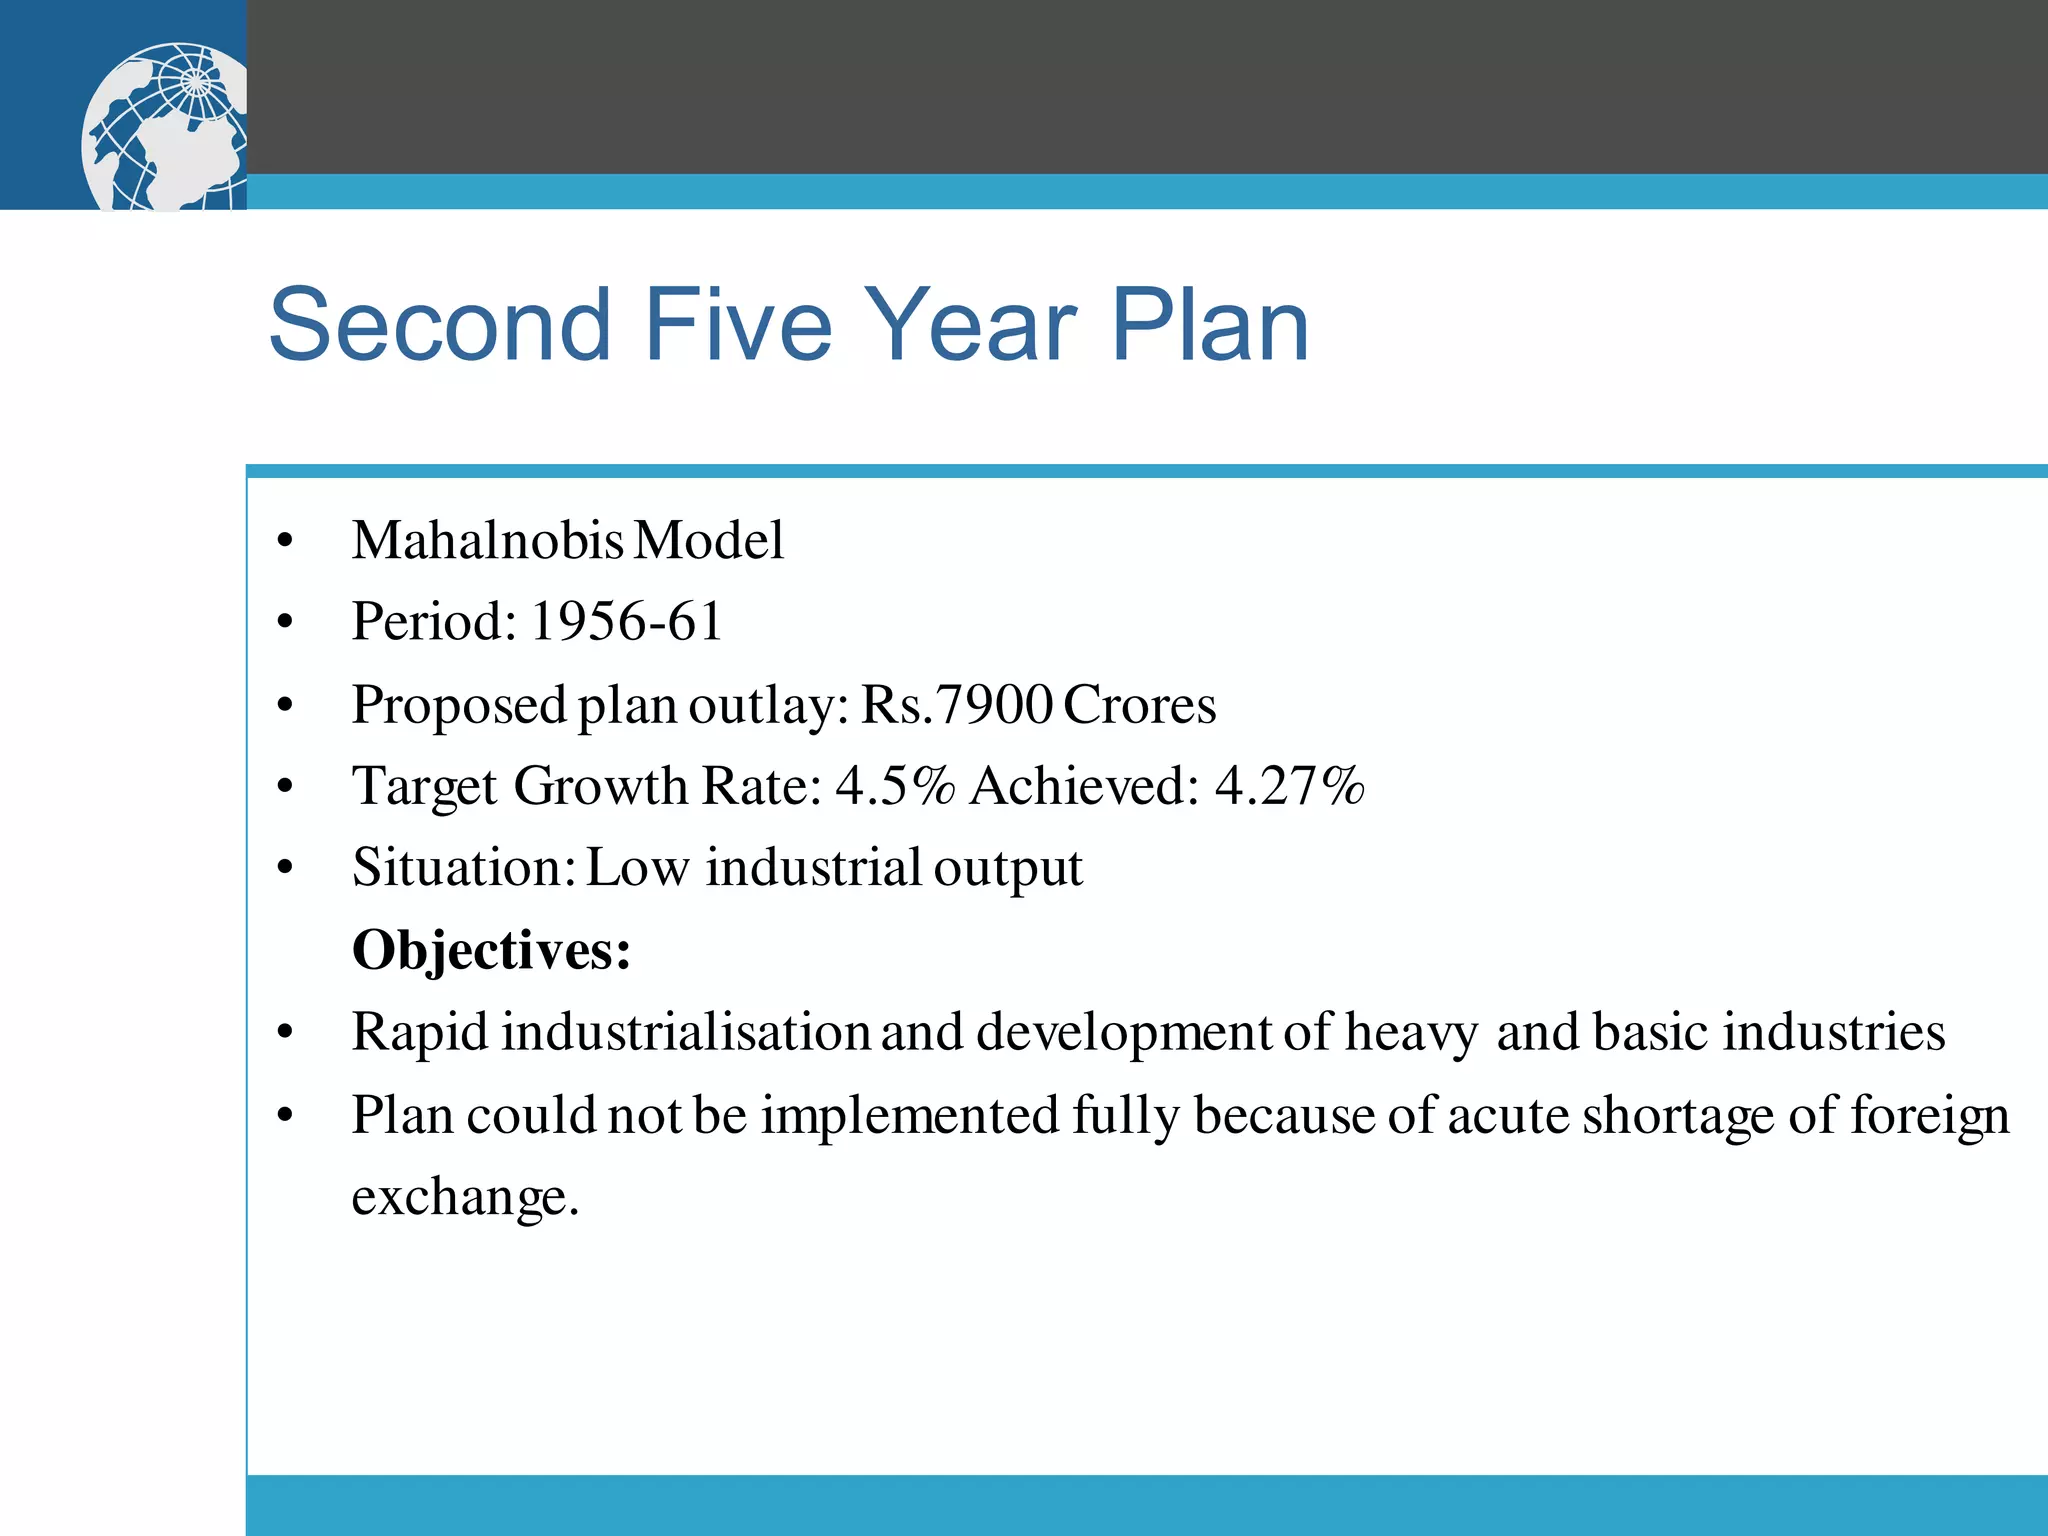
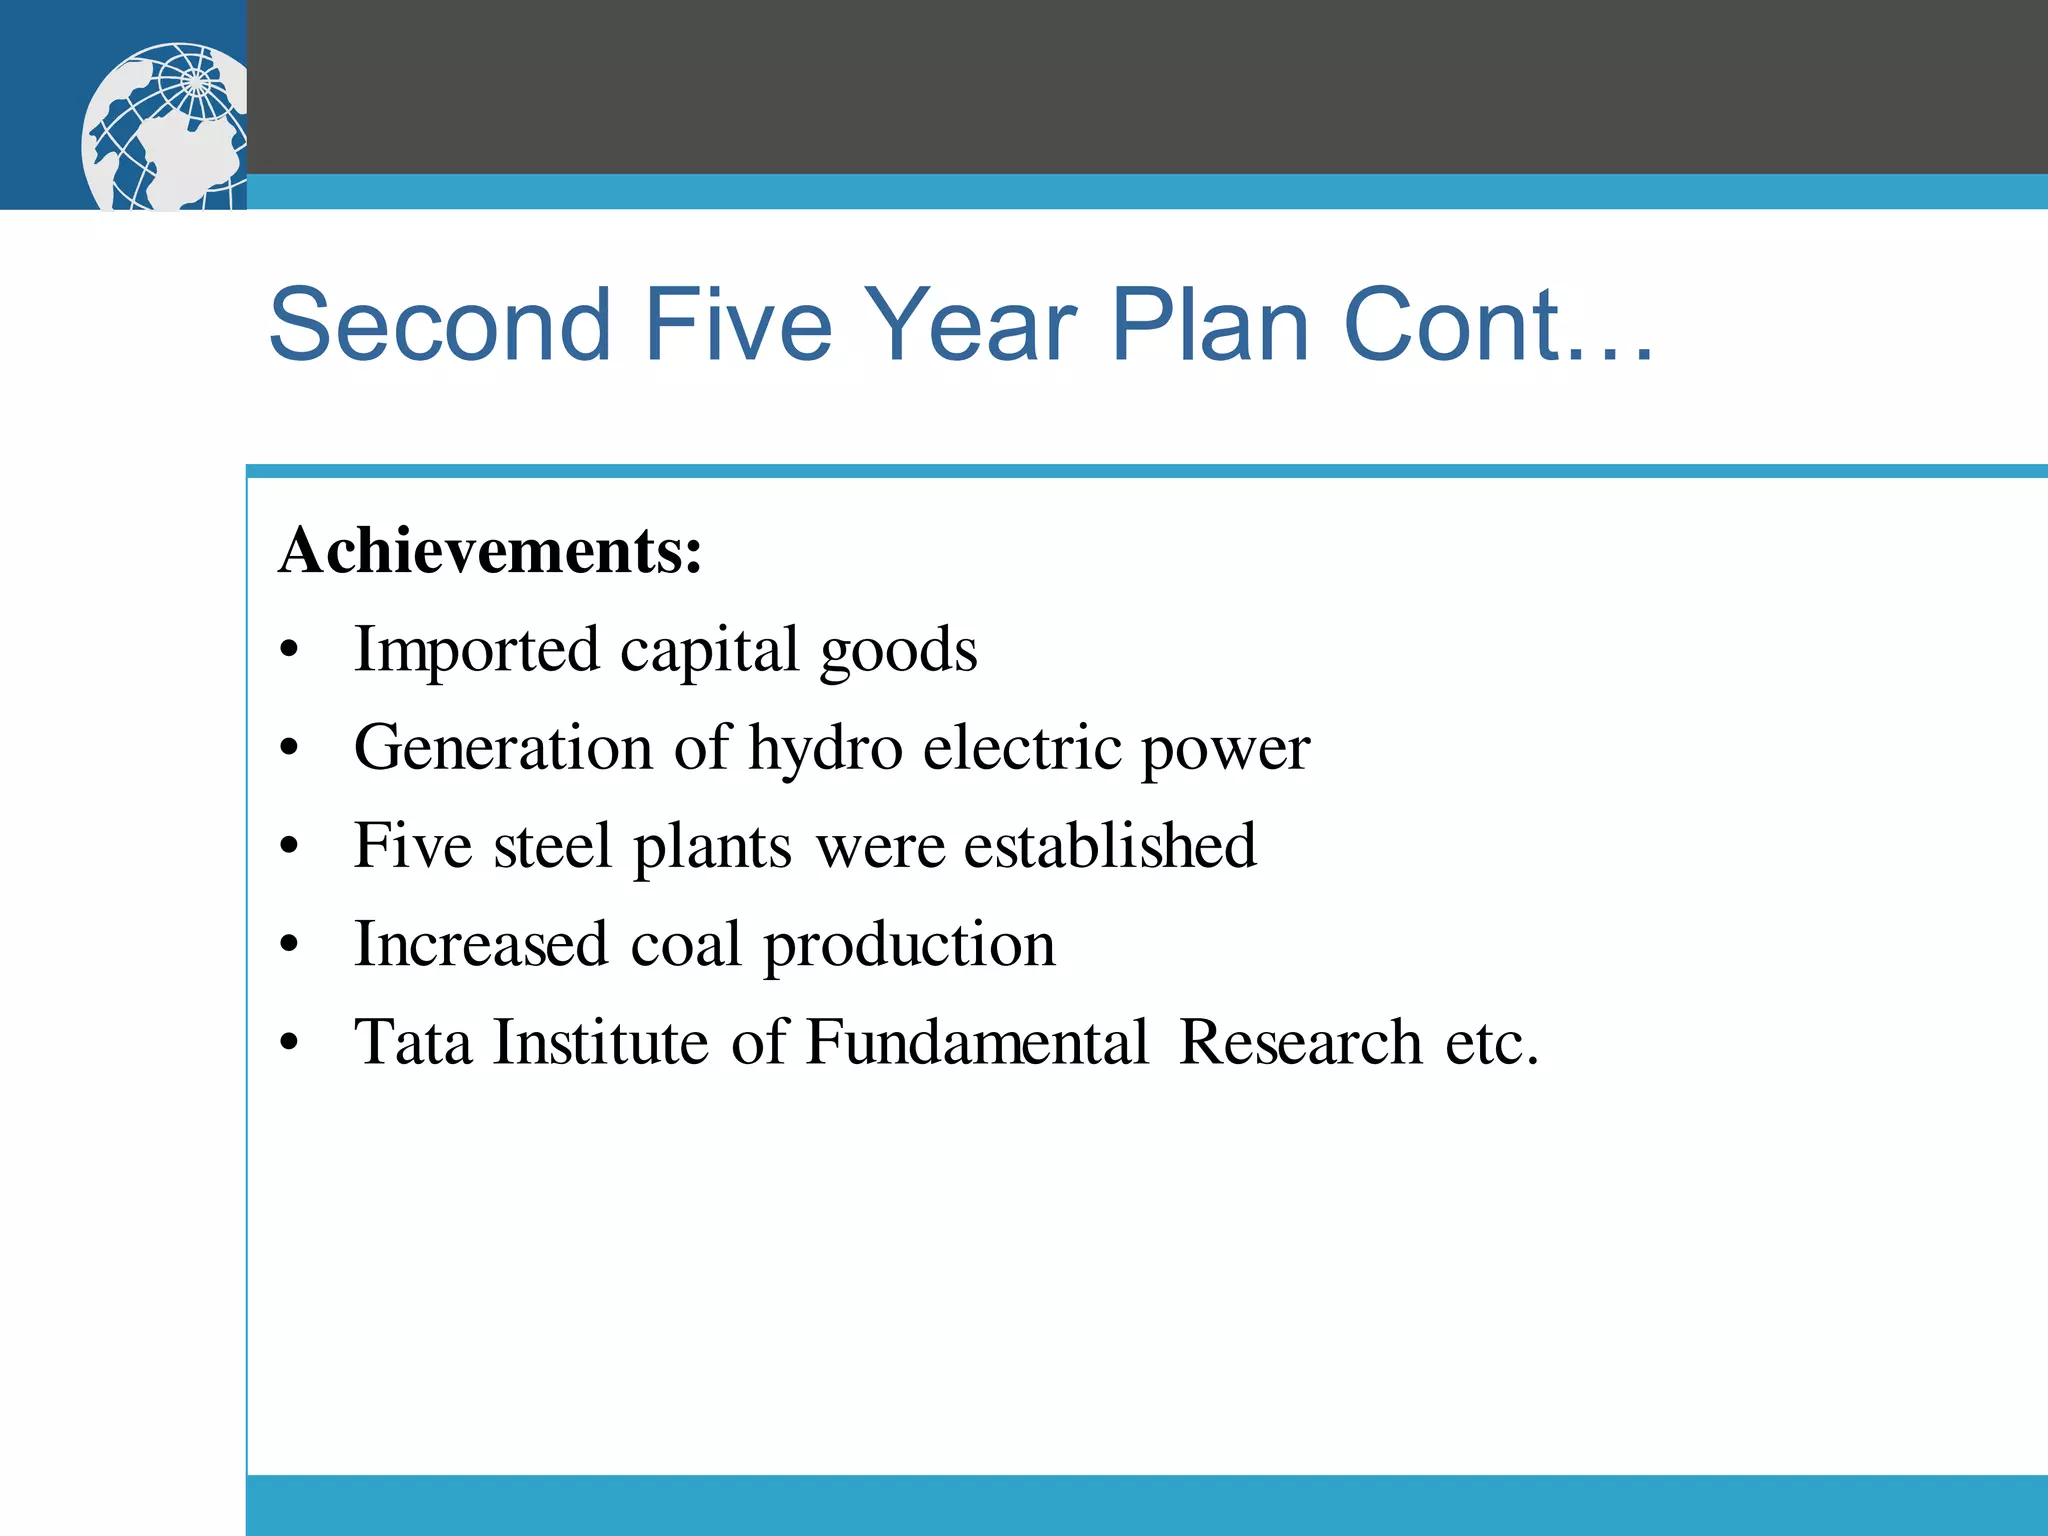
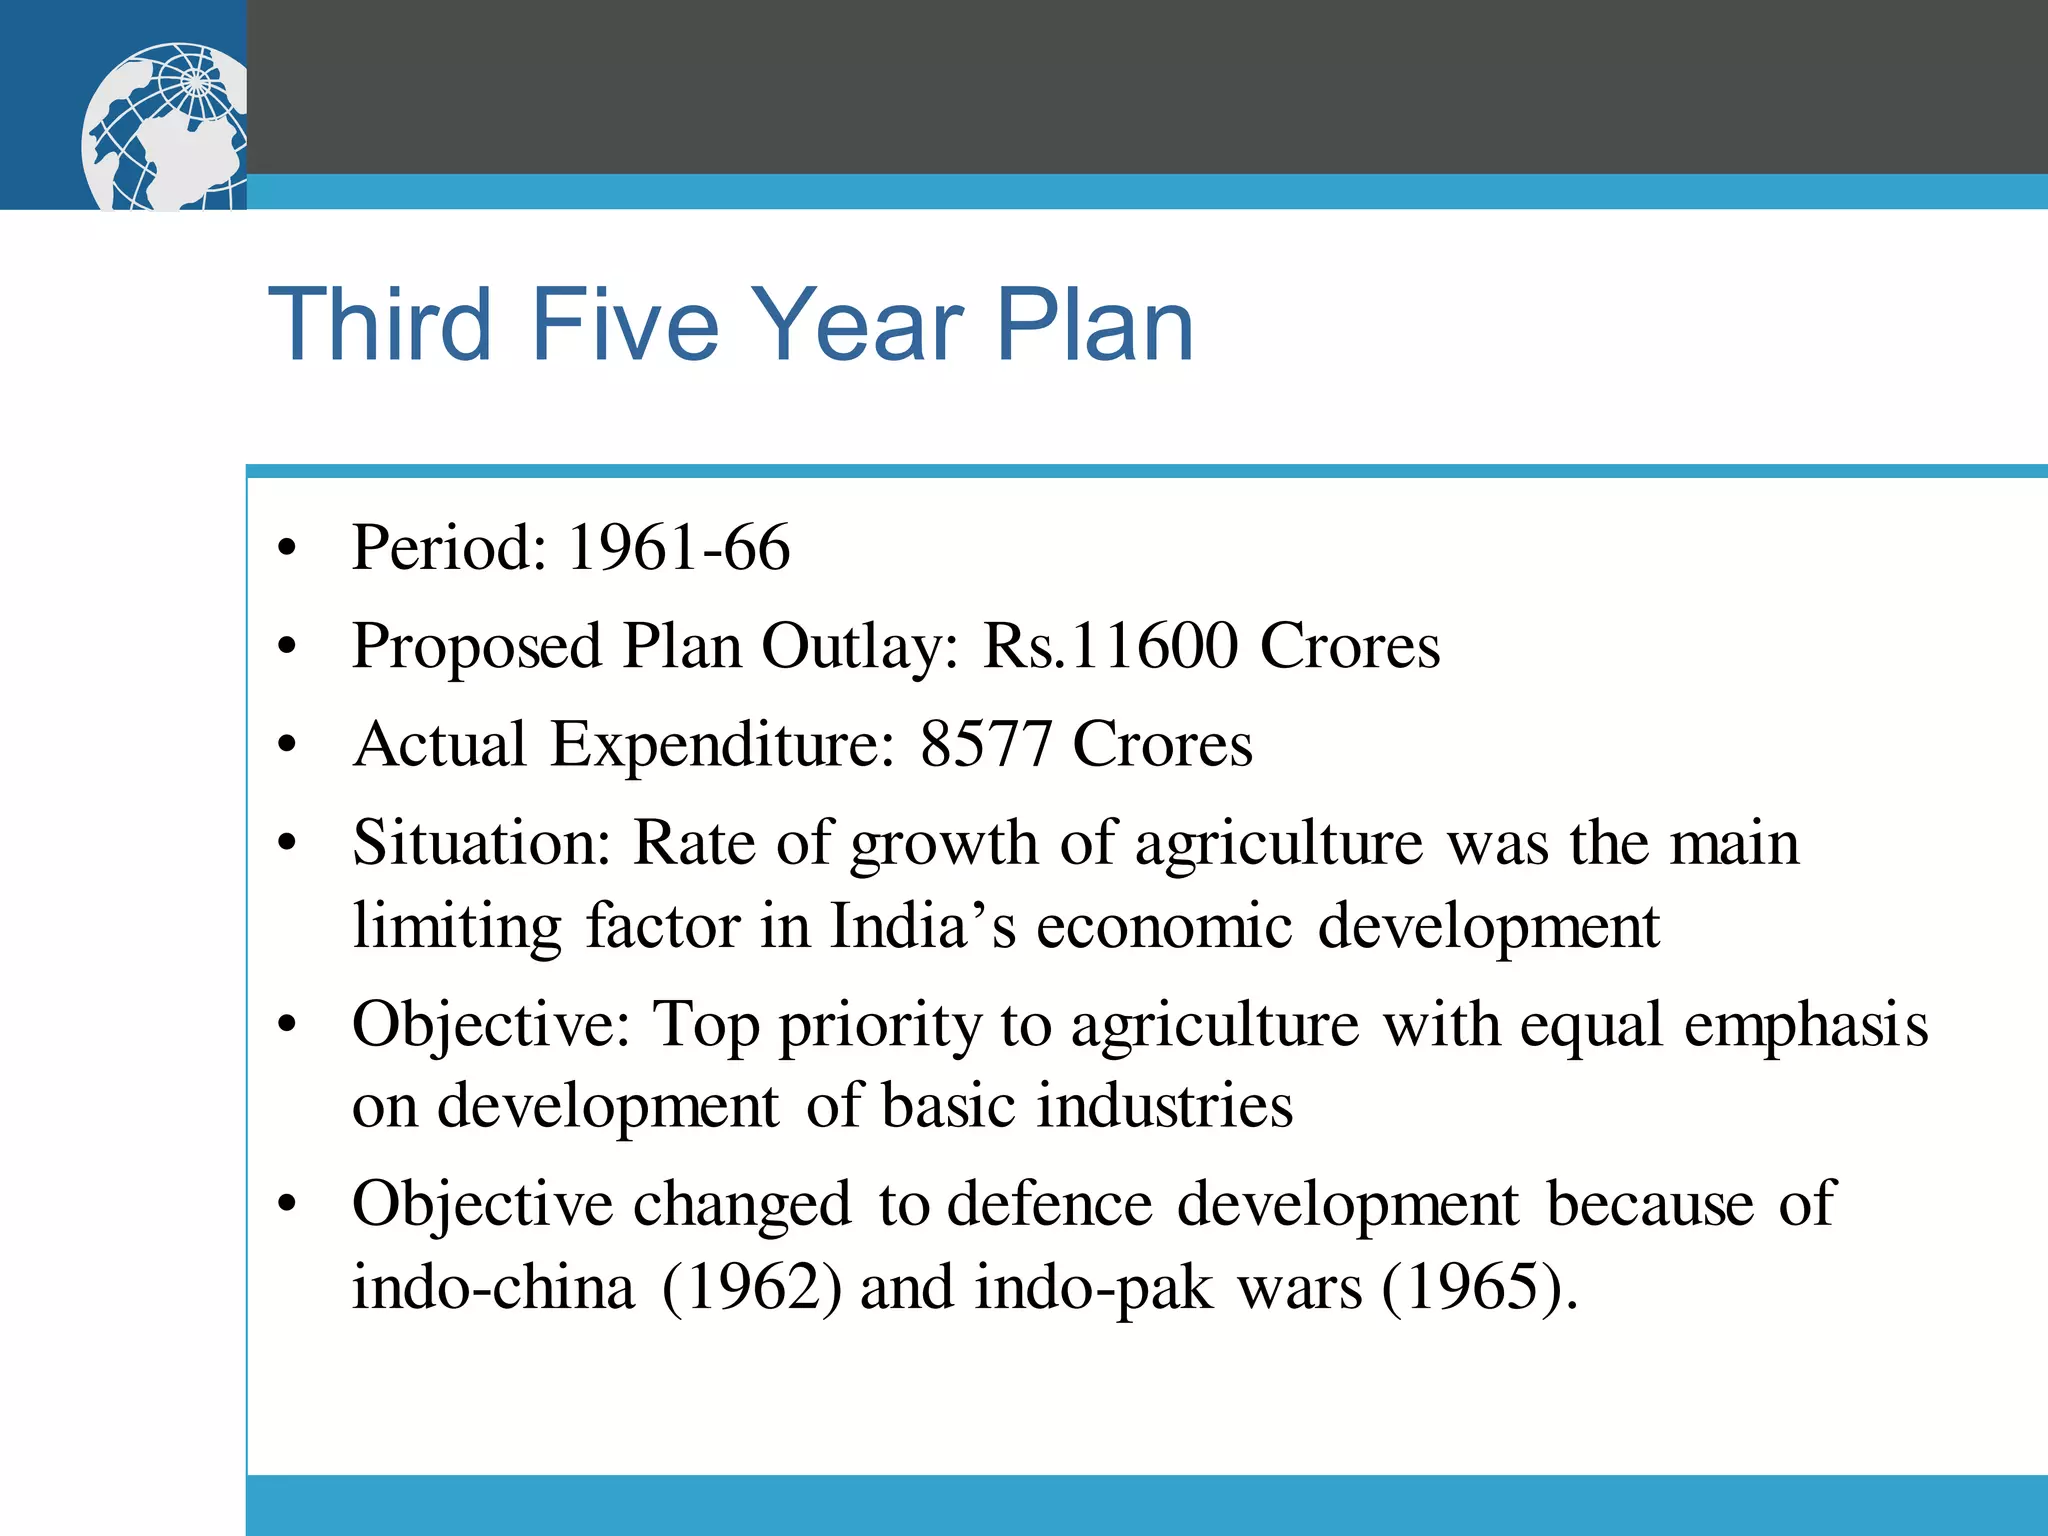
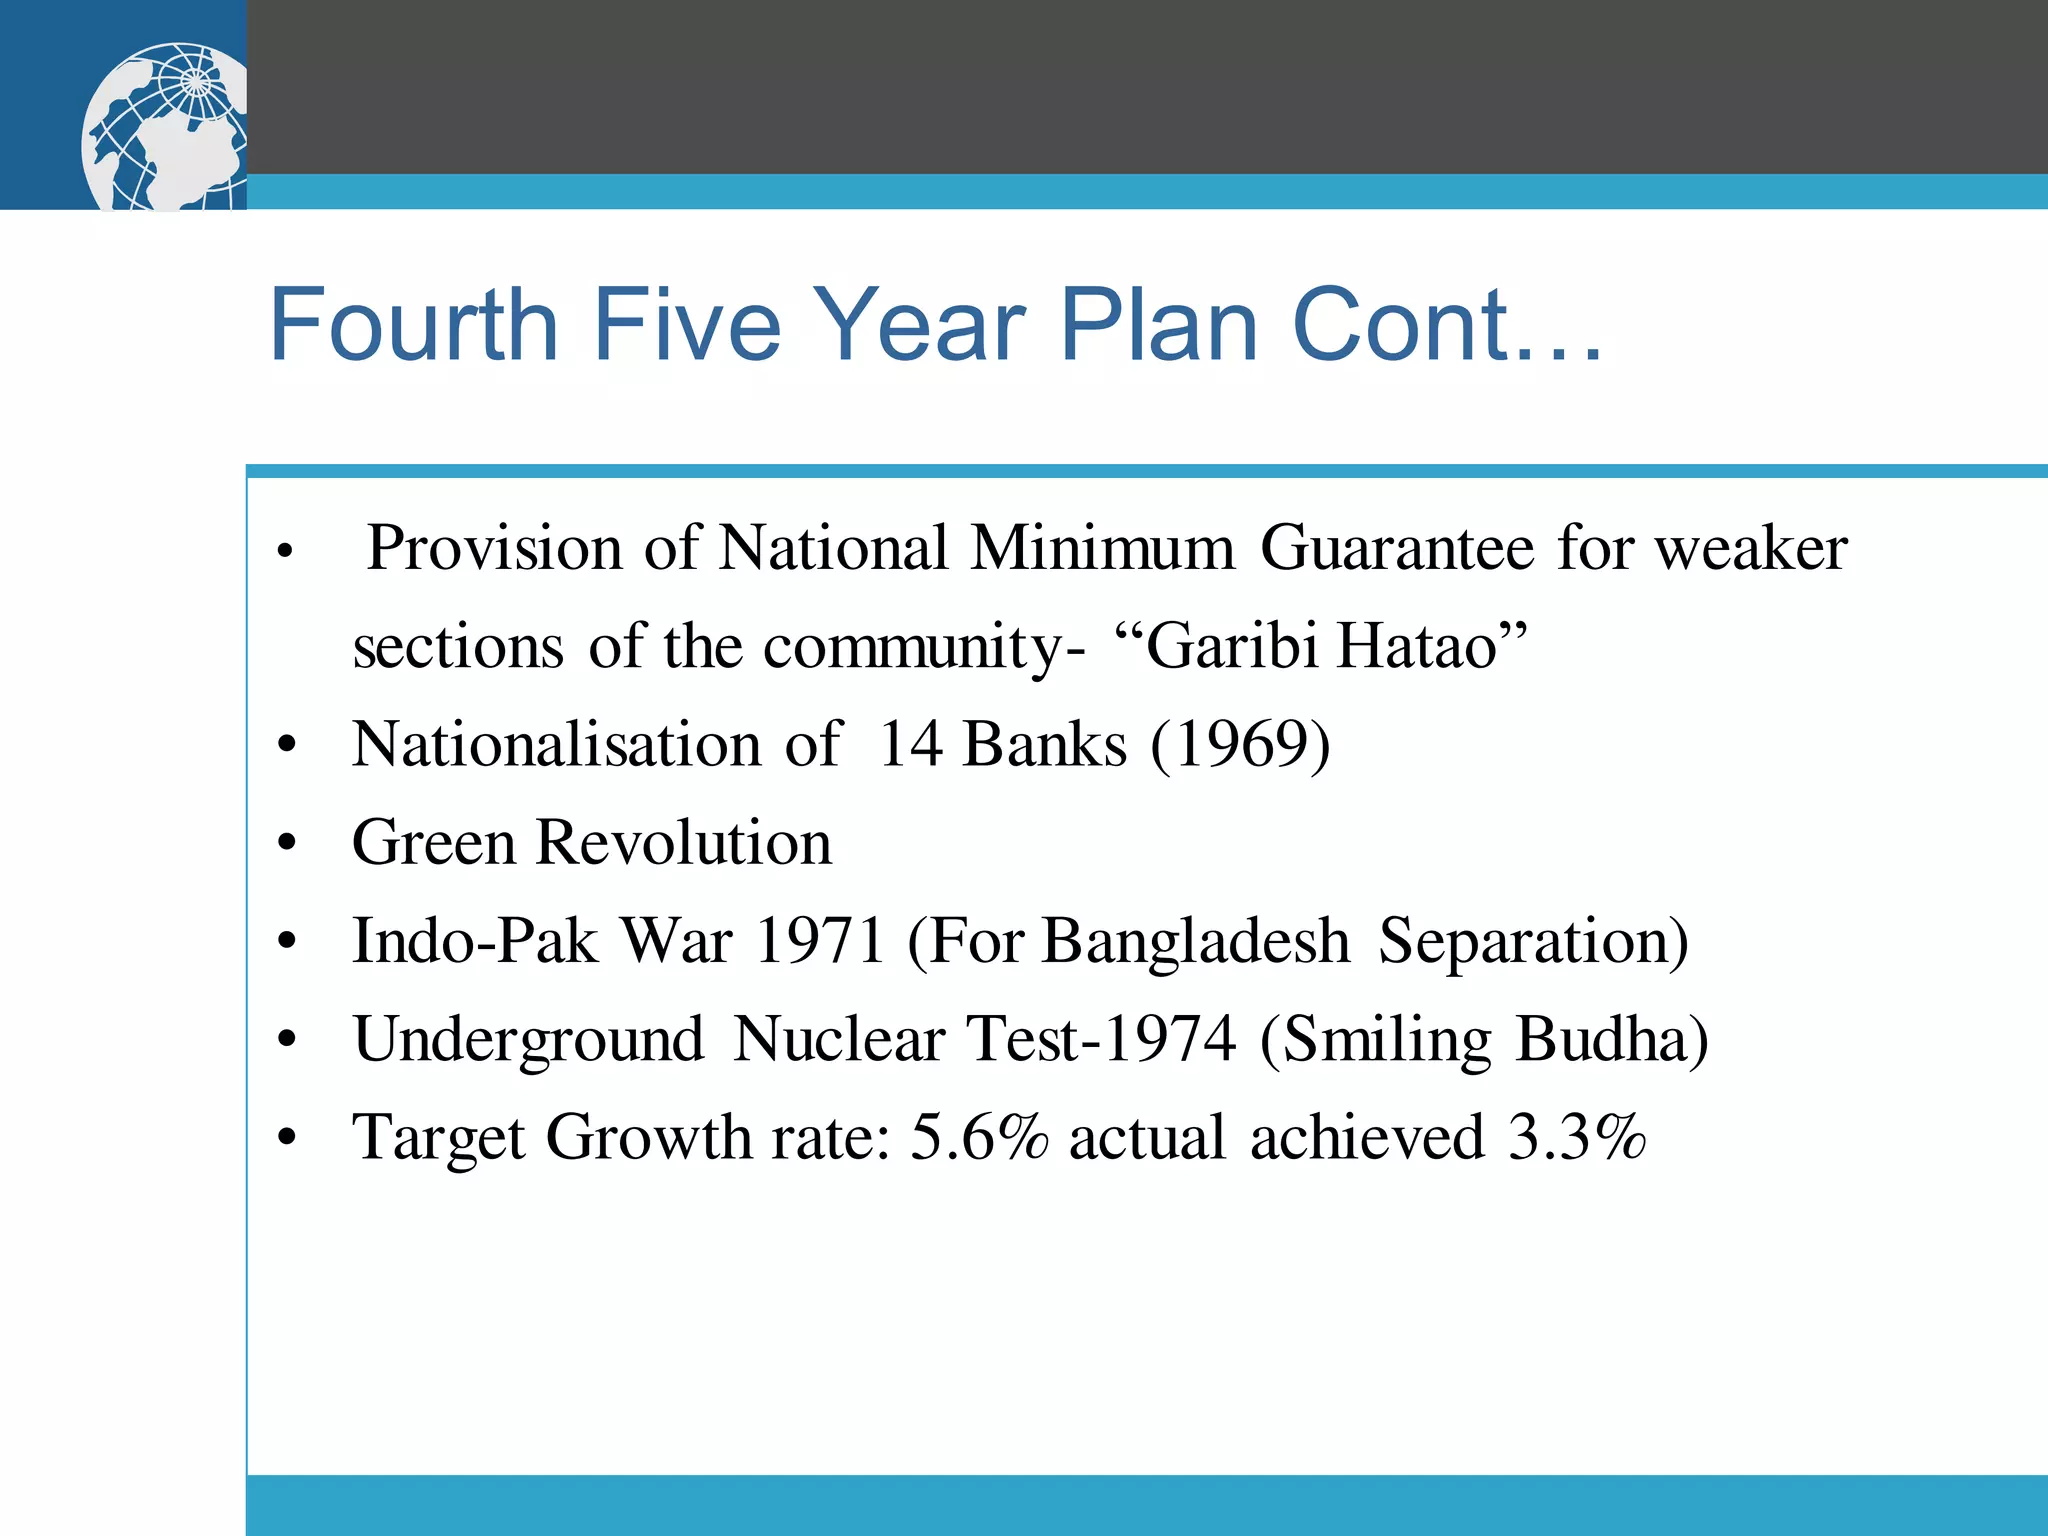
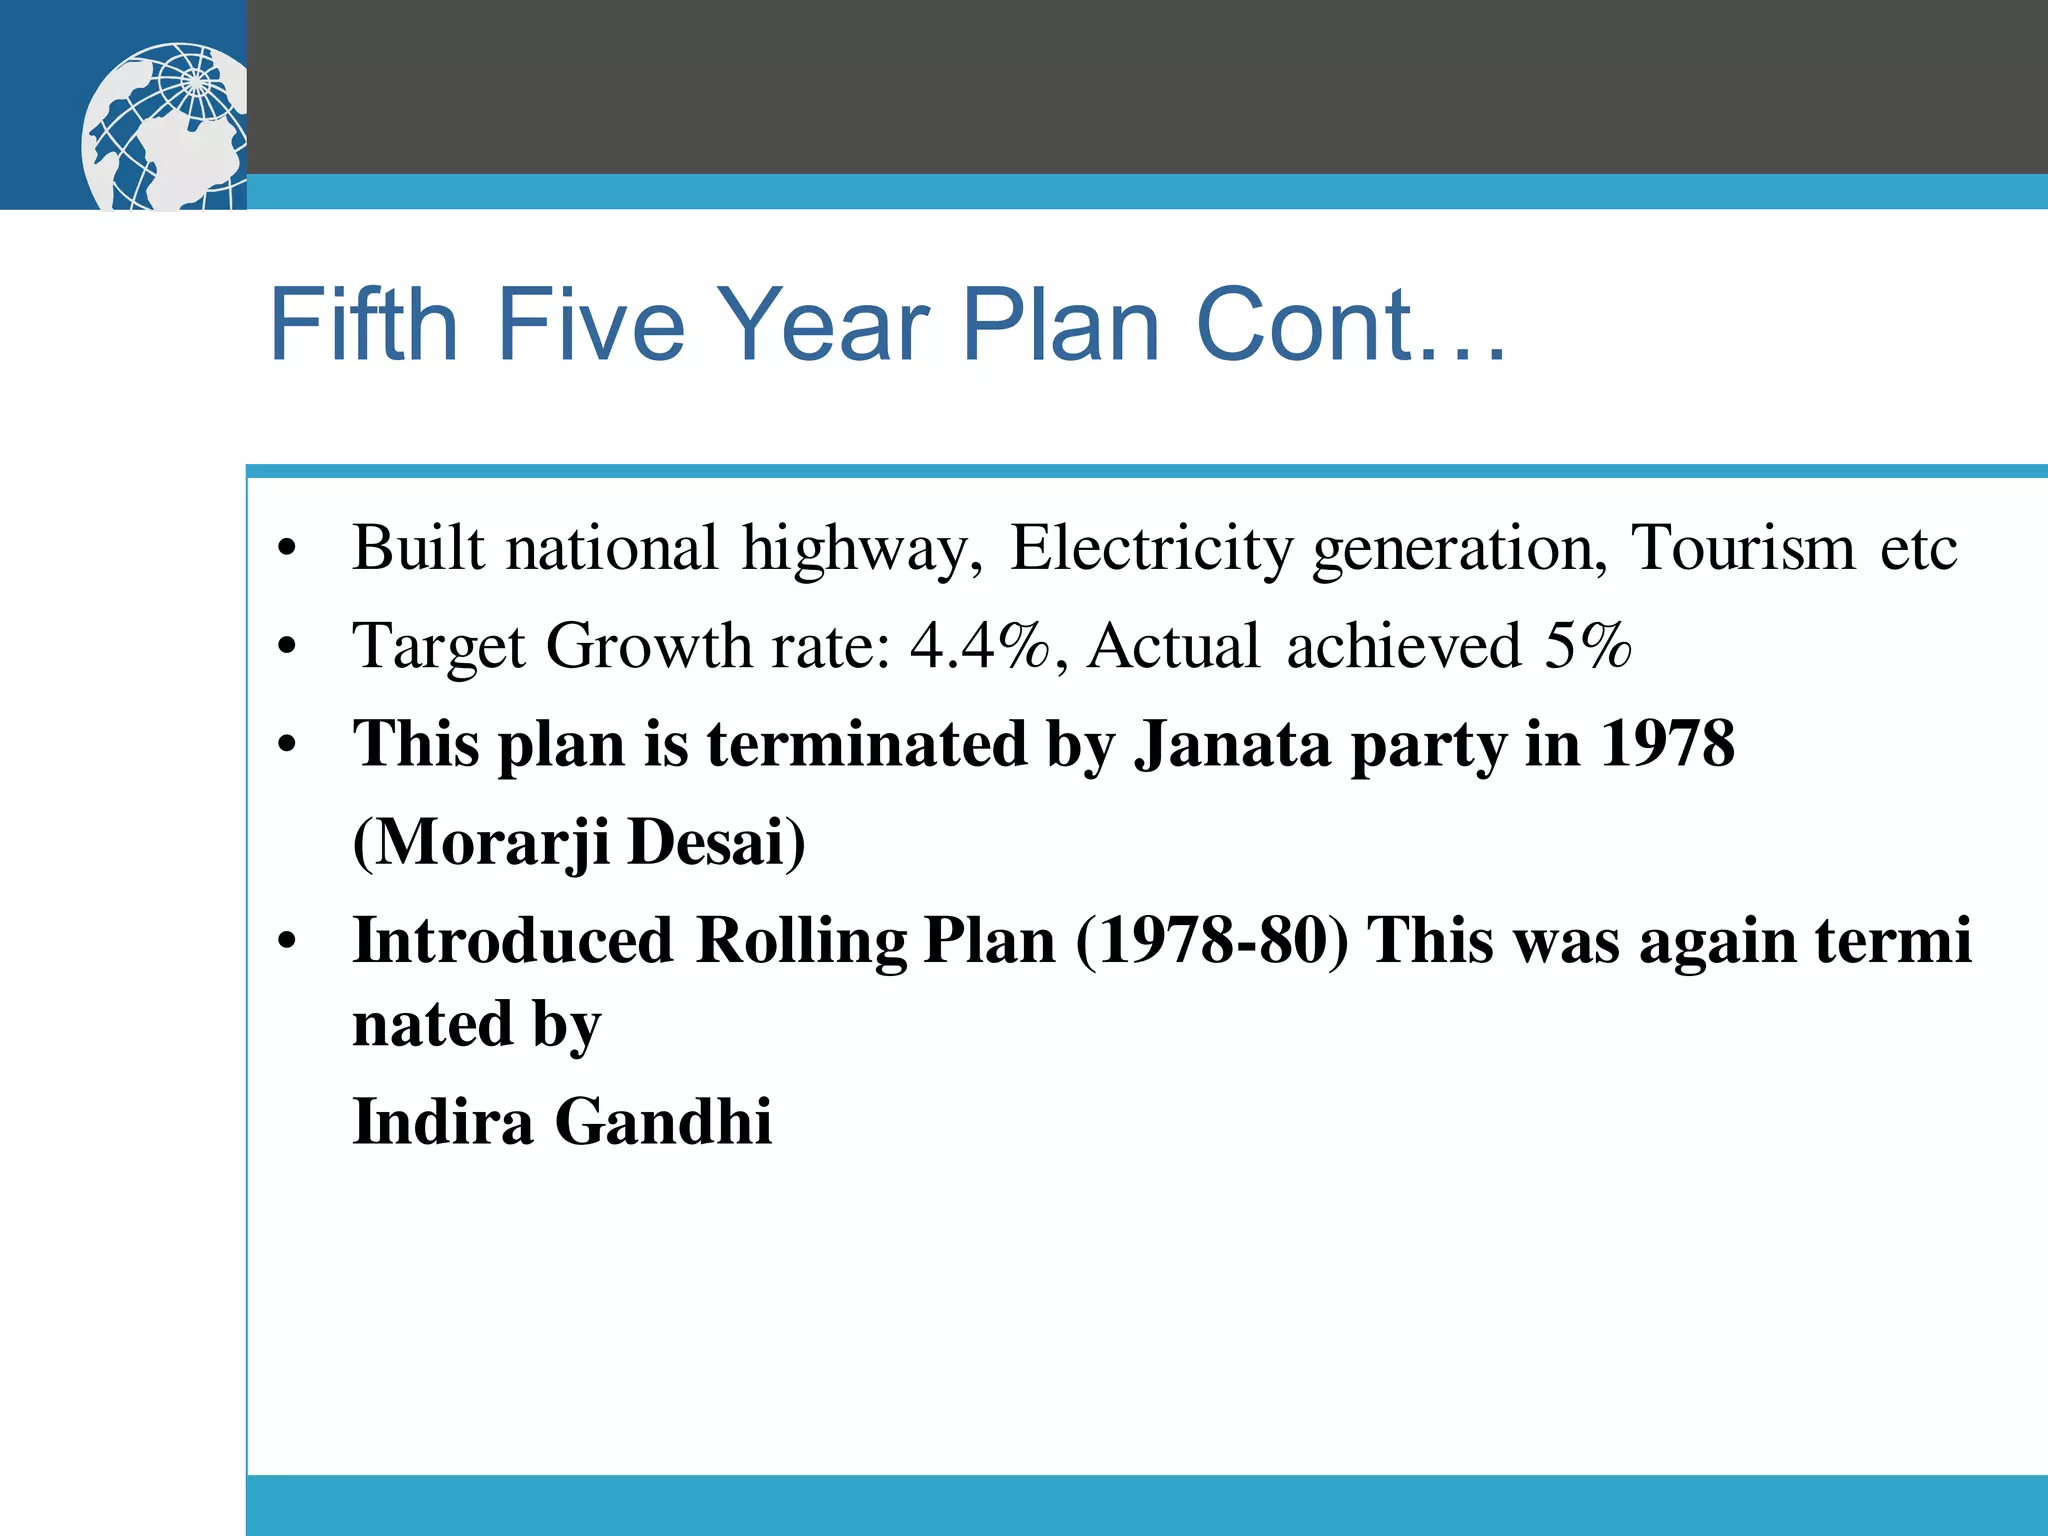
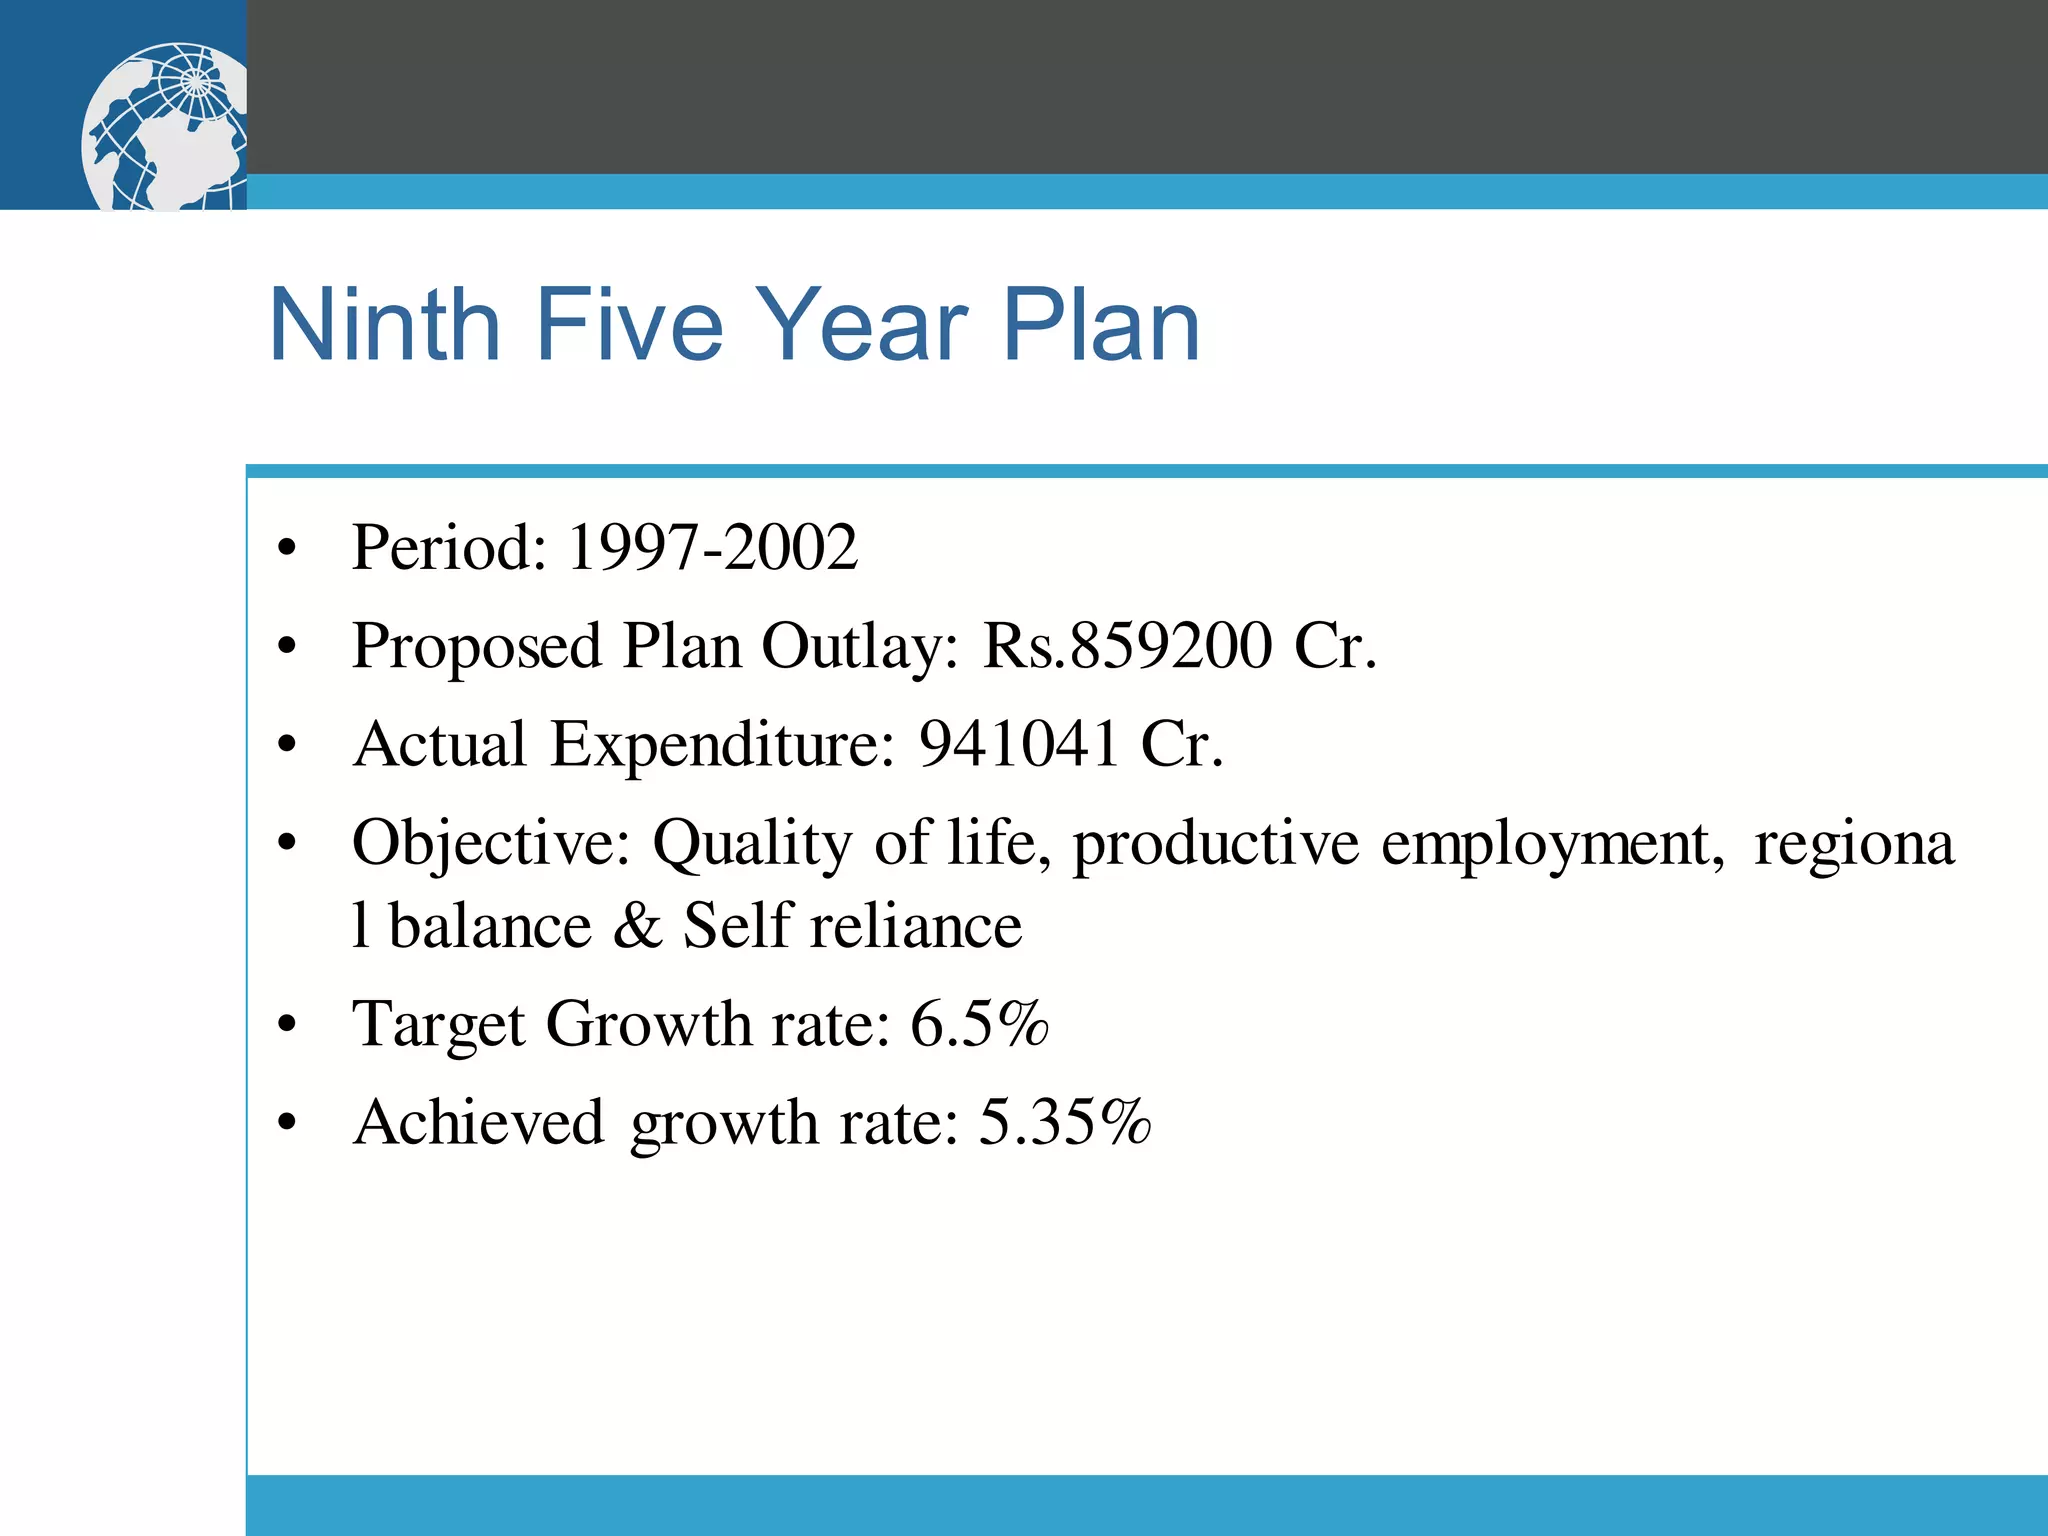
FIVE YEAR PLANS
FIVE YEAR PLANS
OVERVIEW
• Strategy of a planned approach to economic development.
• Planning commission is responsible for the formulation of
five year plans
• Objective: growth, employment, self-reliance and social
justice
• Continual watch on trends and adjustments
• Systematic observation of technical, economic and social
data
Planning Commission
Functions:
• To estimate the capital and human resources
• To prepare plans for making effective & balanced
utilization of HR
• To determine various stages of planning & to propose the
allocation of resources on the priority basis
• To evaluate the economic progress and to suggest
remedial measures
Assessment
First Five Year Plan (1951-56)
• Herald Domar Model
• Proposed Plan Outlay: Rs.2069 Crores.
• GDP Target 2.1%, Achieved 3.6%
• Situation:Influx of refugees, food shortage, disequilibriumin the
economy and mounting inflation
Objectives
• To reconstructthe damaged economy after World War and partition
• To check the inflationary trends
• To solve food crisis and to improve the availability of raw materials,
especially Jute and Cotton
• To rehabilitaterefugees
First Five Year Plan Cont...
• To increase the production capacity and to lessen the economic
disparities
Achievements:
• Achieved growth was more than the target
• Total allocation – Rs.2069 Crores
• Actual expenditure – Rs.1960 Crores
• NDP increased by 15% and per capita income by 8%
• Agricultural production
• Power & Transport
• Price stability
• Community Development Programme: 1952
Second Five Year Plan
• MahalnobisModel
• Period: 1956-61
• Proposed plan outlay: Rs.7900 Crores
• Target Growth Rate: 4.5% Achieved: 4.27%
• Situation:Low industrial output
Objectives:
• Rapid industrialisationand development of heavy and basic industries
• Plan could not be implemented fully because of acute shortage of foreign
exchange.
Second Five Year Plan Cont…
Achievements:
• Imported capital goods
• Generation of hydro electric power
• Five steel plants were established
• Increased coal production
• Tata Institute of Fundamental Research etc.
Third Five Year Plan
• Period: 1961-66
• Proposed Plan Outlay: Rs.11600 Crores
• Actual Expenditure: 8577 Crores
• Situation: Rate of growth of agriculture was the main
limiting factor in India’s economic development
• Objective: Top priority to agriculture with equal emphasis
on development of basic industries
• Objective changed to defence development because of
indo-china (1962) and indo-pak wars (1965).
Third Five Year Plan Cont…
• Severe draught (1965)
• War led to inflation
• Many cement & fertilizers plants were built
• Punjab: Increased wheat production
• Many Schools were started in rural areas
• Panchayat elections were started
• Target Growth rate: 5.6% Achieved 2.4%
Plan Holiday
• Original draft outline of the plan was abandoned because
of pressure on economy by two years of drought, War,
devaluation of the rupee and the inflationary pressure
• Three annual plans also called “Plan Holiday” were
implemented for the years 1966-69
Fourth Five Year Plan
• Period: 1969-74
• Proposed Plan Outlay: Rs.24880 Cr
• Actual Expenditure: 15779 Cr.
• Situation: large scale poverty and unemployment
• Objective: Growth with stability and progressive
achievement of self-reliance
• Aimed at 5.6% growth and actual achievement is 3.3%
Fourth Five Year Plan Cont…
• Provision of National Minimum Guarantee for weaker
sections of the community- “Garibi Hatao”
• Nationalisation of 14 Banks (1969)
• Green Revolution
• Indo-Pak War 1971 (For Bangladesh Separation)
• Underground Nuclear Test-1974 (Smiling Budha)
• Target Growth rate: 5.6% actual achieved 3.3%
Fifth Five Year Plan
• Period: 1974-79
• Proposed Plan Outlay: Rs.53410 Cr.
• Actual Expenditure: 39426 Cr.
• Situation: high inflation, hike in oil prices and failure of
Government take-over of the wholesale trade in wheat
• Objective: Employment generation, Poverty reduction and
Justice, self -reliance in agro products and defence
Fifth Five Year Plan Cont…
• Built national highway, Electricity generation, Tourism etc
• Target Growth rate: 4.4%, Actual achieved 5%
• This plan is terminated by Janata party in 1978
(Morarji Desai)
• Introduced Rolling Plan (1978-80) This was again termi
nated by
Indira Gandhi
Sixth Five year Plan (Morarji Desai)
• Two sixth plans. One by the Janata Party during the period
1978-83.
• Focus on enlargement of employment potential in
agriculture and allied activities and encouragement to
small industry
• The plan was rejected when Congress party came into
power. The objective changed to removal of poverty by
expanding economy.
Sixth Five Year Plan (Indira Gandhi)
• Period: 1980-85
• Proposed Plan Outlay: Rs.158710Crores
• Actual Expenditure:109292 Cr.
• High levels of poverty and inflation
• Impact: Indian economy made good progress and most of the targets
fixed were realised.
• Nationalisationof 6 Banks
• Aimed at a growth rate of 5.2 and achieved a growth rate of 5.7
• Modernisationof technology
• Decrease in poverty and unemployment
• Controlon Population
Seventh Five Year Plan
• Period: 1985-90
• Proposed Plan Outlay: Rs.348150 Cr.
• Actual Expenditure: 218730 Cr.
• Situation: Reasonable growth rate of economy
• Objectives: Accelerate food grains production, increase
employment opportunities and raised productivity
• Target Growth Rate: 5%
• Achieved a growth rate of 6.1%
Eighth Five Year Plan
• Political Uncertainty: (1990-92)
• Period: 1992-97
• Proposed Plan Outlay: Rs.871000 Cr.
• Actual Expenditure: 434100 Cr.
• Situation: balance of payment crisis, rising debt, budget
deficits, mounting inflation and recession in industry
• Objective: Economic reforms, accelerate growth and
improve quality of life in common man
• Growth in exports and Imports (Improvement in BOP)
• Achieved an impressive growth rate of 6.8%
Ninth Five Year Plan
• Period: 1997-2002
• Proposed Plan Outlay: Rs.859200 Cr.
• Actual Expenditure: 941041 Cr.
• Objective: Quality of life, productive employment, regiona
l balance & Self reliance
• Target Growth rate: 6.5%
• Achieved growth rate: 5.35%
Tenth Five Year Plan
• Period: 2002-2007
• Proposed Plan Outlay: Rs.1525639 Cr.
• Actual Expenditure: 1618460 Cr.
• Target Growth Rate: 8%
• Achieved growth rate : 7.2%
Objective:
• Reduction in poverty
• High quality employment
• Universal access to primary education
Tenth Five Year Plan Cont…
• Reduction in gender gaps in education
• Reduction in population, Reduction in infant mortality rate
- 45 by 2007 and 28 by 2012
• Increase in forests and Drinking Water
• Cleaning of polluted rivers
Eleventh Five Year Plan (2007-12)
“Towards Faster and More inclusive Growth”
EconomicScenario on the eve of 11th plan
 The percentage of population belowthe poverty line come down from
36% in 1993-94 to 28% in 2004-05
 The absolute no. of poor people has declined of only marginally from
320 million in 1993-94to 302 million in 2004-05
 According to national family health survey, 46% of he children in the 0-3
age group suffered from malnutrition in 2005-06 and it was reported 47%
in 1998.
 Literacy was 64.8% in 2001, the No. of illiteratesstill exceeds 304
million, making India the countrywith the largest No. of illiterates
Eleventh Five Year Plan Cont…
 Life expectancyduring 2001-06was 63.9 years for male and
66.9 years for females (72 years in China)
 Adverse male female ratio 1000-933
 Infant mortality rates are higher than those of countriesin East
Asia.
 Agricultural growth rate target for 10th plan was 4%, but
achieved 2.1%
 Unemployment rate increased from 7.3% in 1999-2000to 8.3%
in 2004-05, despitethe GDP of 7.6% during the 10th plan
 Permanent employment in organized sector has declined
Eleventh Five Year Plan Cont…
Objectives of the plan
 Rapid growth that reduces poverty and creates employment
opportunities
 Access to essential services in health and education especially for
poor
 Employment through education and skill development
 Extension of employment opportunities using National Rural
Employment Guarantee Programme (NREGP)
 Environmental sustainability
 Reduction of gender inequality
Eleventh Five Year Plan Cont…
Targets
Income & Poverty
 GDP-9%, Agriculture-4%, 58 Million Employment opportunities,
Reductionof unemployment among the educatedto less than 5%, 20%
increase in wages of unskilled workers, Reductionin poverty by 10%
Education
 Reductionin drop out 52.2 % in 2003-04to 20% by 2011-12
 Increasing literacy to 85%
 Reducing gender gap in literacy by 10%
Eleventh Five Year Plan Cont…
Targets
Health
 Infant mortality 28 by 2011-12
 Maternal mortality 1 per 1000
 Clean drinking water to all by 2009
 Reductionin malnutrition to 23% (46% 2005)
Women& Children
 Male Female ratio to be raised to 935 by 2011-12 and to 950 by
2016-17 for age group 0-6 years
 33% reservation for women and girls
 No work for children
Eleventh Five Year Plan Cont…
Targets
Infrastructure
 Electricityconnectionto all by 2009
 Road connection to all by 2009
 Telephoneand broadband to all by 2011
 Home for all by 2016-17
Environment
 Increase forests by 5%
 WTO standards in air qualityin all cities by 2011-12
 Treat all urban waste water by 2011-12 to clean river water
Eleventh Five Year Plan Cont…
Employment Perspective
“Generation of productive and gainful employment, with decent
working condition on a sufficient scale to absorb our growing labour
force from a critical element in the strategy for achieving exclusive
growth”
Weaknesses in the 11th Plan
 Rate of unemployment:6.1% in 1993-94, 7.3% in 1999-2000,8.3% in
2004-05
 Unemployment among agricultural labourand house hold: 9.5% in
1993-94,15.3 in 2004-05
 Frustration among educated youth due to unemployment
Eleventh Five Year Plan Cont…
Poverty Reduction
 Poverty in 2004-05 was 27.5% (28.3% Rural, 25.7% Urban)
 Total No. of poor 301.7 Million in 2004-05 (30 Cr, 1 Lakh, 70 Th)
 Total No. of poor 321.3 Million in 1969-74
(In 31 years 19.6 Million people were become out of this evil)
 In the 60 years of independence, ¼ population is still poor
 Tribal areas, forested regions and rain fed regions-
Watershed Development Programme
 Concentration of poor in certain states where land-man ratio is
lowest (Effective land Reforms)
 Large dependence on casual labour with low wages and less No. of days
(NAREGA for SC, ST)
 Providing Substitute to Agriculture
 Education and Skill Development (IT Polytechnic)
 Structure of production is to be employment generating
Eleventh Five Year Plan Cont…
Regional Disparitiesin Growth Rate (10th PlanGDP 7.6%)
Better Performance:(More than 7.6% Growth) Jharkhand, Gujarat,
Orissa, Chhattisgarh, Maharashtra,Goa, Uttaranchal, Nagaland &
Tripura
WorstPerformance:(Less than 6% Growth) Bihar, Rajasthan, MP
UP, Punjab, Meghalaya, Arunachal Pradesh and J&K
RemainingStates: (Between 6 - 7.6% Growth) Karnataka, Andhra
Pradesh, Kerala, West Bengal, Tamil Nadu and Assam
PATTERN OF FINANCING THE FIVE
YEAR PLANS IN INDIA
RESOURCESFOR THE PUBLIC SECTOR
• DOMESTIC BUDGETARY SOURCES
• FOREIGN LOAN & ASSISTANCE
• DEFICIT FINANCING (Printing of new currency)
• MARKET BORROWING
RESOURCESFOR THE PRIVATE SECTOR
• SAVINGS OF INDIVIDUALS & COMPANY
• PUBLIC SECTOR FINANCIAL INSTITUIONS
• FUND RAISING THROUGH SHARES AND DEBENTURES
• FOREIGN FUNDS-EQUITY CAPITAL, FOREIGN
COLLABORATION
ACHIEVEMENTS OF FIVE YEAR PLANS
• INCREASE IN NATIONAL AND PER CAPITA
INCOME
• PROGRESS IN AGRICULTURE
• PROGRESS IN INDUSTRY
• DEVELOPMENT OF ECONOMIC INFRASTRUCTURE
• DIVERSIFICATION OF EXPORTS AND IMPORT
SUBSTITUTION
• DEVELOPMENT OF SCIENCE AND TECHNOLOGY
• DEVELOPMENT OF HUGE EDUCATIONAL SYSTEM
FAILURES OF FIVE YEAR PLANS
• FAILURE TO ELIMINATE POVERTY
• FAILURE TO PROVIDE EMPLOYMENT TO ALL
ABLE PERSONS
• FAILURE TO REDUCE INEQUALITIES OF INCOME
AND WEALTH
• FAILURE TO CHECK GROWTH OF BLACK MONEY
• FAILURE TO REDUCE CONCENTRATION OF
ECONOMIC POWER
• FAILURE TO IMPLEMENT LAND REFORMS
CONCLUSION
THE PHILOSOPHICAL FOUNDATIONS OF THE
PLANNING POLICIES AND STRATEGIES WERE
SOUND BUT THERE WAS CRISIS OF
IMPLEMENTATION DUE TO THE EXISTENCE OF A
GAP BETWEEN THEORY AND PRACTICE OF
SOCIALISTIC PLANNING
THANK YOU

Five-Year-Plans project file class 12

  • 1.
  • 2.
    FIVE YEAR PLANS OVERVIEW •Strategy of a planned approach to economic development. • Planning commission is responsible for the formulation of five year plans • Objective: growth, employment, self-reliance and social justice • Continual watch on trends and adjustments • Systematic observation of technical, economic and social data
  • 3.
    Planning Commission Functions: • Toestimate the capital and human resources • To prepare plans for making effective & balanced utilization of HR • To determine various stages of planning & to propose the allocation of resources on the priority basis • To evaluate the economic progress and to suggest remedial measures
  • 4.
    Assessment First Five YearPlan (1951-56) • Herald Domar Model • Proposed Plan Outlay: Rs.2069 Crores. • GDP Target 2.1%, Achieved 3.6% • Situation:Influx of refugees, food shortage, disequilibriumin the economy and mounting inflation Objectives • To reconstructthe damaged economy after World War and partition • To check the inflationary trends • To solve food crisis and to improve the availability of raw materials, especially Jute and Cotton • To rehabilitaterefugees
  • 5.
    First Five YearPlan Cont... • To increase the production capacity and to lessen the economic disparities Achievements: • Achieved growth was more than the target • Total allocation – Rs.2069 Crores • Actual expenditure – Rs.1960 Crores • NDP increased by 15% and per capita income by 8% • Agricultural production • Power & Transport • Price stability • Community Development Programme: 1952
  • 6.
    Second Five YearPlan • MahalnobisModel • Period: 1956-61 • Proposed plan outlay: Rs.7900 Crores • Target Growth Rate: 4.5% Achieved: 4.27% • Situation:Low industrial output Objectives: • Rapid industrialisationand development of heavy and basic industries • Plan could not be implemented fully because of acute shortage of foreign exchange.
  • 7.
    Second Five YearPlan Cont… Achievements: • Imported capital goods • Generation of hydro electric power • Five steel plants were established • Increased coal production • Tata Institute of Fundamental Research etc.
  • 8.
    Third Five YearPlan • Period: 1961-66 • Proposed Plan Outlay: Rs.11600 Crores • Actual Expenditure: 8577 Crores • Situation: Rate of growth of agriculture was the main limiting factor in India’s economic development • Objective: Top priority to agriculture with equal emphasis on development of basic industries • Objective changed to defence development because of indo-china (1962) and indo-pak wars (1965).
  • 9.
    Third Five YearPlan Cont… • Severe draught (1965) • War led to inflation • Many cement & fertilizers plants were built • Punjab: Increased wheat production • Many Schools were started in rural areas • Panchayat elections were started • Target Growth rate: 5.6% Achieved 2.4%
  • 10.
    Plan Holiday • Originaldraft outline of the plan was abandoned because of pressure on economy by two years of drought, War, devaluation of the rupee and the inflationary pressure • Three annual plans also called “Plan Holiday” were implemented for the years 1966-69
  • 11.
    Fourth Five YearPlan • Period: 1969-74 • Proposed Plan Outlay: Rs.24880 Cr • Actual Expenditure: 15779 Cr. • Situation: large scale poverty and unemployment • Objective: Growth with stability and progressive achievement of self-reliance • Aimed at 5.6% growth and actual achievement is 3.3%
  • 12.
    Fourth Five YearPlan Cont… • Provision of National Minimum Guarantee for weaker sections of the community- “Garibi Hatao” • Nationalisation of 14 Banks (1969) • Green Revolution • Indo-Pak War 1971 (For Bangladesh Separation) • Underground Nuclear Test-1974 (Smiling Budha) • Target Growth rate: 5.6% actual achieved 3.3%
  • 13.
    Fifth Five YearPlan • Period: 1974-79 • Proposed Plan Outlay: Rs.53410 Cr. • Actual Expenditure: 39426 Cr. • Situation: high inflation, hike in oil prices and failure of Government take-over of the wholesale trade in wheat • Objective: Employment generation, Poverty reduction and Justice, self -reliance in agro products and defence
  • 14.
    Fifth Five YearPlan Cont… • Built national highway, Electricity generation, Tourism etc • Target Growth rate: 4.4%, Actual achieved 5% • This plan is terminated by Janata party in 1978 (Morarji Desai) • Introduced Rolling Plan (1978-80) This was again termi nated by Indira Gandhi
  • 15.
    Sixth Five yearPlan (Morarji Desai) • Two sixth plans. One by the Janata Party during the period 1978-83. • Focus on enlargement of employment potential in agriculture and allied activities and encouragement to small industry • The plan was rejected when Congress party came into power. The objective changed to removal of poverty by expanding economy.
  • 16.
    Sixth Five YearPlan (Indira Gandhi) • Period: 1980-85 • Proposed Plan Outlay: Rs.158710Crores • Actual Expenditure:109292 Cr. • High levels of poverty and inflation • Impact: Indian economy made good progress and most of the targets fixed were realised. • Nationalisationof 6 Banks • Aimed at a growth rate of 5.2 and achieved a growth rate of 5.7 • Modernisationof technology • Decrease in poverty and unemployment • Controlon Population
  • 17.
    Seventh Five YearPlan • Period: 1985-90 • Proposed Plan Outlay: Rs.348150 Cr. • Actual Expenditure: 218730 Cr. • Situation: Reasonable growth rate of economy • Objectives: Accelerate food grains production, increase employment opportunities and raised productivity • Target Growth Rate: 5% • Achieved a growth rate of 6.1%
  • 18.
    Eighth Five YearPlan • Political Uncertainty: (1990-92) • Period: 1992-97 • Proposed Plan Outlay: Rs.871000 Cr. • Actual Expenditure: 434100 Cr. • Situation: balance of payment crisis, rising debt, budget deficits, mounting inflation and recession in industry • Objective: Economic reforms, accelerate growth and improve quality of life in common man • Growth in exports and Imports (Improvement in BOP) • Achieved an impressive growth rate of 6.8%
  • 19.
    Ninth Five YearPlan • Period: 1997-2002 • Proposed Plan Outlay: Rs.859200 Cr. • Actual Expenditure: 941041 Cr. • Objective: Quality of life, productive employment, regiona l balance & Self reliance • Target Growth rate: 6.5% • Achieved growth rate: 5.35%
  • 20.
    Tenth Five YearPlan • Period: 2002-2007 • Proposed Plan Outlay: Rs.1525639 Cr. • Actual Expenditure: 1618460 Cr. • Target Growth Rate: 8% • Achieved growth rate : 7.2% Objective: • Reduction in poverty • High quality employment • Universal access to primary education
  • 21.
    Tenth Five YearPlan Cont… • Reduction in gender gaps in education • Reduction in population, Reduction in infant mortality rate - 45 by 2007 and 28 by 2012 • Increase in forests and Drinking Water • Cleaning of polluted rivers
  • 22.
    Eleventh Five YearPlan (2007-12) “Towards Faster and More inclusive Growth” EconomicScenario on the eve of 11th plan  The percentage of population belowthe poverty line come down from 36% in 1993-94 to 28% in 2004-05  The absolute no. of poor people has declined of only marginally from 320 million in 1993-94to 302 million in 2004-05  According to national family health survey, 46% of he children in the 0-3 age group suffered from malnutrition in 2005-06 and it was reported 47% in 1998.  Literacy was 64.8% in 2001, the No. of illiteratesstill exceeds 304 million, making India the countrywith the largest No. of illiterates
  • 23.
    Eleventh Five YearPlan Cont…  Life expectancyduring 2001-06was 63.9 years for male and 66.9 years for females (72 years in China)  Adverse male female ratio 1000-933  Infant mortality rates are higher than those of countriesin East Asia.  Agricultural growth rate target for 10th plan was 4%, but achieved 2.1%  Unemployment rate increased from 7.3% in 1999-2000to 8.3% in 2004-05, despitethe GDP of 7.6% during the 10th plan  Permanent employment in organized sector has declined
  • 24.
    Eleventh Five YearPlan Cont… Objectives of the plan  Rapid growth that reduces poverty and creates employment opportunities  Access to essential services in health and education especially for poor  Employment through education and skill development  Extension of employment opportunities using National Rural Employment Guarantee Programme (NREGP)  Environmental sustainability  Reduction of gender inequality
  • 25.
    Eleventh Five YearPlan Cont… Targets Income & Poverty  GDP-9%, Agriculture-4%, 58 Million Employment opportunities, Reductionof unemployment among the educatedto less than 5%, 20% increase in wages of unskilled workers, Reductionin poverty by 10% Education  Reductionin drop out 52.2 % in 2003-04to 20% by 2011-12  Increasing literacy to 85%  Reducing gender gap in literacy by 10%
  • 26.
    Eleventh Five YearPlan Cont… Targets Health  Infant mortality 28 by 2011-12  Maternal mortality 1 per 1000  Clean drinking water to all by 2009  Reductionin malnutrition to 23% (46% 2005) Women& Children  Male Female ratio to be raised to 935 by 2011-12 and to 950 by 2016-17 for age group 0-6 years  33% reservation for women and girls  No work for children
  • 27.
    Eleventh Five YearPlan Cont… Targets Infrastructure  Electricityconnectionto all by 2009  Road connection to all by 2009  Telephoneand broadband to all by 2011  Home for all by 2016-17 Environment  Increase forests by 5%  WTO standards in air qualityin all cities by 2011-12  Treat all urban waste water by 2011-12 to clean river water
  • 28.
    Eleventh Five YearPlan Cont… Employment Perspective “Generation of productive and gainful employment, with decent working condition on a sufficient scale to absorb our growing labour force from a critical element in the strategy for achieving exclusive growth” Weaknesses in the 11th Plan  Rate of unemployment:6.1% in 1993-94, 7.3% in 1999-2000,8.3% in 2004-05  Unemployment among agricultural labourand house hold: 9.5% in 1993-94,15.3 in 2004-05  Frustration among educated youth due to unemployment
  • 29.
    Eleventh Five YearPlan Cont… Poverty Reduction  Poverty in 2004-05 was 27.5% (28.3% Rural, 25.7% Urban)  Total No. of poor 301.7 Million in 2004-05 (30 Cr, 1 Lakh, 70 Th)  Total No. of poor 321.3 Million in 1969-74 (In 31 years 19.6 Million people were become out of this evil)  In the 60 years of independence, ¼ population is still poor  Tribal areas, forested regions and rain fed regions- Watershed Development Programme  Concentration of poor in certain states where land-man ratio is lowest (Effective land Reforms)  Large dependence on casual labour with low wages and less No. of days (NAREGA for SC, ST)  Providing Substitute to Agriculture  Education and Skill Development (IT Polytechnic)  Structure of production is to be employment generating
  • 30.
    Eleventh Five YearPlan Cont… Regional Disparitiesin Growth Rate (10th PlanGDP 7.6%) Better Performance:(More than 7.6% Growth) Jharkhand, Gujarat, Orissa, Chhattisgarh, Maharashtra,Goa, Uttaranchal, Nagaland & Tripura WorstPerformance:(Less than 6% Growth) Bihar, Rajasthan, MP UP, Punjab, Meghalaya, Arunachal Pradesh and J&K RemainingStates: (Between 6 - 7.6% Growth) Karnataka, Andhra Pradesh, Kerala, West Bengal, Tamil Nadu and Assam
  • 31.
    PATTERN OF FINANCINGTHE FIVE YEAR PLANS IN INDIA RESOURCESFOR THE PUBLIC SECTOR • DOMESTIC BUDGETARY SOURCES • FOREIGN LOAN & ASSISTANCE • DEFICIT FINANCING (Printing of new currency) • MARKET BORROWING RESOURCESFOR THE PRIVATE SECTOR • SAVINGS OF INDIVIDUALS & COMPANY • PUBLIC SECTOR FINANCIAL INSTITUIONS • FUND RAISING THROUGH SHARES AND DEBENTURES • FOREIGN FUNDS-EQUITY CAPITAL, FOREIGN COLLABORATION
  • 32.
    ACHIEVEMENTS OF FIVEYEAR PLANS • INCREASE IN NATIONAL AND PER CAPITA INCOME • PROGRESS IN AGRICULTURE • PROGRESS IN INDUSTRY • DEVELOPMENT OF ECONOMIC INFRASTRUCTURE • DIVERSIFICATION OF EXPORTS AND IMPORT SUBSTITUTION • DEVELOPMENT OF SCIENCE AND TECHNOLOGY • DEVELOPMENT OF HUGE EDUCATIONAL SYSTEM
  • 33.
    FAILURES OF FIVEYEAR PLANS • FAILURE TO ELIMINATE POVERTY • FAILURE TO PROVIDE EMPLOYMENT TO ALL ABLE PERSONS • FAILURE TO REDUCE INEQUALITIES OF INCOME AND WEALTH • FAILURE TO CHECK GROWTH OF BLACK MONEY • FAILURE TO REDUCE CONCENTRATION OF ECONOMIC POWER • FAILURE TO IMPLEMENT LAND REFORMS
  • 34.
    CONCLUSION THE PHILOSOPHICAL FOUNDATIONSOF THE PLANNING POLICIES AND STRATEGIES WERE SOUND BUT THERE WAS CRISIS OF IMPLEMENTATION DUE TO THE EXISTENCE OF A GAP BETWEEN THEORY AND PRACTICE OF SOCIALISTIC PLANNING
  • 35.