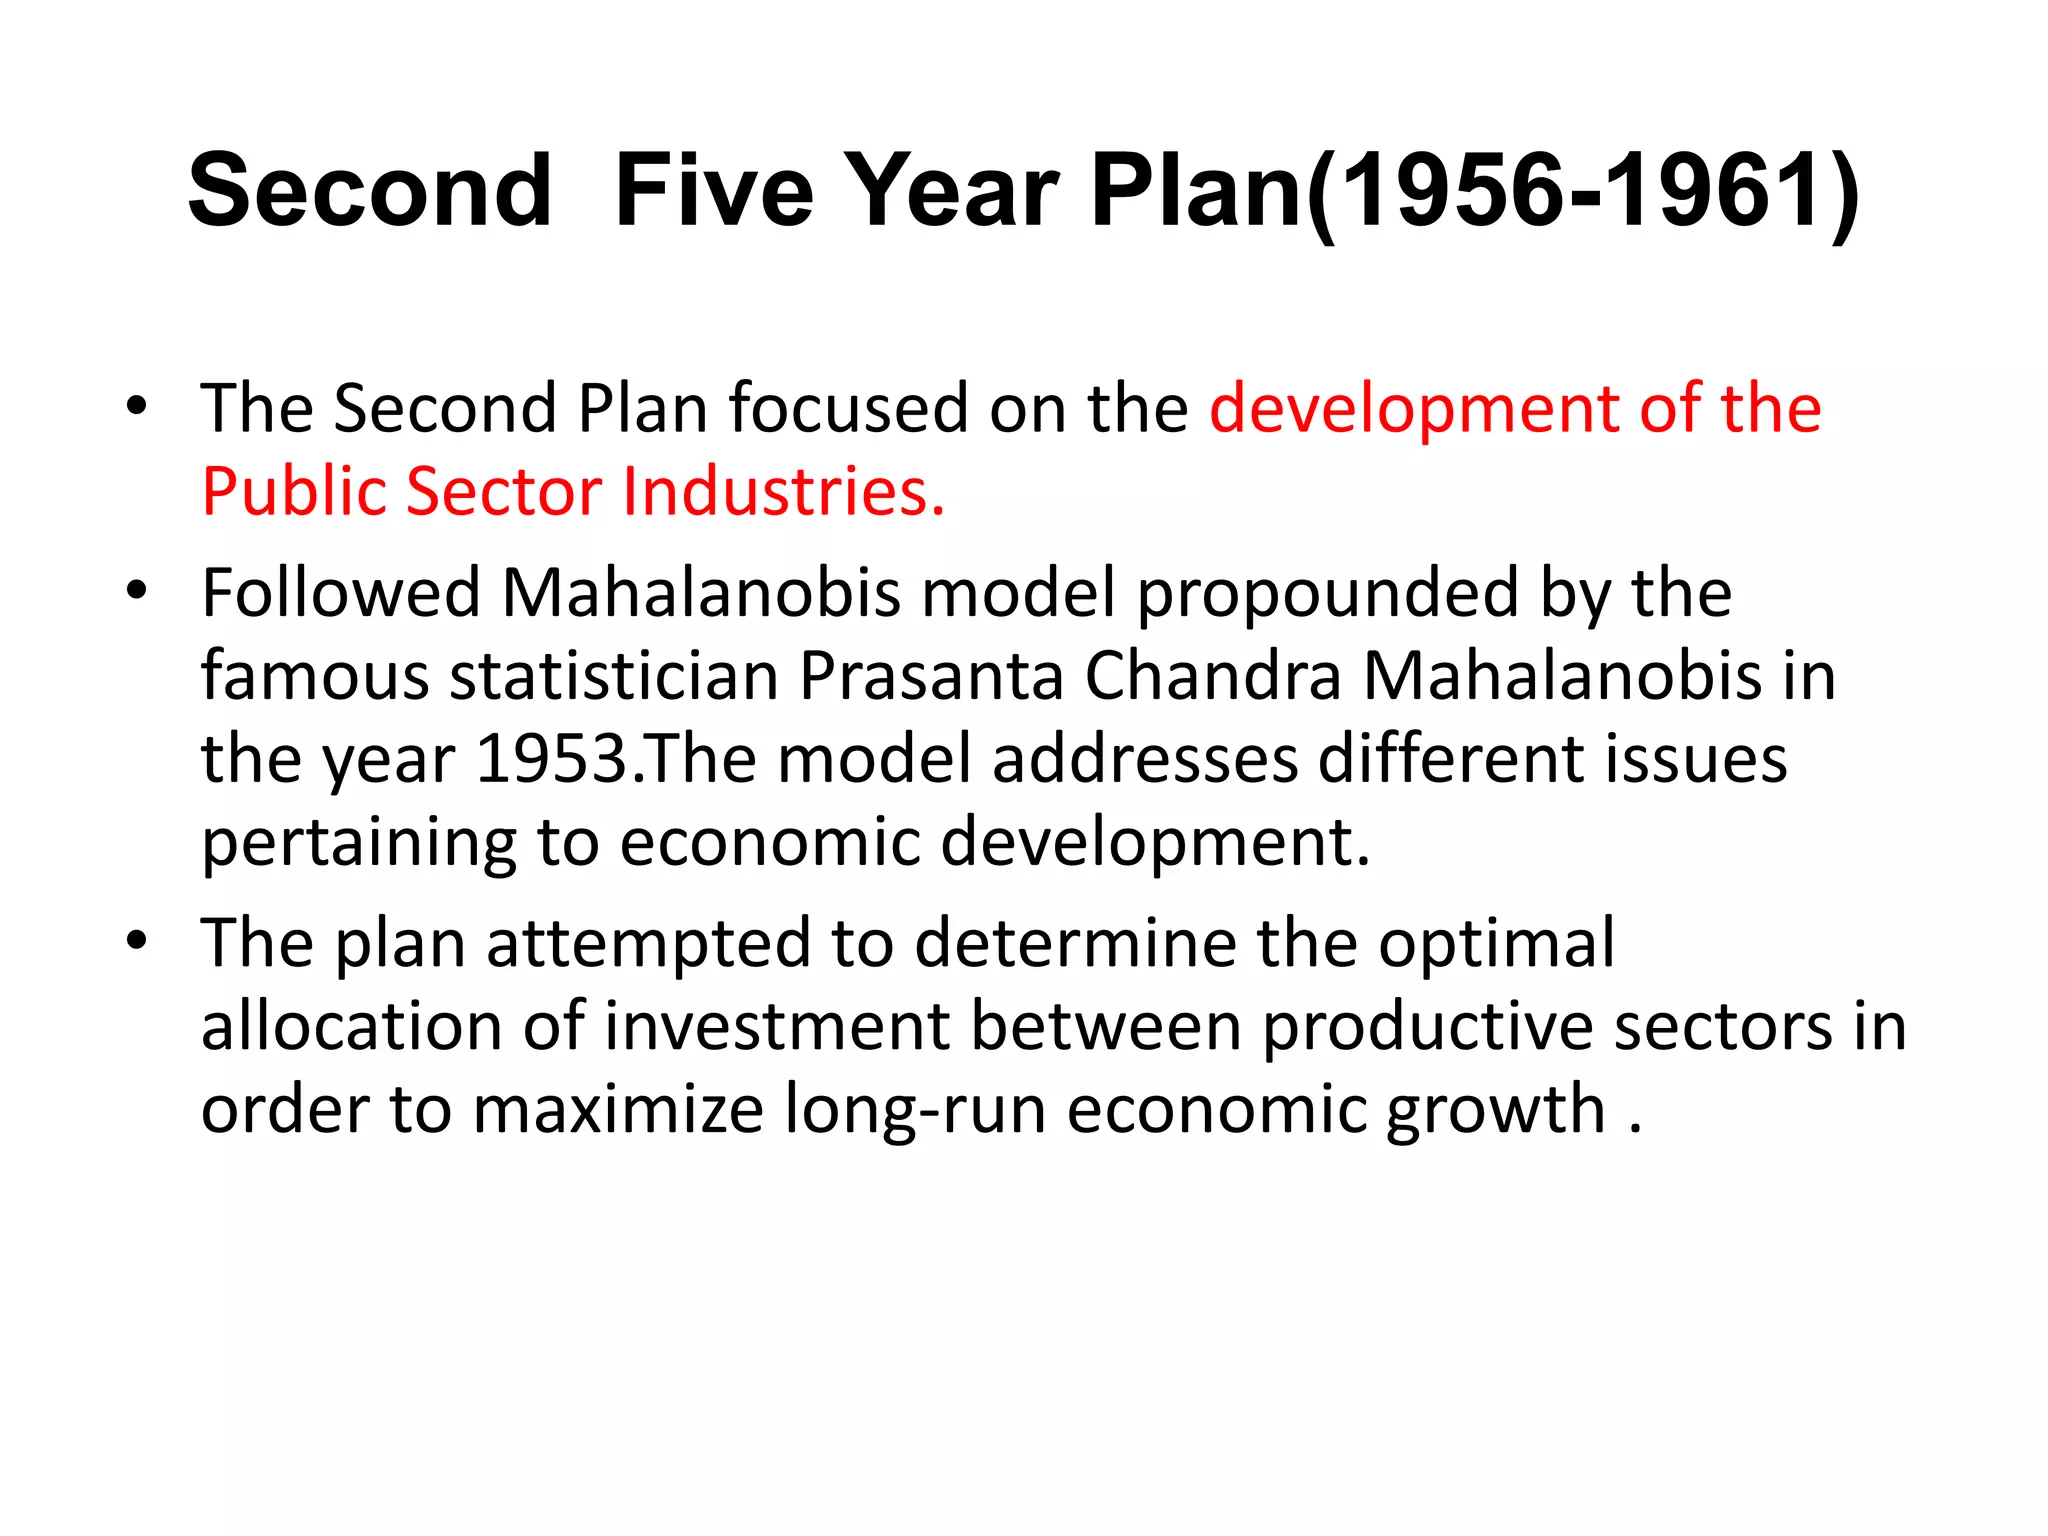
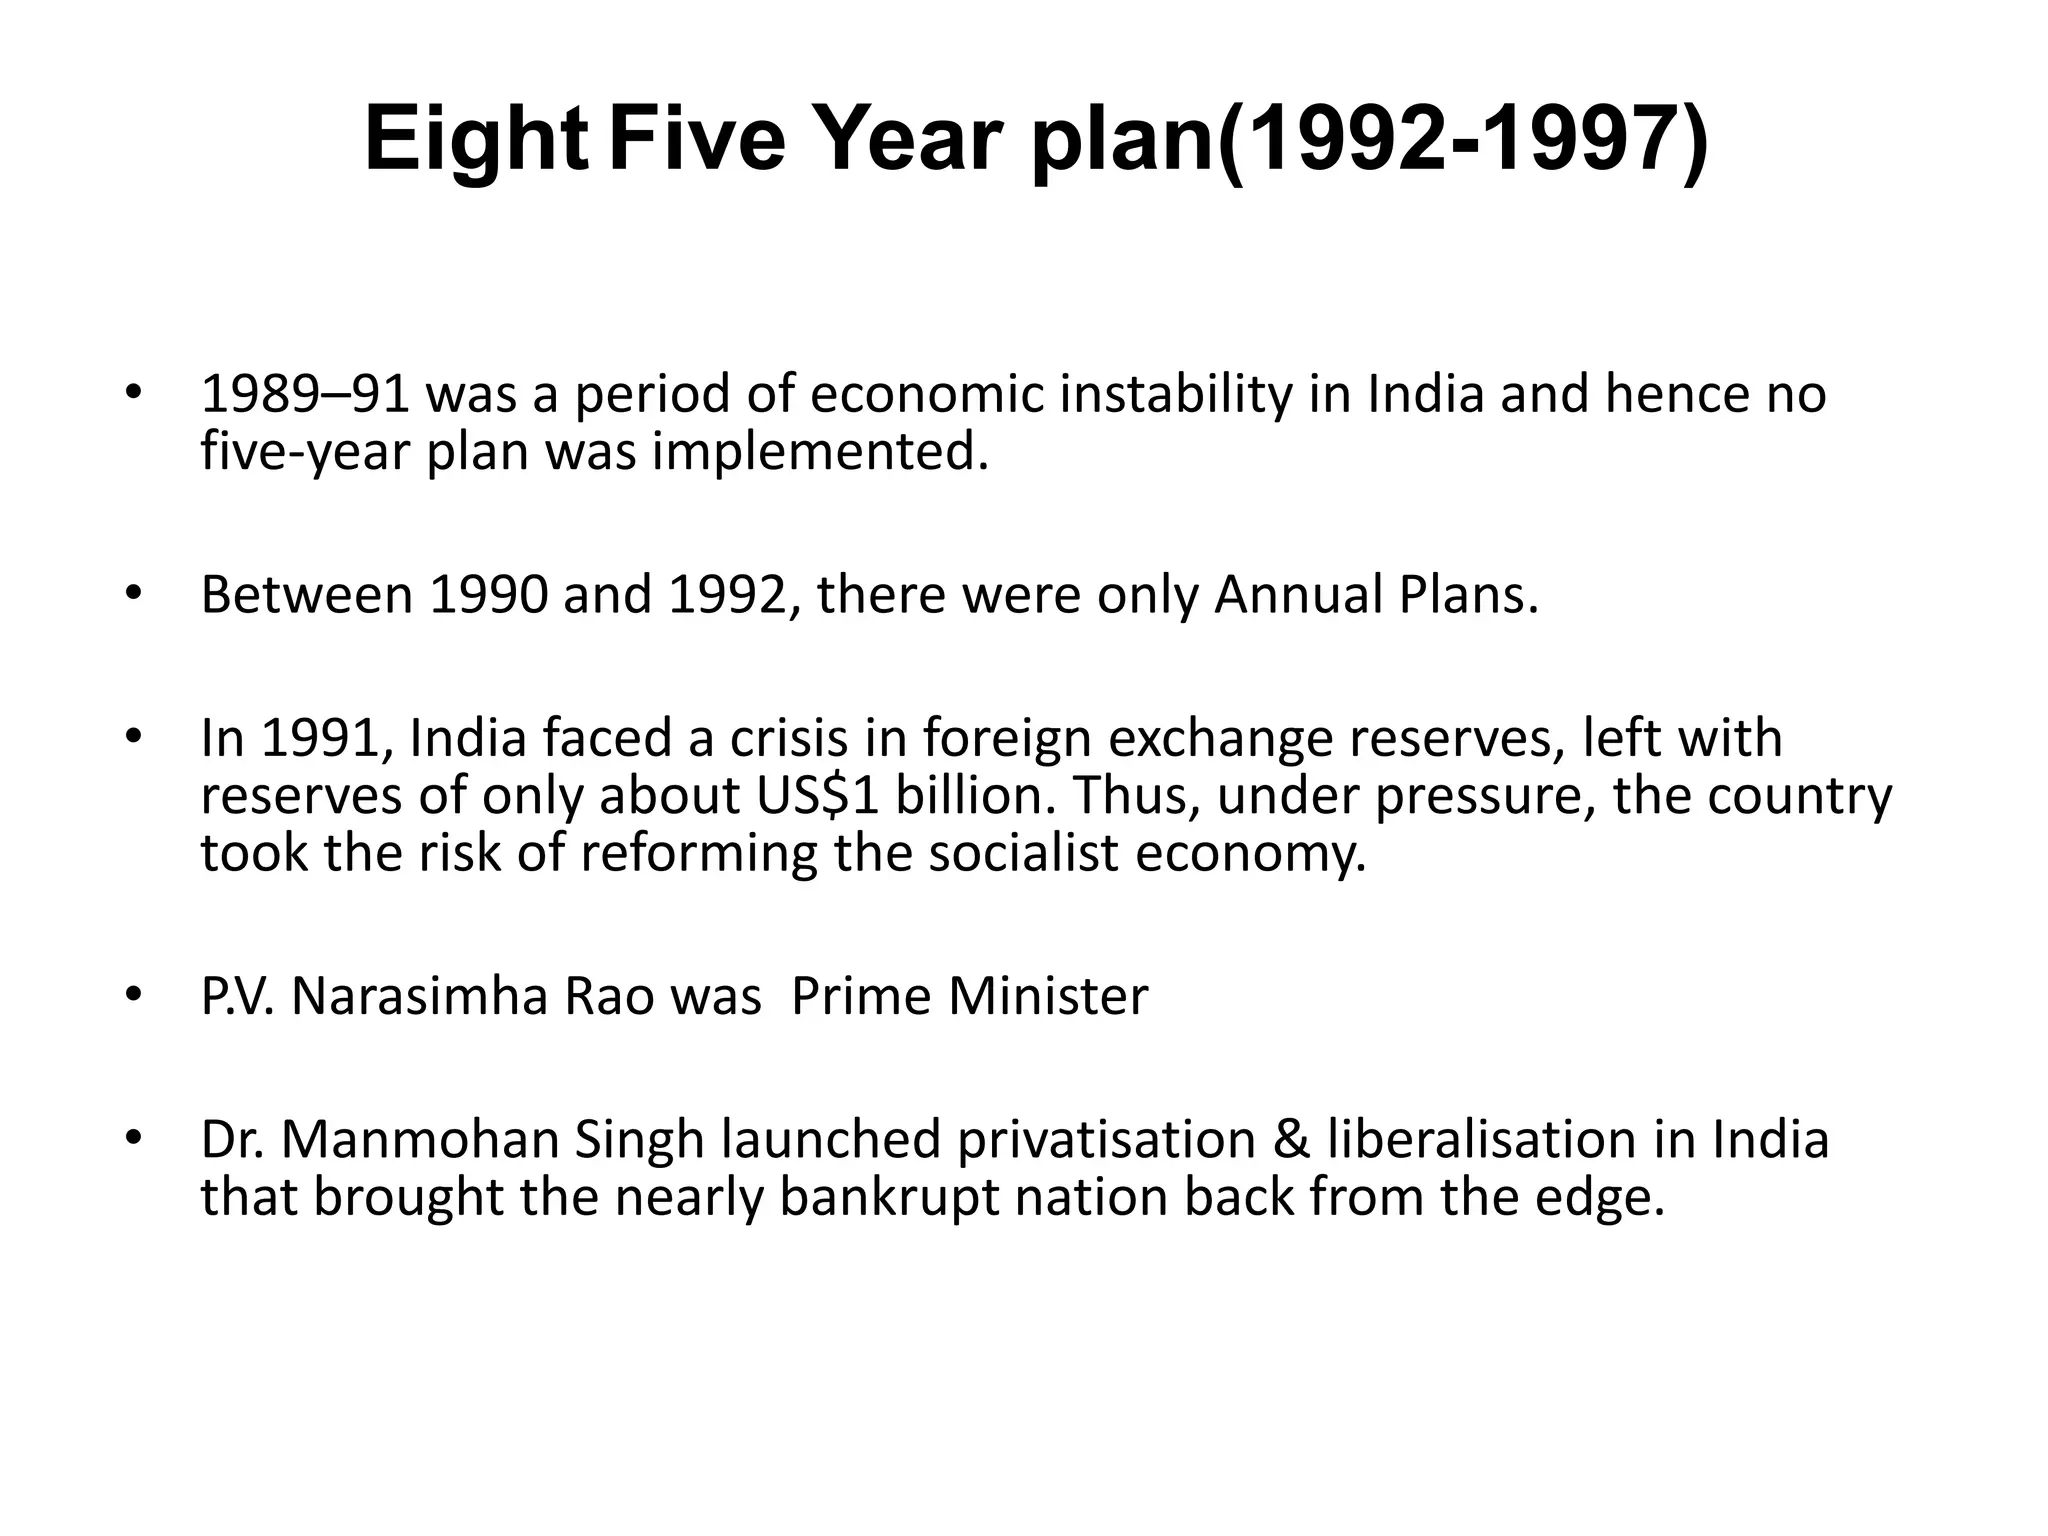
Planning & Economic
Development
What is an Economic Plan?
• A set of development programmes consistent among
themselves (implementation of one does not conflict
with pursuance of any other)
• It should have some general goals as well as specific
objectives which are to be achieved within specific
period of time.
• In India, plans are of five year duration and are called
FIVE YEAR PLANS.
Features of Economic Planning
• Specification of objectives
• Time target
• Schemes of action to be drawn up sufficiently in
advance
• Internal balance or consistency of the plan
• Optimisation – attaining objectives in the most
efficient manner
• Process of coordination and centralised decision-
making
Planning in India
• Since 1947, the Indian economy has been premised on the concept
of Planning
• Planning in India has been carried through the Five-Year Plans,
developed, executed, and monitored by the Planning Commission
since 1950.
• The draft of the first five-year plan was published in July 1951 and it
was approved in December 1951.
• With the Prime Minister as the ex-officio Chairman, the commission
has a nominated Deputy Chairman, who holds the rank of a Cabinet
Minister.
• Montek Singh Ahluwalia is the last Deputy Chairman of the
Commission (resigned on 26 May 2014).
• The Eleventh Plan completed its term in March 2012 and the
Twelfth Plan is currently underway.
Five year plan Period Target growth rate of
GDP (%)
Achievement
(%)
First plan 1951-56 2.1 3.6
Second plan 1956-61 4.5 4.21
Third plan 1961-66 5.6 2.72
Fourth plan 1969-74 5.7 2.05
Fifth plan 1974-79 4.4 4.83
Five Year Plans
Sixth plan 1980-85 5.2 5.54
Seventh plan 1985-90 5.0 6.02
Eight plan 1992-97 5.6 6.68
Ninth Plan 1997-02 6.5 5.55
Tenth plan 2002-07 8.0 7.8
Eleventh plan 2007-12 9.0 7.9
Twelfth plan 2012-17 9.0 -
• Prime Minister Pandit Jawaharlal Nehru presented the First
Five-Year Plan in 1951
• Plan mainly focused in development of the primary sector.
• The total planned budget of Rs.2069 crore was allocated to
seven broad areas : Irrigation, Energy, Agriculture and
community development, Transport and Communication,
Industry, Social Services, Land Rehabilitation.
• The target growth rate was 2.1% annual .
First Five Year Plan (1951-1956)
• The achieved growth rate was 3.6% .
• National income increased more than the per capita income
due to rapid population growth.
• Many irrigation projects were initiated during this period,
including the Bhakra Dam and Hirakud Dam.
• At the end of the plan period in 1956, five IITs were started as
major technical institutions.
• The UGC was set up to take care of funding and take measures
to strengthen higher education in the country.
First Five Year Plan : A Review
Second Five Year Plan(1956-1961)
• The Second Plan focused on the development of the
Public Sector Industries.
• Followed Mahalanobis model propounded by the
famous statistician Prasanta Chandra Mahalanobis in
the year 1953.The model addresses different issues
pertaining to economic development.
• The plan attempted to determine the optimal
allocation of investment between productive sectors in
order to maximize long-run economic growth .
Second Five Year Plan: A Review
• Hydroelectric projects and steel plants at Bhilai,
Durgapur and Rourkela were established.
• Coal production was increased.
• More Railway lines were added in the north east.
• The Tata Institute of Fundamental Research was
established.
• Allocation of funds among various sectors: power and
irrigation, social services, communications and
transport, and miscellaneous.
• The target growth rate was 4.5% and the actual growth
rate was 4.27%.
Third Five Year plan(1961-1966)
• The Third Five-year Plan stressed on agriculture
and improvement in the production of wheat
• Brief Sino- Indian War of 1962 exposed
weaknesses in the economy and shifted the focus
towards the defense industry and the Indian
Army.
• In 1965–1966, India fought a war with Pakistan.
• There was also a severe drought in 1965.
• The war led to inflation and the priority was
shifted to price stabilization.
Third Five Year plan: A Review
• Dams were constructed.
• Cement and fertilizer plants were built.
• Punjab began producing an abundance of Wheat.
• Many primary schools were started in rural areas.
• States were made responsible for Secondary & Higher education.
• Panchayat elections were started and the states were given more
development responsibilities.
• State electricity boards and state secondary education boards were
formed.
• State road transportation corporations were formed and local road
building became a state responsibility.
• The target growth rate was 5.6%, but the actual growth rate was 2.4%.[
• Due to miserable failure of the Third Plan the government was forced to
declare "plan holidays" (from 1966–67, 1967–68, and 1968–69). Plan
holidays were due to war, lack of resources, and increase in inflation.
• Three annual plans were drawn during this intervening period.
Fourth Five Year plan(1969-1974)
• At this time Indira Gandhi was the Prime Minister
• 14 major Indian banks were Nationalised
• The Green Revolution in India advanced agriculture.
• Food grains production increased to bring about self
sufficiency in production.
• Funds earmarked for the industrial development had to
be used for the war effort with Bangladesh and
Pakistan.
• The target growth rate was 5.6%, but the actual growth
rate was 3.3%
Fifth Five Year plan(1974-1979)
• The Fifth Five-Year Plan laid stress on employment, poverty
alleviation and justice.
• The plan also focused on self-reliance in agricultural
production and defense.
• The Electricity Supply Act was amended in 1975, which
enabled the central government to enter into power
generation and transmission.
• The Indian National Highway System was introduced
• Many roads were widened to accommodate the
increasing traffic.
• Tourism also expanded.
• The target growth rate was 4.4% and the actual growth rate
was 5.0%.
Sixth Five Year plan (1980-1985)
• The Sixth Five-Year Plan marked the beginning
of Economic Liberalization.
• Price controls were eliminated and ration shops were
closed.
• This led to an increase in food prices and an increase in
the cost of living.
• Family Planning was also expanded for prevention of
overpopulation.
• The Sixth Five-Year Plan was a great success to the
Indian economy.
• The target growth rate was 5.2% and the actual growth
rate was 5.4%.
Seventh Five Year plan(1985-1989)
• Laid stress on improving the productivity level of industries by upgrading
of technology.
• The main objectives were to establish growth in areas of increasing
economic productivity, production of food grains, and generating
employment.
• The Seventh Plan had strived towards socialism and energy production at
large.
• Thrust areas were: social justice, removal of oppression of the weak, using
modern technology, agricultural development, anti-poverty programmes,
full supply of food, clothing, and shelter, increasing productivity of small-
and large-scale farmers, and making India an independent economy.
• The target growth rate was 5.0% and the actual growth rate was 6.01%.
Period between 1989-91
• The Eighth Plan could not take off in 1990 due
to the fast changing political situation at the
Centre
• The years 1990-91 and 1991-92 were treated
as Annual Plans.
• The Eighth Plan was finally launched in 1992
after the initiation of structural adjustment
policies.
Eight Five Year plan(1992-1997)
• 1989–91 was a period of economic instability in India and hence no
five-year plan was implemented.
• Between 1990 and 1992, there were only Annual Plans.
• In 1991, India faced a crisis in foreign exchange reserves, left with
reserves of only about US$1 billion. Thus, under pressure, the country
took the risk of reforming the socialist economy.
• P.V. Narasimha Rao was Prime Minister
• Dr. Manmohan Singh launched privatisation & liberalisation in India
that brought the nearly bankrupt nation back from the edge.
Eight Five Year plan: A review
• Modernization of industries was a major highlight of the
Eighth Plan.
• Gradual opening of the Indian economy was undertaken to
correct the burgeoning deficit and foreign debt.
• India became a member of the WTO on 1 January 1995.
• The major objectives included, controlling population
growth, poverty reduction, employment generation,
strengthening the infrastructure, institutional building,
tourism management, human resource development,
involvement of Panchayati rajs, Nagar Palikas, NGOs ,
decentralisation and people's participation.
• Energy was given priority with 26.6% of the outlay.
• An average annual growth rate of 6.78% against the target
5.6% was achieved.
Ninth Five Year Plan (1997 - 2002)
• Population control.
• Correct inequalities
• Increase economic growth
• Generating employment by giving priority to agriculture and rural
development.
• Reduction of poverty.
• Ensuring proper availability of food and water for the poor.
• Availability of primary health care facilities and other basic necessities.
• Primary education to all children in the country.
• Empowering the socially disadvantaged classes like Scheduled castes,
Scheduled tribes and other backward classes.
• Developing self-reliance in terms of agriculture.
• Acceleration in the growth rate of the economy with the help of stable
prices.
Tenth Five Year Plan(2002-2007)
• Attain 8% GDP growth per year.
• Reduction of poverty by 5% by 2007.
• Providing gainful and high-quality employment at
least to the addition to the labour force.
• Reduction in gender gaps in literacy and wage
rates by at least 50% by 2007.
• Expenditure of ₨ 43,825 crores for tenth five
years
• Target growth: 8.1% - growth achieved: 7.7%
Broad based and Inclusive Growth
• Accelerate GDP growth from 8% to 10%
• Increase agricultural GDP growth rate to 4%
• Create 70 million new work opportunities.
• Increase literacy rate for persons of age 7 years or
above to 85%
• Target growth: 9% ; Growth achieved:7.9%
11th Five Year Plan Highlights
Strategy for faster and inclusive growth
• Regaining Agricultural Dynamism.
• Promoting access to Health and education.
• Developing Rural Infrastructure.
• Special focus on Weaker Sections.
Socio Economic Targets
• Accelerating Growth
• Inclusive Development
• Bridging Divides
Accelerating Growth
• Accelerate growth rate of GDP from 8% to 10%
• Increase agricultural GDP growth rate to 4%
• Increase Industrial GDP growth rate to 10.5%
• Increase Services GDP growth rate to 9.4%
Inclusive Development
Empowerment through Education
• Reduce dropout rates of children from elementary
school
• Regular testing monitor effectiveness of education to
ensure quality.
• Increase literacy rate for persons of age 7 years
or more to 85%.
• Lower gender gap in literacy to 10 percentage
points.
Inclusive Development
Strategy for Better Health
• Reduce infant mortality rate (IMR) to 28 per 1000
live births.
• Provide clean drinking water for all by 2009.
• Reduce malnutrition among children of age
group 0-3 to half its present level.
• Reduce anaemia among women and girls by 50%
Inclusive Development
Rural Infrastructure
• Ensure electricity connection to all villages and BPL
households by 2009
• Ensure all-weather road connection to all habitation
with population 1000 and above by 2009
• Connect every village by telephone by November 2007
and provide broadband connectivity to all villages by
2012.
Bridging Divides
• Rural Urban Divide
• Gender Equity
• Bringing on par: SCs, STs, Minorities and others
Bridging Divides
Rural Urban Divide
• Growth of Agriculture.
• The Rural Employment Guarantee Scheme
• Proper implementation of different programmes in rural
areas for education, health, housing, water supply,
electrification and telecommunication.
Bridging Divides
Gender Equity
• Economic empowerment of Women.
• Women’s Health.
• Political participation.
• Violence against women.
Bridging Divides
Bringing on Par: SCs, STs, Minorities
• Educational Upliftment.
• Economic and political empowerment.
• Eradication of Bonded Labour and their
rehabilitation.
• Special Component Plan for SCs.
Achievements
• The growth rate of the agriculture sector came upto
7.16 per cent.
• The services sector had a growth rate of 8.84 per cent.
• Effective implementation of several poverty alleviation
schemes ensured attainment of better standards.
• The targeted growth rate for the Eleventh Five Year
Plan was 8.33 per cent, but the actual growth that was
achieved was 7.9 per cent.
• 12th five year plan (2012-17) sets average
growth target at 8.2 percent.
• The theme of the Approach Paper is
“Faster, Sustainable and more inclusive growth” .
12th Five Year Plan
Growth Rate (in %)
Twelfth Plan Objectives
• Basic objective : Faster, More Inclusive, and
Sustainable Growth.
• Aims at 9.0 to 9.5 percent
• For growth to be more inclusive we need: Better
performance in agriculture
• Faster creation of jobs, especially in manufacturing
• Stronger efforts at health, education and
Infrastructure.
• Special plans for disadvantaged/backward regions
"Twelve Strategy Challenges”
• Enhancing the Capacity for Growth
• Enhancing Skills and Faster Generation of Employment
• Managing the Environment
• Markets for Efficiency and Inclusion
• Decentralization, Empowerment and Information
• Technology and Innovation
• Securing the Energy Future for India
• Accelerated Development of Transport Infrastructure
• Rural Transformation and Sustained Growth of Agriculture
• Managing Urbanization
• Improved Access to Quality Education
• Better Preventive and Curative Health Care
Strategic Challenges
Core Areas
• Agriculture
• Industry
• Education and Skill development
• Health
• Energy
• Urban Development
• Infrastructure
11/5/2014 Dr. Kavita Srivastava 38
12th Five Year Plan
Sectors
Sector wise Growth Targets
Sl.No. Sectors 11th FYP (achieved) (in %) 12th FYP (in %)
1 Agriculture, Forestry & Fishing 3.7 4.0
2 Mining 4.7 8.0
3 Manufacturing 7.7 9.8
4 Elect. Gas & Water Supply 6.4 8.5
5 Construction 7.8 10.0
6 Trade, Hotels & Restaurant+
Transport, Storage & Communication
9.9 11.0
7
8 Financing, Insurance, Real Estate &
Business services
10.7 10.0
9 Community, Social & Personal
Services
9.4 8.0
11 Industry 7.4 9.6
12 Services 10.0 10.0
Growth Rate Targets
Agriculture
• Target at least 4% growth for agriculture.
• Cereals are on target for 1.5 to 2% growth.
• Land and water are the critical constraints. Technology must
focus on land productivity and water use efficiency.
• Farmers need better functioning markets for both outputs
and inputs. Also, better rural infrastructure, including storage
and food processing
• States must act to modernize land records and enable
properly recorded land lease markets.
Industry
• Investment and capacity additions are critical for
sustained industrial growth.
• Need to grow at 11-12% per year to create 2 million
additional jobs per year. Growth in 11th Plan is in 8%.
• Indian industry must develop greater domestic value
addition.
• Tune-up FDI and trade policies to attract quality
investment in critical areas.
• Improve business regulatory framework: ‘cost of doing
business’, transparency, incentives for R&D, innovation
etc.
• Better consultation and co-ordination in industrial
policy making
Industry
• Some sectors should be given special attention because they
contribute most to our objectives
e.g. Create large employment: textiles and garments, leather and
footwear; gems and jewellery; food processing industries
• Deepen technological capabilities:
– Machine tools; IT hardware and electronics
• Provide strategic security:
– telecom equipment; aerospace; shipping; defence equipment
• Capital equipment for infrastructure growth:
– Heavy electrical equipment; Heavy transport and earth-moving
equipment
• Sectoral plans are being prepared for each of the above with
involvement of industry associations and the concerned Ministries
Education
and Skill
Development
• Must aim at universalisation of secondary education by
2017
• Must aim at raising the Gross Enrolment Ratio (GER) in
Higher Education to 20 percent by 2017 and 25 percent by
2022
• Must focus on quality of education. Must invest in faculty
development and teachers’ training
• Must aim at significant reduction in social, gender and
regional gaps in education. Targets to be set for this purpose
• Research and innovation in higher education must be
encouraged with cross-linkages between institutions and
industry
Health
• Better health is not only about curative care, but about better
prevention, Clean drinking water, sanitation and better
nutrition, childcare, etc. Convergence of schemes across
Ministries is needed.
• Expenditure on health by Centre and States to increase from
1.3% of GDP to at least 2.0%, and perhaps 2.5% of GDP by end
of 12th Plan
• Desperate shortage of medical personnel. Need targeted
approach to increase seats in medical colleges, nursing colleges
and other licensed health professionals
• Health insurance cover should be expanded to all
disadvantaged groups
• Focus on women and children
Energy
• Commercial energy demand will increase at
7% p.a. if GDP grows at 9%. This will require a
major supply side response and also demand
management
• Energy pricing is a major issue. Petroleum and
Coal prices are significantly below world prices
and world prices are unlikely to soften.
1. Power Sector Issues
• We must set a target of 100,000 MW capacity in
12th Plan (against achievement of 50,000 MW in
Eleventh Plan)
• Coal availability will be a major constraint
• Hydro-power development seriously hindered by
forest and environment clearance procedures.
• Electricity tariffs not being revised to reflect rising
costs. Regulators are being held back from
allowing justified tariff increases.
2. Other Energy Sources
• Nuclear power programme must continue with
necessary safety review.
• Solar Mission is seriously underfunded.
• Need longer term energy solution for cooking in
rural areas. Expand LPG network (with cash
subsidy for the deserving, not subsidized prices).
Also use off grid solar and bio-mass energy
• Wind power development, including off shore
wind power, needs to be encouraged
Energy: Targets
Urban Development
• India’s urban population is expected to increase from 400
million in 2011 to about 600 million or more by 2030
• Critical challenges are basic urban services especially for the
poor: water, sewerage, sanitation, solid waste management,
affordable housing, public transport
• Investment required in urban infrastructure is estimated at
`60 lakh crore over the next 20 years
• Need to develop and propagate innovative ways of municipal
financing, through Public-Private Partnerships (PPPs)
• Land management strategies key for good urban
development as well as financing urban infrastructure
development
Infrastructure
• Railways’ Western and Eastern Dedicated Freight Corridors must
be completed by the end of the Twelfth Plan
• High Speed Rail link between Delhi-Mumbai and Delhi-Kolkata in
the Twelfth Five Year Plan
• Complete the linkages between the ports and the existing road
and rail network. Need to deepen existing ports. Increase
bulk/container capacity
• Ensure sufficient provision for maintenance of the already-built
roads
• Invest in unified tolling and better safety on highways
• Improve bus services/public transport in smaller cities, towns
and districts.
Resource Allocation Priorities in 12th Plan
• Health and Education received less than projected in Eleventh Plan.
Allocations for these sectors have increased in 12th Plan
• Health, Education and Skill Development together in the Centre’s
Plan have increased by 1.2 percent point of GDP
• Infrastructure, including irrigation and watershed management and
urban infrastructure, will need additional 0.7 percentage point of
GDP over the next 4 years
• Use of PPP must be encouraged, including in the social sector, i.e.
health and education. Efforts on this front need to be intensified
12th Five Year Plan:
Sectoral Contribution in GDP
Compared to 11th Plan (2007-2012)

Economic planning in india

  • 1.
  • 2.
    What is anEconomic Plan? • A set of development programmes consistent among themselves (implementation of one does not conflict with pursuance of any other) • It should have some general goals as well as specific objectives which are to be achieved within specific period of time. • In India, plans are of five year duration and are called FIVE YEAR PLANS.
  • 3.
    Features of EconomicPlanning • Specification of objectives • Time target • Schemes of action to be drawn up sufficiently in advance • Internal balance or consistency of the plan • Optimisation – attaining objectives in the most efficient manner • Process of coordination and centralised decision- making
  • 4.
    Planning in India •Since 1947, the Indian economy has been premised on the concept of Planning • Planning in India has been carried through the Five-Year Plans, developed, executed, and monitored by the Planning Commission since 1950. • The draft of the first five-year plan was published in July 1951 and it was approved in December 1951. • With the Prime Minister as the ex-officio Chairman, the commission has a nominated Deputy Chairman, who holds the rank of a Cabinet Minister. • Montek Singh Ahluwalia is the last Deputy Chairman of the Commission (resigned on 26 May 2014). • The Eleventh Plan completed its term in March 2012 and the Twelfth Plan is currently underway.
  • 5.
    Five year planPeriod Target growth rate of GDP (%) Achievement (%) First plan 1951-56 2.1 3.6 Second plan 1956-61 4.5 4.21 Third plan 1961-66 5.6 2.72 Fourth plan 1969-74 5.7 2.05 Fifth plan 1974-79 4.4 4.83 Five Year Plans Sixth plan 1980-85 5.2 5.54 Seventh plan 1985-90 5.0 6.02 Eight plan 1992-97 5.6 6.68 Ninth Plan 1997-02 6.5 5.55 Tenth plan 2002-07 8.0 7.8 Eleventh plan 2007-12 9.0 7.9 Twelfth plan 2012-17 9.0 -
  • 6.
    • Prime MinisterPandit Jawaharlal Nehru presented the First Five-Year Plan in 1951 • Plan mainly focused in development of the primary sector. • The total planned budget of Rs.2069 crore was allocated to seven broad areas : Irrigation, Energy, Agriculture and community development, Transport and Communication, Industry, Social Services, Land Rehabilitation. • The target growth rate was 2.1% annual . First Five Year Plan (1951-1956)
  • 7.
    • The achievedgrowth rate was 3.6% . • National income increased more than the per capita income due to rapid population growth. • Many irrigation projects were initiated during this period, including the Bhakra Dam and Hirakud Dam. • At the end of the plan period in 1956, five IITs were started as major technical institutions. • The UGC was set up to take care of funding and take measures to strengthen higher education in the country. First Five Year Plan : A Review
  • 8.
    Second Five YearPlan(1956-1961) • The Second Plan focused on the development of the Public Sector Industries. • Followed Mahalanobis model propounded by the famous statistician Prasanta Chandra Mahalanobis in the year 1953.The model addresses different issues pertaining to economic development. • The plan attempted to determine the optimal allocation of investment between productive sectors in order to maximize long-run economic growth .
  • 9.
    Second Five YearPlan: A Review • Hydroelectric projects and steel plants at Bhilai, Durgapur and Rourkela were established. • Coal production was increased. • More Railway lines were added in the north east. • The Tata Institute of Fundamental Research was established. • Allocation of funds among various sectors: power and irrigation, social services, communications and transport, and miscellaneous. • The target growth rate was 4.5% and the actual growth rate was 4.27%.
  • 10.
    Third Five Yearplan(1961-1966) • The Third Five-year Plan stressed on agriculture and improvement in the production of wheat • Brief Sino- Indian War of 1962 exposed weaknesses in the economy and shifted the focus towards the defense industry and the Indian Army. • In 1965–1966, India fought a war with Pakistan. • There was also a severe drought in 1965. • The war led to inflation and the priority was shifted to price stabilization.
  • 11.
    Third Five Yearplan: A Review • Dams were constructed. • Cement and fertilizer plants were built. • Punjab began producing an abundance of Wheat. • Many primary schools were started in rural areas. • States were made responsible for Secondary & Higher education. • Panchayat elections were started and the states were given more development responsibilities. • State electricity boards and state secondary education boards were formed. • State road transportation corporations were formed and local road building became a state responsibility. • The target growth rate was 5.6%, but the actual growth rate was 2.4%.[ • Due to miserable failure of the Third Plan the government was forced to declare "plan holidays" (from 1966–67, 1967–68, and 1968–69). Plan holidays were due to war, lack of resources, and increase in inflation. • Three annual plans were drawn during this intervening period.
  • 12.
    Fourth Five Yearplan(1969-1974) • At this time Indira Gandhi was the Prime Minister • 14 major Indian banks were Nationalised • The Green Revolution in India advanced agriculture. • Food grains production increased to bring about self sufficiency in production. • Funds earmarked for the industrial development had to be used for the war effort with Bangladesh and Pakistan. • The target growth rate was 5.6%, but the actual growth rate was 3.3%
  • 13.
    Fifth Five Yearplan(1974-1979) • The Fifth Five-Year Plan laid stress on employment, poverty alleviation and justice. • The plan also focused on self-reliance in agricultural production and defense. • The Electricity Supply Act was amended in 1975, which enabled the central government to enter into power generation and transmission. • The Indian National Highway System was introduced • Many roads were widened to accommodate the increasing traffic. • Tourism also expanded. • The target growth rate was 4.4% and the actual growth rate was 5.0%.
  • 14.
    Sixth Five Yearplan (1980-1985) • The Sixth Five-Year Plan marked the beginning of Economic Liberalization. • Price controls were eliminated and ration shops were closed. • This led to an increase in food prices and an increase in the cost of living. • Family Planning was also expanded for prevention of overpopulation. • The Sixth Five-Year Plan was a great success to the Indian economy. • The target growth rate was 5.2% and the actual growth rate was 5.4%.
  • 15.
    Seventh Five Yearplan(1985-1989) • Laid stress on improving the productivity level of industries by upgrading of technology. • The main objectives were to establish growth in areas of increasing economic productivity, production of food grains, and generating employment. • The Seventh Plan had strived towards socialism and energy production at large. • Thrust areas were: social justice, removal of oppression of the weak, using modern technology, agricultural development, anti-poverty programmes, full supply of food, clothing, and shelter, increasing productivity of small- and large-scale farmers, and making India an independent economy. • The target growth rate was 5.0% and the actual growth rate was 6.01%.
  • 16.
    Period between 1989-91 •The Eighth Plan could not take off in 1990 due to the fast changing political situation at the Centre • The years 1990-91 and 1991-92 were treated as Annual Plans. • The Eighth Plan was finally launched in 1992 after the initiation of structural adjustment policies.
  • 17.
    Eight Five Yearplan(1992-1997) • 1989–91 was a period of economic instability in India and hence no five-year plan was implemented. • Between 1990 and 1992, there were only Annual Plans. • In 1991, India faced a crisis in foreign exchange reserves, left with reserves of only about US$1 billion. Thus, under pressure, the country took the risk of reforming the socialist economy. • P.V. Narasimha Rao was Prime Minister • Dr. Manmohan Singh launched privatisation & liberalisation in India that brought the nearly bankrupt nation back from the edge.
  • 18.
    Eight Five Yearplan: A review • Modernization of industries was a major highlight of the Eighth Plan. • Gradual opening of the Indian economy was undertaken to correct the burgeoning deficit and foreign debt. • India became a member of the WTO on 1 January 1995. • The major objectives included, controlling population growth, poverty reduction, employment generation, strengthening the infrastructure, institutional building, tourism management, human resource development, involvement of Panchayati rajs, Nagar Palikas, NGOs , decentralisation and people's participation. • Energy was given priority with 26.6% of the outlay. • An average annual growth rate of 6.78% against the target 5.6% was achieved.
  • 19.
    Ninth Five YearPlan (1997 - 2002) • Population control. • Correct inequalities • Increase economic growth • Generating employment by giving priority to agriculture and rural development. • Reduction of poverty. • Ensuring proper availability of food and water for the poor. • Availability of primary health care facilities and other basic necessities. • Primary education to all children in the country. • Empowering the socially disadvantaged classes like Scheduled castes, Scheduled tribes and other backward classes. • Developing self-reliance in terms of agriculture. • Acceleration in the growth rate of the economy with the help of stable prices.
  • 20.
    Tenth Five YearPlan(2002-2007) • Attain 8% GDP growth per year. • Reduction of poverty by 5% by 2007. • Providing gainful and high-quality employment at least to the addition to the labour force. • Reduction in gender gaps in literacy and wage rates by at least 50% by 2007. • Expenditure of ₨ 43,825 crores for tenth five years • Target growth: 8.1% - growth achieved: 7.7%
  • 21.
    Broad based andInclusive Growth • Accelerate GDP growth from 8% to 10% • Increase agricultural GDP growth rate to 4% • Create 70 million new work opportunities. • Increase literacy rate for persons of age 7 years or above to 85% • Target growth: 9% ; Growth achieved:7.9% 11th Five Year Plan Highlights
  • 22.
    Strategy for fasterand inclusive growth • Regaining Agricultural Dynamism. • Promoting access to Health and education. • Developing Rural Infrastructure. • Special focus on Weaker Sections.
  • 23.
    Socio Economic Targets •Accelerating Growth • Inclusive Development • Bridging Divides
  • 24.
    Accelerating Growth • Accelerategrowth rate of GDP from 8% to 10% • Increase agricultural GDP growth rate to 4% • Increase Industrial GDP growth rate to 10.5% • Increase Services GDP growth rate to 9.4%
  • 25.
    Inclusive Development Empowerment throughEducation • Reduce dropout rates of children from elementary school • Regular testing monitor effectiveness of education to ensure quality. • Increase literacy rate for persons of age 7 years or more to 85%. • Lower gender gap in literacy to 10 percentage points.
  • 26.
    Inclusive Development Strategy forBetter Health • Reduce infant mortality rate (IMR) to 28 per 1000 live births. • Provide clean drinking water for all by 2009. • Reduce malnutrition among children of age group 0-3 to half its present level. • Reduce anaemia among women and girls by 50%
  • 27.
    Inclusive Development Rural Infrastructure •Ensure electricity connection to all villages and BPL households by 2009 • Ensure all-weather road connection to all habitation with population 1000 and above by 2009 • Connect every village by telephone by November 2007 and provide broadband connectivity to all villages by 2012.
  • 28.
    Bridging Divides • RuralUrban Divide • Gender Equity • Bringing on par: SCs, STs, Minorities and others
  • 29.
    Bridging Divides Rural UrbanDivide • Growth of Agriculture. • The Rural Employment Guarantee Scheme • Proper implementation of different programmes in rural areas for education, health, housing, water supply, electrification and telecommunication.
  • 30.
    Bridging Divides Gender Equity •Economic empowerment of Women. • Women’s Health. • Political participation. • Violence against women.
  • 31.
    Bridging Divides Bringing onPar: SCs, STs, Minorities • Educational Upliftment. • Economic and political empowerment. • Eradication of Bonded Labour and their rehabilitation. • Special Component Plan for SCs.
  • 32.
    Achievements • The growthrate of the agriculture sector came upto 7.16 per cent. • The services sector had a growth rate of 8.84 per cent. • Effective implementation of several poverty alleviation schemes ensured attainment of better standards. • The targeted growth rate for the Eleventh Five Year Plan was 8.33 per cent, but the actual growth that was achieved was 7.9 per cent.
  • 33.
    • 12th fiveyear plan (2012-17) sets average growth target at 8.2 percent. • The theme of the Approach Paper is “Faster, Sustainable and more inclusive growth” . 12th Five Year Plan
  • 35.
  • 36.
    Twelfth Plan Objectives •Basic objective : Faster, More Inclusive, and Sustainable Growth. • Aims at 9.0 to 9.5 percent • For growth to be more inclusive we need: Better performance in agriculture • Faster creation of jobs, especially in manufacturing • Stronger efforts at health, education and Infrastructure. • Special plans for disadvantaged/backward regions
  • 37.
    "Twelve Strategy Challenges” •Enhancing the Capacity for Growth • Enhancing Skills and Faster Generation of Employment • Managing the Environment • Markets for Efficiency and Inclusion • Decentralization, Empowerment and Information • Technology and Innovation • Securing the Energy Future for India • Accelerated Development of Transport Infrastructure • Rural Transformation and Sustained Growth of Agriculture • Managing Urbanization • Improved Access to Quality Education • Better Preventive and Curative Health Care Strategic Challenges
  • 38.
    Core Areas • Agriculture •Industry • Education and Skill development • Health • Energy • Urban Development • Infrastructure 11/5/2014 Dr. Kavita Srivastava 38
  • 39.
    12th Five YearPlan Sectors
  • 40.
  • 42.
    Sl.No. Sectors 11thFYP (achieved) (in %) 12th FYP (in %) 1 Agriculture, Forestry & Fishing 3.7 4.0 2 Mining 4.7 8.0 3 Manufacturing 7.7 9.8 4 Elect. Gas & Water Supply 6.4 8.5 5 Construction 7.8 10.0 6 Trade, Hotels & Restaurant+ Transport, Storage & Communication 9.9 11.0 7 8 Financing, Insurance, Real Estate & Business services 10.7 10.0 9 Community, Social & Personal Services 9.4 8.0 11 Industry 7.4 9.6 12 Services 10.0 10.0 Growth Rate Targets
  • 43.
    Agriculture • Target atleast 4% growth for agriculture. • Cereals are on target for 1.5 to 2% growth. • Land and water are the critical constraints. Technology must focus on land productivity and water use efficiency. • Farmers need better functioning markets for both outputs and inputs. Also, better rural infrastructure, including storage and food processing • States must act to modernize land records and enable properly recorded land lease markets.
  • 44.
    Industry • Investment andcapacity additions are critical for sustained industrial growth. • Need to grow at 11-12% per year to create 2 million additional jobs per year. Growth in 11th Plan is in 8%. • Indian industry must develop greater domestic value addition. • Tune-up FDI and trade policies to attract quality investment in critical areas. • Improve business regulatory framework: ‘cost of doing business’, transparency, incentives for R&D, innovation etc. • Better consultation and co-ordination in industrial policy making
  • 45.
    Industry • Some sectorsshould be given special attention because they contribute most to our objectives e.g. Create large employment: textiles and garments, leather and footwear; gems and jewellery; food processing industries • Deepen technological capabilities: – Machine tools; IT hardware and electronics • Provide strategic security: – telecom equipment; aerospace; shipping; defence equipment • Capital equipment for infrastructure growth: – Heavy electrical equipment; Heavy transport and earth-moving equipment • Sectoral plans are being prepared for each of the above with involvement of industry associations and the concerned Ministries
  • 46.
    Education and Skill Development • Mustaim at universalisation of secondary education by 2017 • Must aim at raising the Gross Enrolment Ratio (GER) in Higher Education to 20 percent by 2017 and 25 percent by 2022 • Must focus on quality of education. Must invest in faculty development and teachers’ training • Must aim at significant reduction in social, gender and regional gaps in education. Targets to be set for this purpose • Research and innovation in higher education must be encouraged with cross-linkages between institutions and industry
  • 47.
    Health • Better healthis not only about curative care, but about better prevention, Clean drinking water, sanitation and better nutrition, childcare, etc. Convergence of schemes across Ministries is needed. • Expenditure on health by Centre and States to increase from 1.3% of GDP to at least 2.0%, and perhaps 2.5% of GDP by end of 12th Plan • Desperate shortage of medical personnel. Need targeted approach to increase seats in medical colleges, nursing colleges and other licensed health professionals • Health insurance cover should be expanded to all disadvantaged groups • Focus on women and children
  • 48.
    Energy • Commercial energydemand will increase at 7% p.a. if GDP grows at 9%. This will require a major supply side response and also demand management • Energy pricing is a major issue. Petroleum and Coal prices are significantly below world prices and world prices are unlikely to soften.
  • 49.
    1. Power SectorIssues • We must set a target of 100,000 MW capacity in 12th Plan (against achievement of 50,000 MW in Eleventh Plan) • Coal availability will be a major constraint • Hydro-power development seriously hindered by forest and environment clearance procedures. • Electricity tariffs not being revised to reflect rising costs. Regulators are being held back from allowing justified tariff increases.
  • 50.
    2. Other EnergySources • Nuclear power programme must continue with necessary safety review. • Solar Mission is seriously underfunded. • Need longer term energy solution for cooking in rural areas. Expand LPG network (with cash subsidy for the deserving, not subsidized prices). Also use off grid solar and bio-mass energy • Wind power development, including off shore wind power, needs to be encouraged
  • 51.
  • 52.
    Urban Development • India’surban population is expected to increase from 400 million in 2011 to about 600 million or more by 2030 • Critical challenges are basic urban services especially for the poor: water, sewerage, sanitation, solid waste management, affordable housing, public transport • Investment required in urban infrastructure is estimated at `60 lakh crore over the next 20 years • Need to develop and propagate innovative ways of municipal financing, through Public-Private Partnerships (PPPs) • Land management strategies key for good urban development as well as financing urban infrastructure development
  • 53.
    Infrastructure • Railways’ Westernand Eastern Dedicated Freight Corridors must be completed by the end of the Twelfth Plan • High Speed Rail link between Delhi-Mumbai and Delhi-Kolkata in the Twelfth Five Year Plan • Complete the linkages between the ports and the existing road and rail network. Need to deepen existing ports. Increase bulk/container capacity • Ensure sufficient provision for maintenance of the already-built roads • Invest in unified tolling and better safety on highways • Improve bus services/public transport in smaller cities, towns and districts.
  • 56.
    Resource Allocation Prioritiesin 12th Plan • Health and Education received less than projected in Eleventh Plan. Allocations for these sectors have increased in 12th Plan • Health, Education and Skill Development together in the Centre’s Plan have increased by 1.2 percent point of GDP • Infrastructure, including irrigation and watershed management and urban infrastructure, will need additional 0.7 percentage point of GDP over the next 4 years • Use of PPP must be encouraged, including in the social sector, i.e. health and education. Efforts on this front need to be intensified
  • 57.
    12th Five YearPlan: Sectoral Contribution in GDP Compared to 11th Plan (2007-2012)