Orient Bell Q4FY15: Operating profit surges 108.2% y/y; Buy
•
1 like•304 views

Firstcall recommend Orient Bell after 108.2% upsurge in Q4FY15 operating profits

Recommended
Recommended
More Related Content
What's hot
What's hot (19)
Viewers also liked
Similar to Orient Bell Q4FY15: Operating profit surges 108.2% y/y; Buy
Similar to Orient Bell Q4FY15: Operating profit surges 108.2% y/y; Buy (20)
More from IndiaNotes.com
More from IndiaNotes.com (20)
Recently uploaded
Recently uploaded (20)
Orient Bell Q4FY15: Operating profit surges 108.2% y/y; Buy
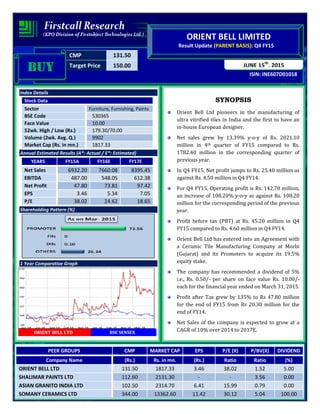
- 1. CMP 131.50 Target Price 150.00 ISIN: INE607D01018 JUNE 15th , 2015 ORIENT BELL LIMITED Result Update (PARENT BASIS): Q4 FY15 BUYBUYBUYBUY Index Details Stock Data Sector Furniture, Furnishing, Paints BSE Code 530365 Face Value 10.00 52wk. High / Low (Rs.) 179.30/70.00 Volume (2wk. Avg. Q.) 9902 Market Cap (Rs. in mn.) 1817.33 Annual Estimated Results (A*: Actual / E*: Estimated) YEARS FY15A FY16E FY17E Net Sales 6932.20 7660.08 8395.45 EBITDA 487.00 548.05 612.38 Net Profit 47.80 73.81 97.42 EPS 3.46 5.34 7.05 P/E 38.02 24.62 18.65 Shareholding Pattern (%) 1 Year Comparative Graph ORIENT BELL LTD BSE SENSEX SYNOPSIS Orient Bell Ltd pioneers in the manufacturing of ultra vitrified tiles in India and the first to have an in-house European designer. Net sales grew by 13.39% y-o-y of Rs. 2021.10 million in 4th quarter of FY15 compared to Rs. 1782.40 million in the corresponding quarter of previous year. In Q4 FY15, Net profit jumps to Rs. 25.40 million as against Rs. 4.50 million in Q4 FY14. For Q4 FY15, Operating profit is Rs. 142.70 million, an increase of 108.20% y-o-y as against Rs. 108.20 million for the corresponding period of the previous year. Profit before tax (PBT) at Rs. 45.20 million in Q4 FY15 compared to Rs. 4.60 million in Q4 FY14. Orient Bell Ltd has entered into an Agreement with a Ceramic Tile Manufacturing Company at Morbi (Gujarat) and its Promoters to acquire its 19.5% equity stake. The company has recommended a dividend of 5% i.e., Rs. 0.50/- per share on face value Rs. 10.00/- each for the financial year ended on March 31, 2015. Profit after Tax grew by 135% to Rs 47.80 million for the end of FY15 from Rs 20.30 million for the end of FY14. Net Sales of the company is expected to grow at a CAGR of 10% over 2014 to 2017E. PEER GROUPS CMP MARKET CAP EPS P/E (X) P/BV(X) DIVIDEND Company Name (Rs.) Rs. in mn. (Rs.) Ratio Ratio (%) ORIENT BELL LTD 131.50 1817.33 3.46 38.02 1.52 5.00 SHALIMAR PAINTS LTD 112.60 2131.30 - - 3.56 0.00 ASIAN GRANITO INDIA LTD 102.50 2314.70 6.41 15.99 0.79 0.00 SOMANY CERAMICS LTD 344.00 13362.60 11.42 30.12 5.04 100.00
- 2. QUARTERLY HIGHLIGHTS (PARENT BASIS) Results updates- Q4 FY15 . The company has achieved a turnover of Rs. 2021.10 million for the 4th quarter of the financial year 2015 as against Rs. 1782.40 million in the corresponding quarter of the previous year. In Q4 FY15, net profit jumps to Rs. 25.40 million as compared to Rs. 4.50 million in Q4 FY14. EBITDA of Rs. 142.70 million in Q4 FY14 and increase of 31.89% against the corresponding period of last year. The company has reported an EPS of Rs. 1.84 for the 4th quarter as against an EPS of Rs. 0.33 in the corresponding quarter of the previous year. Break up of Expenditure Break up of Expenditure (Values in Million) Q4 FY15 Q4 FY14 Chg % Cost of Material Consumed 315.50 301.60 5% Purchase of stock in trade 485.20 429.40 13% Employee Cost 157.00 134.10 17% Depreciation 52.50 50.20 5% Power & Fuel 425.20 447.50 -5% Other Expenses 310.40 329.70 -6% Latest Updates: • Orient Bell Ltd has entered into an Agreement with a Ceramic Tile Manufacturing Company at Morbi (Gujarat) and its Promoters to acquire its 19.5% equity stake. The Company is setting up a new plant to manufacture about 46 (forty six) lacs square meters of tiles (polished and glazed) per annum at Morbi (Gujarat) and likely to start commercial production by the end of December, 2015. • The company has recommended a dividend of 5% i.e., Rs. 0.50/- per share on face value Rs. 10.00/- each for the financial year ended on March 31, 2015. Rs. In million Mar-15 Mar-14 % Change Net Sales 2021.10 1782.40 13.39 PAT 25.40 4.50 464.44 EPS 1.84 0.33 454.23 EBITDA 142.70 108.20 31.89
- 3. COMPANY PROFILE Orient Bell Ltd has been on the forefront of innovation in home décor. Innovative and forward-looking, The Company pioneers in the manufacturing of ultra vitrified tiles in India and the first to have an in-house European designer. Quality and durability, combined with the aesthetics of design and colour has transformed into experts that offer extraordinary wall and floor solutions. Orient's latest initiative of launching a chain of signature showrooms is to display its complete product range and helps their retailers in concept selling. In India, apart from decorating a million homes, Orient has offered its design expertise to the prestigious Rashtrapati Bhavan, the Delhi High Court and the new Kolkata Airport. Product Catalogues • Orient Floor Tiles Collection • Westzone Orient Wall Tile Collection • OBL Wall Tiles 10x15 Booklet • OBL DIVINE 30X60 CATALOG (NEW) • OBL Wall Tiles Collection • OBL DIGITAL WALL TILES 12x18, 9x18 & 8x12 BOOKLET • Orient Non Digital Wall & Floor Tiles BOOKLET Manufacturing Facilities Manufacturing unit at Sikandrabad - U.P., Vadodara - Gujarat and Hoskote - Karnataka where we can cover more than 30 crore square feet of walls and floors every year which conforms to IS 15622:2006 of BIS specifications and ISO 10545-1/17, ISO 13006 for dust pressed Ceramic Tiles. The unit has its internal norms, designated as "Orient Norms" which are more stringent than the IS & ISO standards. The company today possesses state of the art technology, which enables a finished tile to be produced from ceramic powder and packed untouched by hands, within 2 hours of processing raw materials. The adherence to quality standards and utilization of the state-of-the-art technology ensures optimum utilization of resources with minimum cost and time consumption. The environment friendly unit is ISO-14001: 2004 certified.
- 4. FINANCIAL HIGHLIGHT (PARENT BASIS) (A*- Actual, E* -Estimations & Rs. In Millions) Balance Sheet as at March31, 2014 -2017E FY14A FY15A FY16E FY17E I. EQUITY AND LIABILITIES: A. Shareholders’ Funds a) Share Capital 135.73 138.20 138.20 138.20 b) Reserves and Surplus 1630.60 1675.00 1718.55 1804.48 Sub-Total-Net worth 1766.33 1813.20 1856.75 1942.68 B. Non-Current Liabilities: a) Long-term borrowings 885.04 620.10 496.08 406.79 b) Deferred Tax Liabilities [Net] 90.43 97.50 104.33 110.58 c) Other Long Term Liabilities 11.19 13.60 16.46 18.92 d) Long Term Provisions 12.88 14.60 16.35 17.99 Sub-Total-Long term liabilities 999.54 745.80 633.21 554.28 C. Current Liabilities: a) Short-term borrowings 739.67 778.30 809.43 833.71 b) Trade Payables 1105.36 1036.70 1092.68 1169.17 c) Other Current Liabilities 393.62 446.30 499.86 549.84 d) Short Term Provisions 11.28 15.10 19.36 23.23 Sub-Total-Current Liabilities 2249.93 2276.40 2421.33 2575.96 TOTAL-EQUITY AND LIABILITIES (A+B+C) 5015.80 4835.40 4911.29 5072.92 II. ASSETS: D. Non-Current Assets: a) Fixed Assets 2387.24 2236.20 2280.92 2312.86 b) Non Current Investments 202.41 202.30 202.21 202.01 c) Long Term Loans and Advances 211.22 130.50 100.49 82.40 d) Other non-current assets 23.94 27.40 30.69 33.76 Sub-Total-Non-Current Assets 2824.81 2596.40 2614.31 2631.03 E. Current Assets: a) Inventories 1246.85 1017.30 864.71 821.47 b) Trade Receivables 723.62 934.20 1083.67 1216.01 c) Cash and Bank Balances 81.31 110.40 138.00 162.84 d) Short Term Loans and Advances 133.40 171.70 204.93 235.67 e) Other Current Assets 5.81 5.40 5.67 5.90 Sub-Total-Current Assets 2190.99 2239.00 2296.98 2441.89 TOTAL-ASSETS (D+E) 5015.80 4835.40 4911.29 5072.92
- 5. Annual Profit & Loss Statement for the period of 2014 to 2017E Value(Rs.in.mn) FY14A FY15A FY16E FY17E Description 12m 12m 12m 12m Net Sales 5846.70 6932.20 7660.08 8395.45 Other Income 14.60 28.70 33.29 37.29 Total Income 5861.30 6960.90 7693.37 8432.74 Expenditure -5379.00 -6473.90 -7145.32 -7820.36 Operating Profit 482.30 487.00 548.05 612.38 Interest -242.30 -206.80 -210.94 -221.48 Gross profit 240.00 280.20 337.11 390.89 Depreciation -194.10 -177.60 -186.48 -194.87 Exceptional Items 0.00 -0.10 0.00 0.00 Profit Before Tax 45.90 102.50 150.63 196.02 Tax -25.60 -54.70 -76.82 -98.60 Net Profit 20.30 47.80 73.81 97.42 Equity capital 135.70 138.20 138.20 138.20 Reserves 1004.10 1055.40 1129.21 1226.63 Face value 10.00 10.00 10.00 10.00 EPS 1.50 3.46 5.34 7.05 Quarterly Profit & Loss Statement for the period of 30 SEPT, 2014 to 30 JUNE, 2015E Value(Rs.in.mn) 30-Sep-14 31-Dec-14 31-Mar-15 30-Jun-15E Description 3m 3m 3m 3m Net sales 1637.90 1701.30 2021.10 1827.07 Other income 5.70 3.90 12.00 9.84 Total Income 1643.60 1705.20 2033.10 1836.91 Expenditure -1530.50 -1577.80 -1890.40 -1702.83 Operating profit 113.10 127.40 142.70 134.08 Interest -55.00 -53.40 -44.90 -46.25 Gross profit 58.10 74.00 97.80 87.83 Depreciation -41.20 -43.70 -52.50 -43.05 Exceptional Items 0.00 0.00 -0.10 0.00 Profit Before Tax 16.90 30.30 45.20 44.78 Tax -8.60 -17.80 -19.80 -22.75 Net Profit 8.30 12.50 25.40 22.03 Equity capital 135.70 135.70 138.20 138.20 Face value 10.00 10.00 10.00 10.00 EPS 0.61 0.92 1.84 1.59
- 6. Ratio Analysis Particulars FY14A FY15A FY16E FY17E EPS (Rs.) 1.50 3.46 5.34 7.05 EBITDA Margin (%) 8.25% 7.03% 7.15% 7.29% PBT Margin (%) 0.79% 1.48% 1.97% 2.33% PAT Margin (%) 0.35% 0.69% 0.96% 1.16% P/E Ratio (x) 87.90 38.02 24.62 18.65 ROE (%) 1.78% 4.00% 5.82% 7.14% ROCE (%) 24.47% 25.64% 28.55% 30.98% Debt Equity Ratio 1.43 1.17 1.03 0.91 EV/EBITDA (x) 6.90 6.38 5.45 4.73 Book Value (Rs.) 83.99 86.37 91.71 98.76 P/BV 1.57 1.52 1.43 1.33 Charts
- 7. OUTLOOK AND CONCLUSION At the current market price of Rs. 131.50, the stock P/E ratio is at 24.62 x FY16E and 18.65 x FY17E respectively. Earning per share (EPS) of the company for the earnings for FY16E and FY17E is seen at Rs.5.34 and Rs.7.05 respectively. Net Sales of the company is expected to grow at a CAGR of 10% over 2014 to 2017E. On the basis of EV/EBITDA, the stock trades at 5.45 x for FY16E and 4.73 x for FY17E. Price to Book Value of the stock is expected to be at 1.43 x and 1.33 x respectively for FY16E and FY17E. We recommend ‘BUY’ in this particular scrip with a target price of Rs.150.00 for Medium to Long term investment.
- 8. INDUSTRY OVERVIEW In the residential replacement industry, ceramic tiles are used for many purposes such as designing, floor and wall fittings, protection from rain and moisture, and other environmental hazards. Residential replacement, besides having maximum market share, is also expected to be the fastest growing application segment of ceramic tiles at a CAGR of 8.6% from 2012 to 2018. Similarly, the floor tiles product category within the ceramic tiles market boasts the maximum share and has the fastest growth at a CAGR of 8.6% from 2012 to 2018. Floor tiles were followed by wall tiles, and other tiles that include countertop, façade, and so on, respectively. Wall tiles alone accounted for approximately 40% of the total ceramic tiles market in 2011. The global demand for wall tiles is expected to reach 7,096.4 million square meters by 2018, growing at a CAGR of 8.0% from 2012 to 2018. The increasing applications of all types of ceramic tiles are expected to drive the global ceramic tile market. OPPORTUNITIES & THREATS With the increasing construction activities, the tiles market in the country is set to flourish. The demand from institutional customers is outpacing the retail demand in many regions of the country. The overall Indian tiles market is expected to witness compounded annual growth rate of more than 18% till 2017. However, during the same period demand for vitrified tiles is expected to grow at the compounded annual growth rate of 21% due to increasing institutional sales. Orient Bell Ltd sees opportunity in the digitally printed tiles – the latest in trend. These tiles are increasingly in fashion as they give walls a stunning art work look deviating from the clichés of the dull painted walls. These tiles are created based on principles and procedures which are similar to graphic art work which offer photo-like high-resolution impressions. Through digital design, tiles can be decorated virtually with the best photo-quality image or design on plain or a textured surface. The USP of such tiles are that they are high definition (HD) digital tiles, that is, advanced digital printing technology which provides enhanced high-definition reproduction of colours and objects and also provides exact impressions of stones, marble and wood. The continuous sharp increase in the prices of natural gas a major source of fuel in manufacture of tiles, and the tiles manufactured in unorganized sector are the major threats to this Company. OUTLOOK The growth of Ceramic Industry is directly linked with the growth of real estate sector to a great extent. Over the past few years, residential segment in India has rapidly grown in demand. However, given slowdown in the economic activity and moderation in income, housing sector has suffered a setback. According to data released by Centre for Monitoring Indian Economy (CMIE), during FY 2013-14, approximately Rs. 214.9 billion worth of new investment was made in the housing construction sector as compared with Rs. 412.04 billion during FY
- 9. 2012-13 – plummeting by 48% year on year basis. Demand for ceramic tiles in India is driven by a combination of factors like rise in housing sector, urbanization rate, rise in nuclear families, rise in per capita income. Commercial sector and infrastructure projects form a huge customer base for tile industry. The commercial segment comprises office space, retail and hospitality space. The resourcing boom coupled with economic uptrend is expected to create a huge demand for office space in India and this in turn will boost increased sale of tiles. Disclaimer: This document is prepared by our research analysts and it does not constitute an offer or solicitation for the purchase or sale of any financial instrument or as an official confirmation of any transaction. The information contained herein is from publicly available data or other sources believed to be reliable but we do not represent that it is accurate or complete and it should not be relied on as such. Firstcall Research or any of its affiliates shall not be in any way responsible for any loss or damage that may arise to any person from any inadvertent error in the information contained in this report. Firstcall Research and/ or its affiliates and/or employees will not be liable for the recipients’ investment decision based on this document.
- 10. Firstcall India Equity Research: Email – info@firstobjectindia.com C.V.S.L.Kameswari Pharma & Diversified U. Janaki Rao Capital Goods B. Anil Kumar Auto, IT & FMCG M. Vinayak Rao Diversified G. Amarender Diversified Firstcall Research Provides Industry Research on all the Sectors and Equity Research on Major Companies forming part of Listed and Unlisted Segments For Further Details Contact: Tel.: 022-2527 2510/2527 6077 / 25276089 Telefax: 022-25276089 040-20000235 /20000233 E-mail: info@firstobjectindia.com www.firstcallresearch.com