Coral India Finance: Buy for medium to long-term investment
•
0 likes•216 views

Coral India Finance to benefit as government liberalises financial sector; Buy

Recommended
Recommended
More Related Content
What's hot
What's hot (20)
Viewers also liked
Similar to Coral India Finance: Buy for medium to long-term investment
Similar to Coral India Finance: Buy for medium to long-term investment (20)
More from IndiaNotes.com
More from IndiaNotes.com (20)
Recently uploaded
Recently uploaded (20)
Coral India Finance: Buy for medium to long-term investment
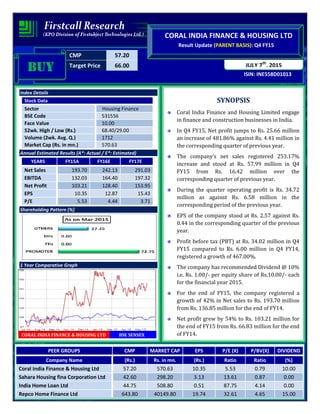
- 1. CMP 57.20 Target Price 66.00 ISIN: INE558D01013 JULY 7th , 2015 CORAL INDIA FINANCE & HOUSING LTD Result Update (PARENT BASIS): Q4 FY15 BUYBUYBUYBUY Index Details Stock Data Sector Housing Finance BSE Code 531556 Face Value 10.00 52wk. High / Low (Rs.) 68.40/29.00 Volume (2wk. Avg. Q.) 1712 Market Cap (Rs. in mn.) 570.63 Annual Estimated Results (A*: Actual / E*: Estimated) YEARS FY15A FY16E FY17E Net Sales 193.70 242.13 291.03 EBITDA 132.03 164.40 197.32 Net Profit 103.21 128.40 153.95 EPS 10.35 12.87 15.43 P/E 5.53 4.44 3.71 Shareholding Pattern (%) 1 Year Comparative Graph CORAL INDIA FINANCE & HOUSING LTD BSE SENSEX SYNOPSIS Coral India Finance and Housing Limited engage in finance and construction businesses in India. In Q4 FY15, Net profit jumps to Rs. 25.66 million an increase of 481.86% against Rs. 4.41 million in the corresponding quarter of previous year. The company’s net sales registered 253.17% increase and stood at Rs. 57.99 million in Q4 FY15 from Rs. 16.42 million over the corresponding quarter of previous year. During the quarter operating profit is Rs. 34.72 million as against Rs. 6.58 million in the corresponding period of the previous year. EPS of the company stood at Rs. 2.57 against Rs. 0.44 in the corresponding quarter of the previous year. Profit before tax (PBT) at Rs. 34.02 million in Q4 FY15 compared to Rs. 6.00 million in Q4 FY14, registered a growth of 467.00%. The company has recommended Dividend @ 10% i.e. Rs. 1.00/- per equity share of Rs.10.00/- each for the financial year 2015. For the end of FY15, the company registered a growth of 42% in Net sales to Rs. 193.70 million from Rs. 136.85 million for the end of FY14. Net profit grew by 54% to Rs. 103.21 million for the end of FY15 from Rs. 66.83 million for the end of FY14. PEER GROUPS CMP MARKET CAP EPS P/E (X) P/BV(X) DIVIDEND Company Name (Rs.) Rs. in mn. (Rs.) Ratio Ratio (%) Coral India Finance & Housing Ltd 57.20 570.63 10.35 5.53 0.79 10.00 Sahara Housing fina Corporation Ltd 42.60 298.20 3.13 13.61 0.87 0.00 India Home Loan Ltd 44.75 508.80 0.51 87.75 4.14 0.00 Repco Home Finance Ltd 643.80 40149.80 19.74 32.61 4.65 15.00
- 2. QUARTERLY HIGHLIGHTS (PARENT BASIS) Results updates- Q4 FY15, The company has achieved a turnover of Rs. 57.99 million for the 4th quarter of the financial year 2015 as against Rs. 16.42 million in the corresponding quarter of the previous year. EBITDA of Rs. 34.72 million in Q4 FY15, an increase of 427.66% against Rs. 6.58 million in the corresponding period of last year. In Q4 FY15, net profit of Rs. 25.66 million against Rs. 4.41 million in the corresponding quarter of the previous year. The company has reported an EPS of Rs. 2.57 for the 4th quarter as against an EPS of Rs. 0.44 in the corresponding quarter of the previous year. Break up of Expenditure Rs. In million Mar-15 Mar-14 % Change Net Sales 57.99 16.42 253.17 PAT 25.66 4.41 481.86 EPS 2.57 0.44 481.86 EBITDA 34.72 6.58 427.66 Break up of Expenditure (Rs in millions) Q4 FY15 Q4 FY14 % CHNG Employees Benefit Expenses 2.17 1.69 28% Depreciation & amortisation expense 0.69 0.45 53% Other expenses 5.72 8.15 -30%
- 3. Segment Revenue COMPANY PROFILE Coral India Finance and Housing Limited is a Coral Group company, engaged in finance and construction businesses in India. The company was incorporated in 1995 and is based in Mumbai, India. The company operates in the two segments of finance and construction. Coral went into agreement with Standard Fireworks to acquire 14,700 sq. ft. of land in Thane valued at Rs 3.11 crore for its project Coral Orchids. The company had acquired 12,500 sq. ft. of land valued at Rs 0.45 crore for its project Coral Gardens in Deolali, Nasik. It went into agreement with Kelani Builders & Developers for 435 sq. m. of prime land valued at Rs 0.19 crore for its project Coral Plaza in Chembur, Mumbai.
- 4. FINANCIAL HIGHLIGHT (PARENT BASIS) (A*- Actual, E* -Estimations & Rs. In Millions) Balance Sheet as at March 31, 2014 -2017E FY14A FY15A FY16E FY17E I. EQUITY AND LIABILITIES: A. Shareholders’ Funds a) Share Capital 104.17 104.17 104.17 104.17 b) Reserves and Surplus 528.84 620.15 713.17 813.02 Sub-Total-Net worth 633.01 724.32 817.34 917.19 B. Non-Current Liabilities: a) Deferred Tax Liabilities [Net] 2.72 2.61 2.64 2.69 b) Other Long Term Liabilities 15.86 27.68 36.54 45.31 c) Long Term Provisions 2.26 1.40 1.47 1.48 Sub-Total-Long term liabilities 20.84 31.69 40.64 49.48 C. Current Liabilities: a) Trade Payables 3.26 4.16 4.78 5.21 b) Other Current Liabilities 14.38 14.36 14.50 14.79 c) Short Term Provisions 28.27 55.57 86.13 107.67 Sub-Total-Current Liabilities 45.91 74.09 105.42 127.68 TOTAL-EQUITY AND LIABILITIES (A+B+C) 699.76 830.10 963.41 1094.34 II. ASSETS: D. Non-Current Assets: Fixed Assets i. Tangible Assets 26.45 26.00 26.26 26.79 ii. Intangible Assets 0.05 0.02 0.03 0.04 iii. Capital work-in-progress 24.18 38.46 50.38 59.96 a) Sub-Total-Fixed Assets 50.68 64.48 76.67 86.78 b) Non Current Investments 121.23 252.66 327.10 373.41 c) Long Term Loans and Advances 202.43 279.21 354.60 421.97 d) Other non-current assets 3.34 4.00 4.72 5.29 Sub-Total-Non-Current Assets 377.68 600.35 763.09 887.44 E. Current Assets: a) Inventories 168.51 128.19 117.93 120.29 b) Trade Receivables 4.96 1.15 1.17 1.23 c) Cash and Bank Balances 147.17 97.45 77.96 81.86 d) Short Term Loans and Advances 1.44 2.96 3.26 3.52 Sub-Total-Current Assets 322.08 229.75 200.32 206.90 TOTAL-ASSETS (D+E) 699.76 830.10 963.41 1094.34
- 5. Annual Profit & Loss Statement for the period of 2014 to 2017E Value(Rs.in.mn) FY14A FY15A FY16E FY17E Description 12m 12m 12m 12m Net Sales 136.85 193.70 242.13 291.03 Other Income 0.00 0.00 0.00 0.00 Total Income 136.85 193.70 242.13 291.03 Expenditure -51.03 -61.67 -77.72 -93.71 Operating Profit 85.82 132.03 164.40 197.32 Interest -0.13 -0.06 -0.06 -0.07 Gross profit 85.69 131.97 164.34 197.25 Depreciation -1.73 -1.87 -2.01 -2.13 Profit Before Tax 83.96 130.10 162.33 195.12 Tax -17.13 -26.89 -33.93 -41.17 Net Profit 66.83 103.21 128.40 153.95 Equity capital 99.76 99.76 99.76 99.76 Reserves 528.24 620.15 713.17 813.02 Face value 10.00 10.00 10.00 10.00 EPS 6.70 10.35 12.87 15.43 Quarterly Profit & Loss Statement for the period of 30 Sep, 2014 to 30 Jun, 2015E Value(Rs.in.mn) 30-Sep-14 31-Dec-14 31-Mar-15 30-Jun-15E Description 3m 3m 3m 3m Net sales 50.70 70.61 57.99 52.19 Other income 0.00 0.00 0.00 0.00 Total Income 50.70 70.61 57.99 52.19 Expenditure -15.48 -19.40 -23.27 -15.66 Operating profit 35.22 51.21 34.72 36.53 Interest -0.01 0.00 -0.01 0.00 Gross profit 35.21 51.21 34.71 36.53 Depreciation -0.40 -0.40 -0.69 -0.55 Profit Before Tax 34.81 50.81 34.02 35.98 Tax -6.51 -10.01 -8.36 -7.38 Net Profit 28.30 40.80 25.66 28.61 Equity capital 99.76 99.76 99.76 99.76 Face value 10.00 10.00 10.00 10.00 EPS 2.84 4.09 2.57 2.87
- 6. Ratio Analysis Particulars FY14A FY15A FY16E FY17E EPS (Rs.) 6.70 10.35 12.87 15.43 EBITDA Margin (%) 62.71 68.16 67.90 67.80 PBT Margin (%) 61.35 67.17 67.04 67.05 PAT Margin (%) 48.83 53.28 53.03 52.90 P/E Ratio (x) 8.54 5.53 4.44 3.71 ROE (%) 10.64 14.34 15.80 16.87 ROCE (%) 13.94 18.60 20.47 21.85 EV/EBITDA (x) 4.93 3.58 3.00 2.48 Book Value (Rs.) 62.95 72.16 81.49 91.50 P/BV 0.91 0.79 0.70 0.63 Charts
- 7. OUTLOOK AND CONCLUSION At the current market price of Rs. 57.20, the stock P/E ratio is at 4.44 x FY16E and 3.71 x FY17E respectively. Earning per share (EPS) of the company for the earnings for FY16E and FY17E is seen at Rs.12.87 and Rs.15.43 respectively. On the basis of EV/EBITDA, the stock trades at 3.00 x for FY16E and 2.48 x for FY17E. Price to Book Value of the stock is expected to be at 0.70 x and 0.63 x respectively for FY16E and FY17E. We expect that the company surplus scenario is likely to continue for the next three years, will keep its growth story in the coming quarters also. We recommend ‘BUY’ in this particular scrip with a target price of Rs.66.00 for Medium to Long term investment. INDUSTRY OVERVIEW India has a diversified financial sector, which is undergoing rapid expansion. The sector comprises commercial banks, insurance companies, non-banking financial companies, co-operatives, pension funds, mutual funds and other smaller financial entities. The financial sector in India is predominantly a banking sector with commercial banks accounting for more than 60 per cent of the total assets held by the financial system. India's services sector has always served the country’s economy well, accounting for about 57 per cent of the gross domestic product (GDP). In this regard, the financial services sector has been an important contributor. The Government of India has introduced reforms to liberalise, regulate and enhance this industry. At present, India is undoubtedly one of the world's most vibrant capital markets. Challenges remain, but the future of the sector looks good. The advent of technology has also aided the growth of the industry. About 75 per cent of the insurance policies sold by 2020 would, in one way or another, be influenced by digital channels during the pre- purchase, purchase or renewal stages, as per a report by Boston Consulting Group (BCG) and Google India. Several measures have been outlined in the Union Budget 2014-15 that aim at reviving and accelerating investment which, inter alia, include fiscal consolidation with emphasis on expenditure reforms and continuation of fiscal reforms with rationalization of tax structure; fillip to industry and infrastructure, fiscal incentives and concrete measures for transport, power, and other urban and rural infrastructure; measures for promotion of foreign direct investment (FDI) in selected sectors, including defence manufacturing and insurance; and, steps to augment low cost long-term foreign borrowings by Indian companies. Fiscal reforms have been bolstered further by the recent deregulation of diesel prices. The launch of ‘Make in India’ global initiative is intended to invite both domestic and foreign investors to invest in India. The aim of the programme is to project India as an investment destination and develop, promote and market India as a leading manufacturing destination and as a hub for design and information. The programme further aims to radically improve the Ease of Doing Business,
- 8. open FDI regime, improve the quality of infrastructure and make India a globally competitive manufacturing destination. Outlook India is today one of the most vibrant global economies, on the back of robust banking and insurance sectors. The country is projected to become the fifth largest banking sector globally by 2020, as per a joint report by KPMG- CII. The report also expects bank credit to grow at a compound annual growth rate (CAGR) of 17 per cent in the medium term leading to better credit penetration. Life Insurance Council, the industry body of life insurers in the country also projects a CAGR of 12–15 per cent over the next few years for the financial services segment. Also, the relaxation of foreign investment rules has received a positive response from the insurance sector, with many companies announcing plans to increase their stakes in joint ventures with Indian companies. Over the coming quarters there could be a series of joint venture deals between global insurance giants and local players. Disclaimer: This document is prepared by our research analysts and it does not constitute an offer or solicitation for the purchase or sale of any financial instrument or as an official confirmation of any transaction. The information contained herein is from publicly available data or other sources believed to be reliable but we do not represent that it is accurate or complete and it should not be relied on as such. Firstcall Research or any of its affiliates shall not be in any way responsible for any loss or damage that may arise to any person from any inadvertent error in the information contained in this report. Firstcall Research and/ or its affiliates and/or employees will not be liable for the recipients’ investment decision based on this document.
- 9. Firstcall India Equity Research: Email – info@firstobjectindia.com C.V.S.L.Kameswari Pharma & Diversified U. Janaki Rao Capital Goods B. Anil Kumar Auto, IT & FMCG M. Vinayak Rao Diversified G. Amarender Diversified Firstcall Research Provides Industry Research on all the Sectors and Equity Research on Major Companies forming part of Listed and Unlisted Segments For Further Details Contact: Tel.: 022-2527 2510/2527 6077 / 25276089 Telefax: 022-25276089 040-20000235 /20000233 E-mail: info@firstobjectindia.com www.firstcallresearch.com