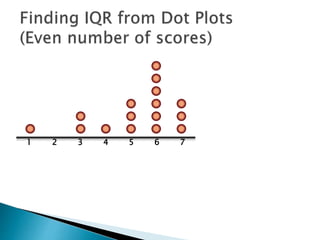
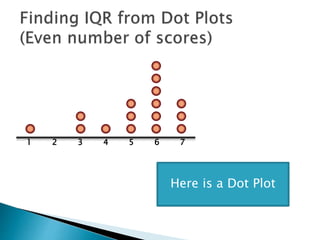
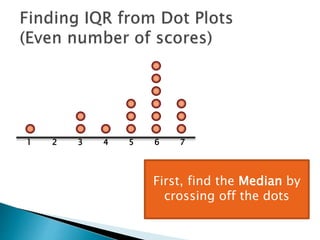
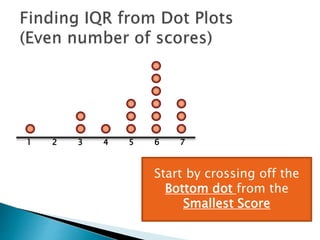
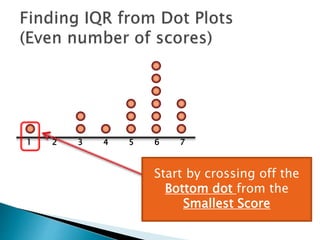
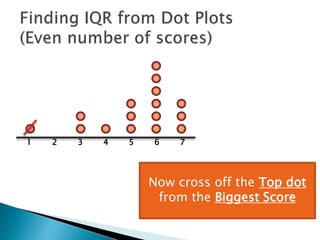
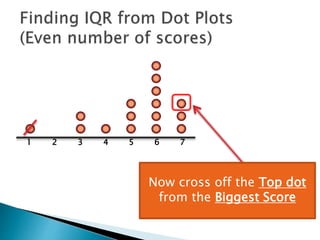
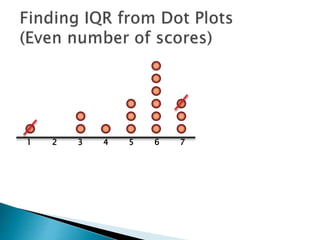
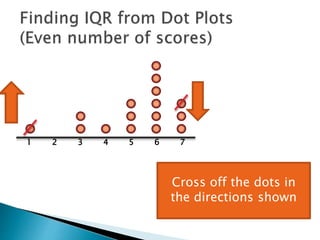
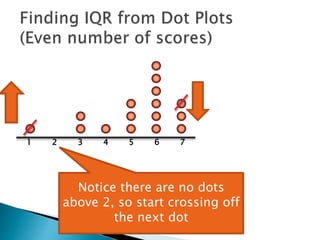
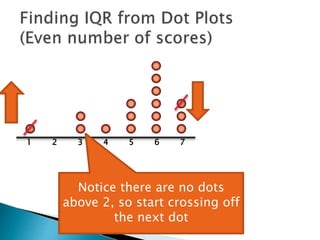
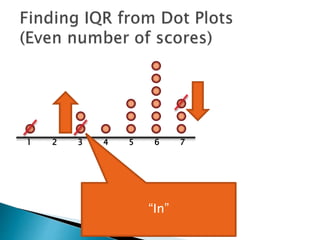
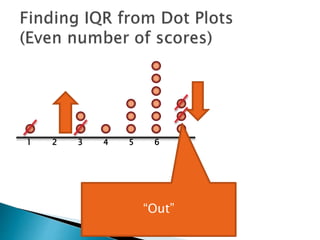
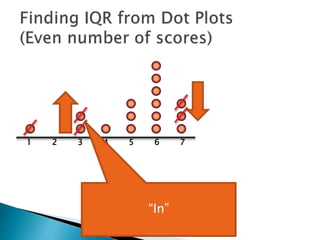
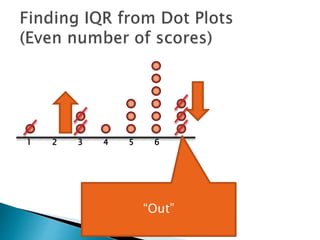
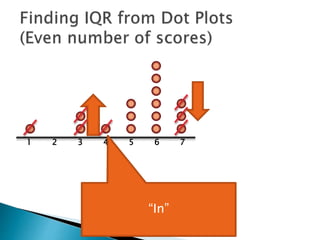
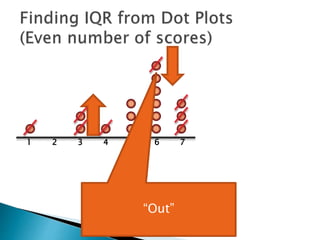
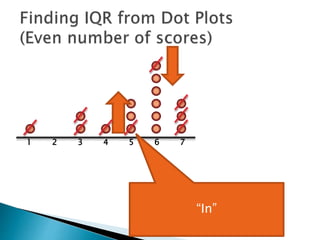
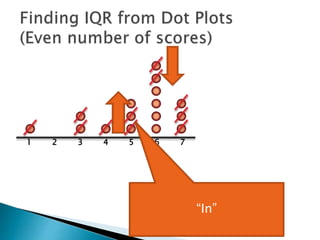
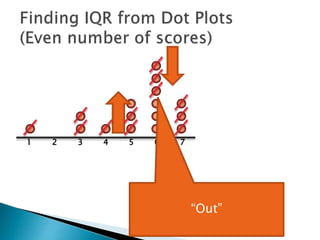
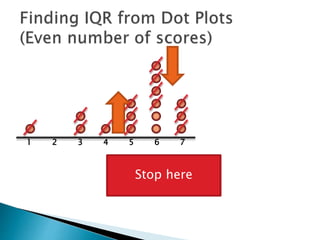
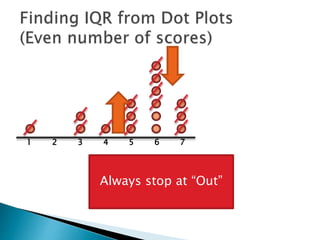
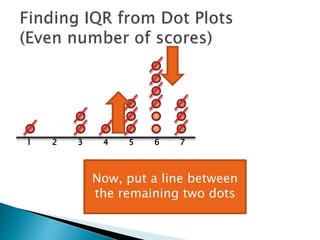
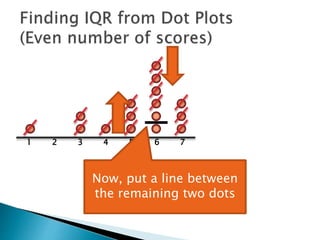
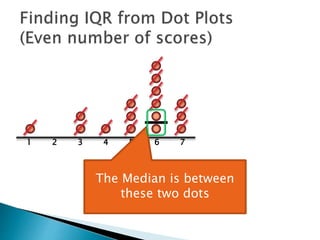
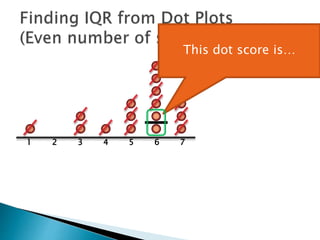
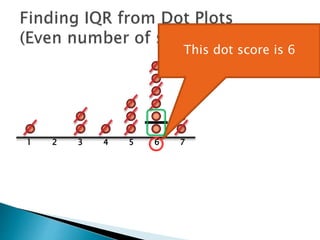
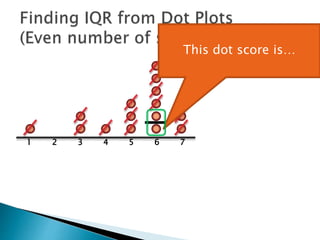
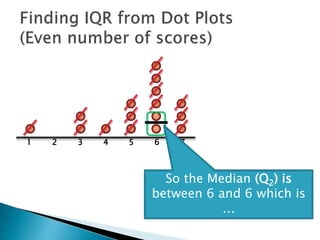
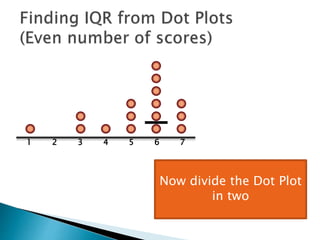
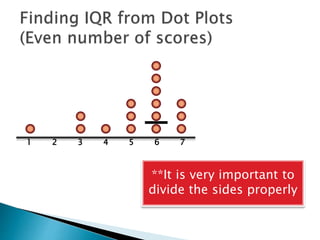
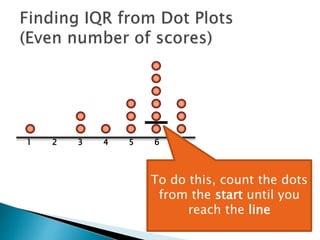
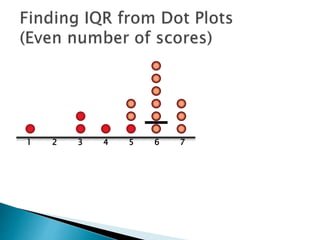
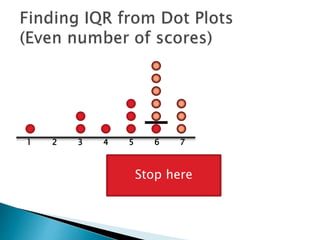
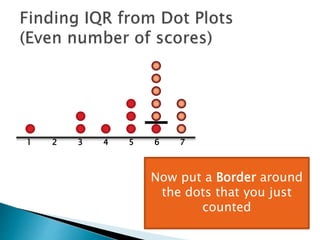
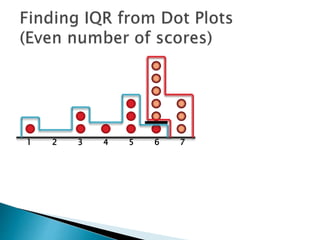
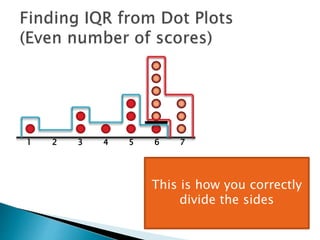
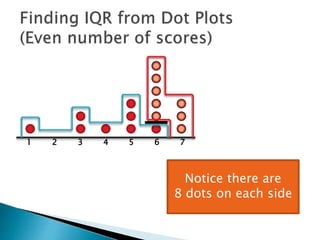
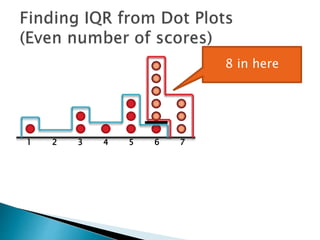
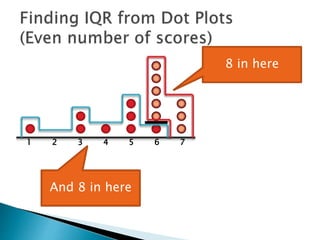
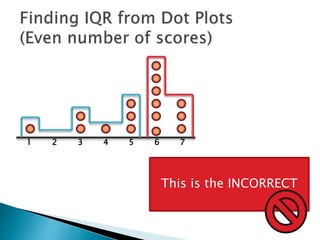
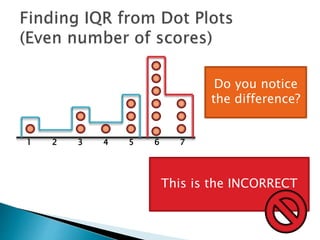
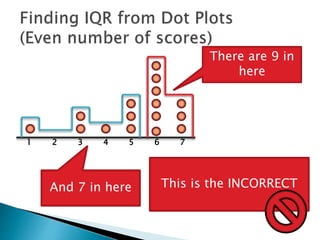
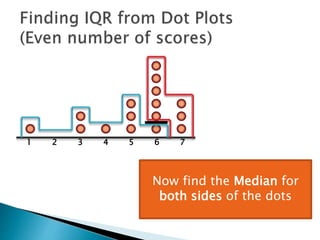
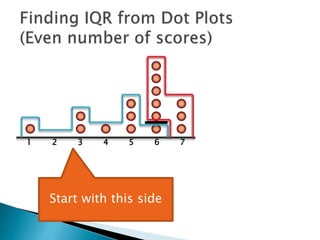
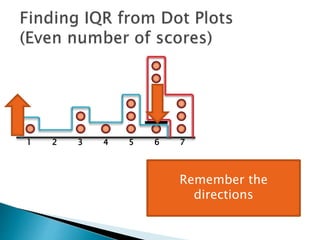
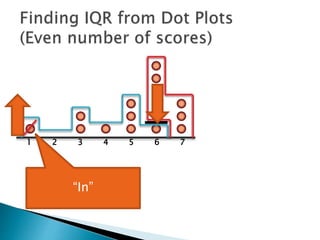
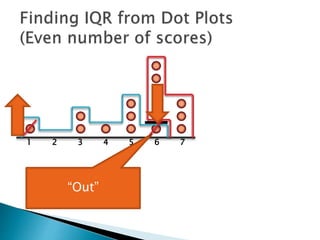
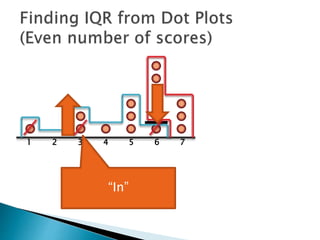
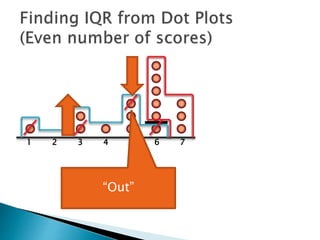
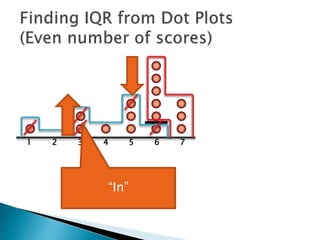
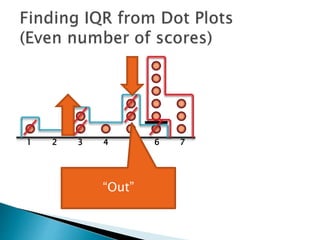
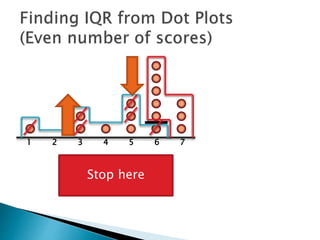
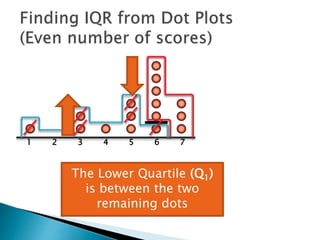
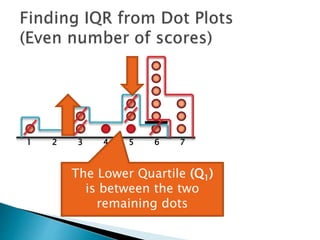
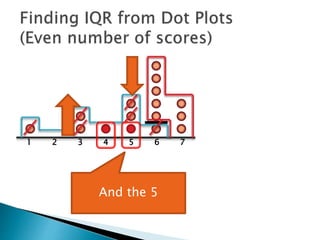
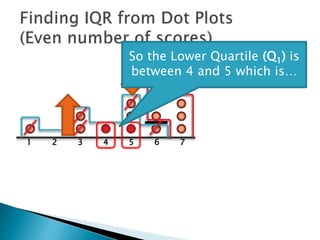
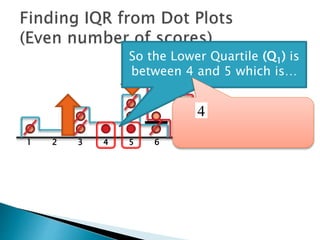
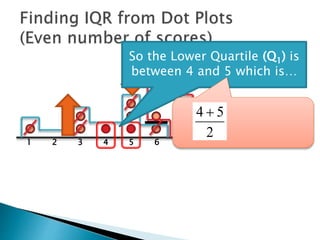
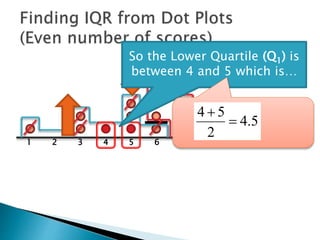
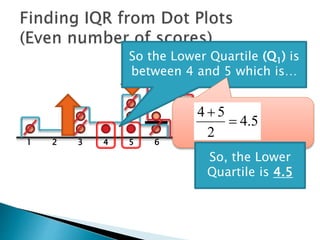
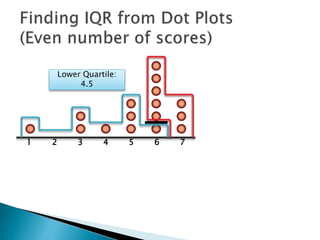
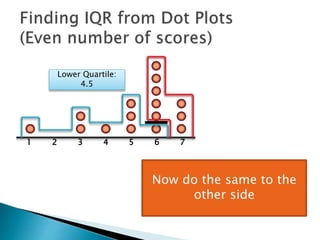
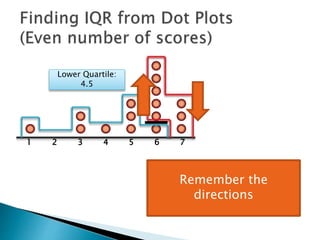
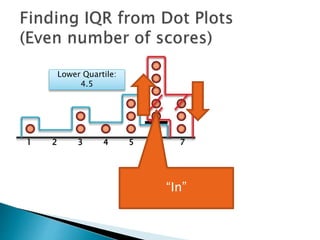
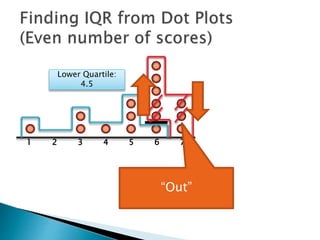
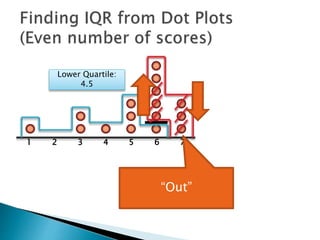
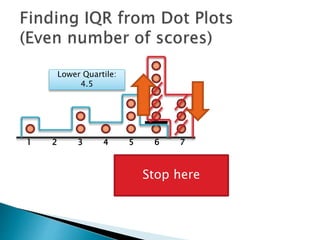
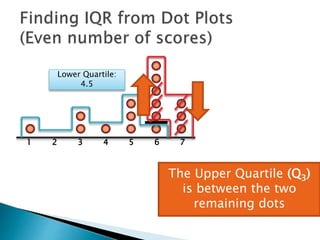
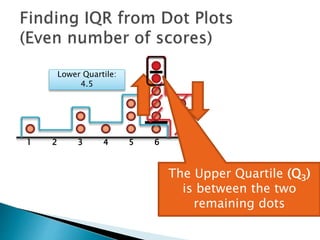
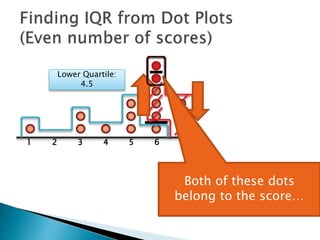
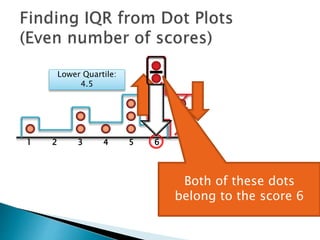
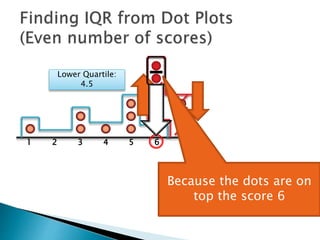
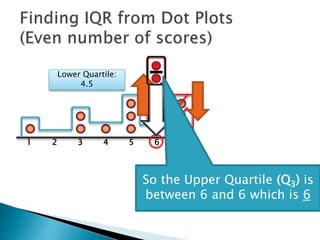
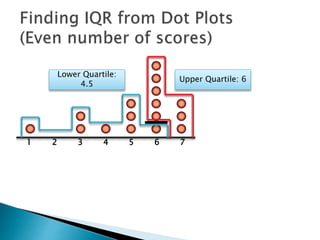
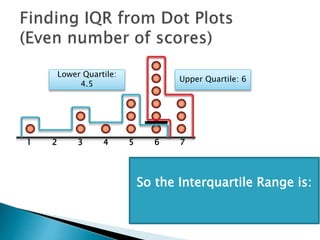
The document explains how to find the interquartile range (IQR) from a set of even-numbered scores using a dot plot. It outlines the steps for determining the median, lower quartile (Q1), upper quartile (Q3), and subsequently calculating the IQR. The final calculated IQR is 1.5.