A group ofstudents obtained the
following scores in Statistics quiz:
8, 2, 5, 4, 8, 5, 7, 1, 3, 6
ACTIVITY 1
4.
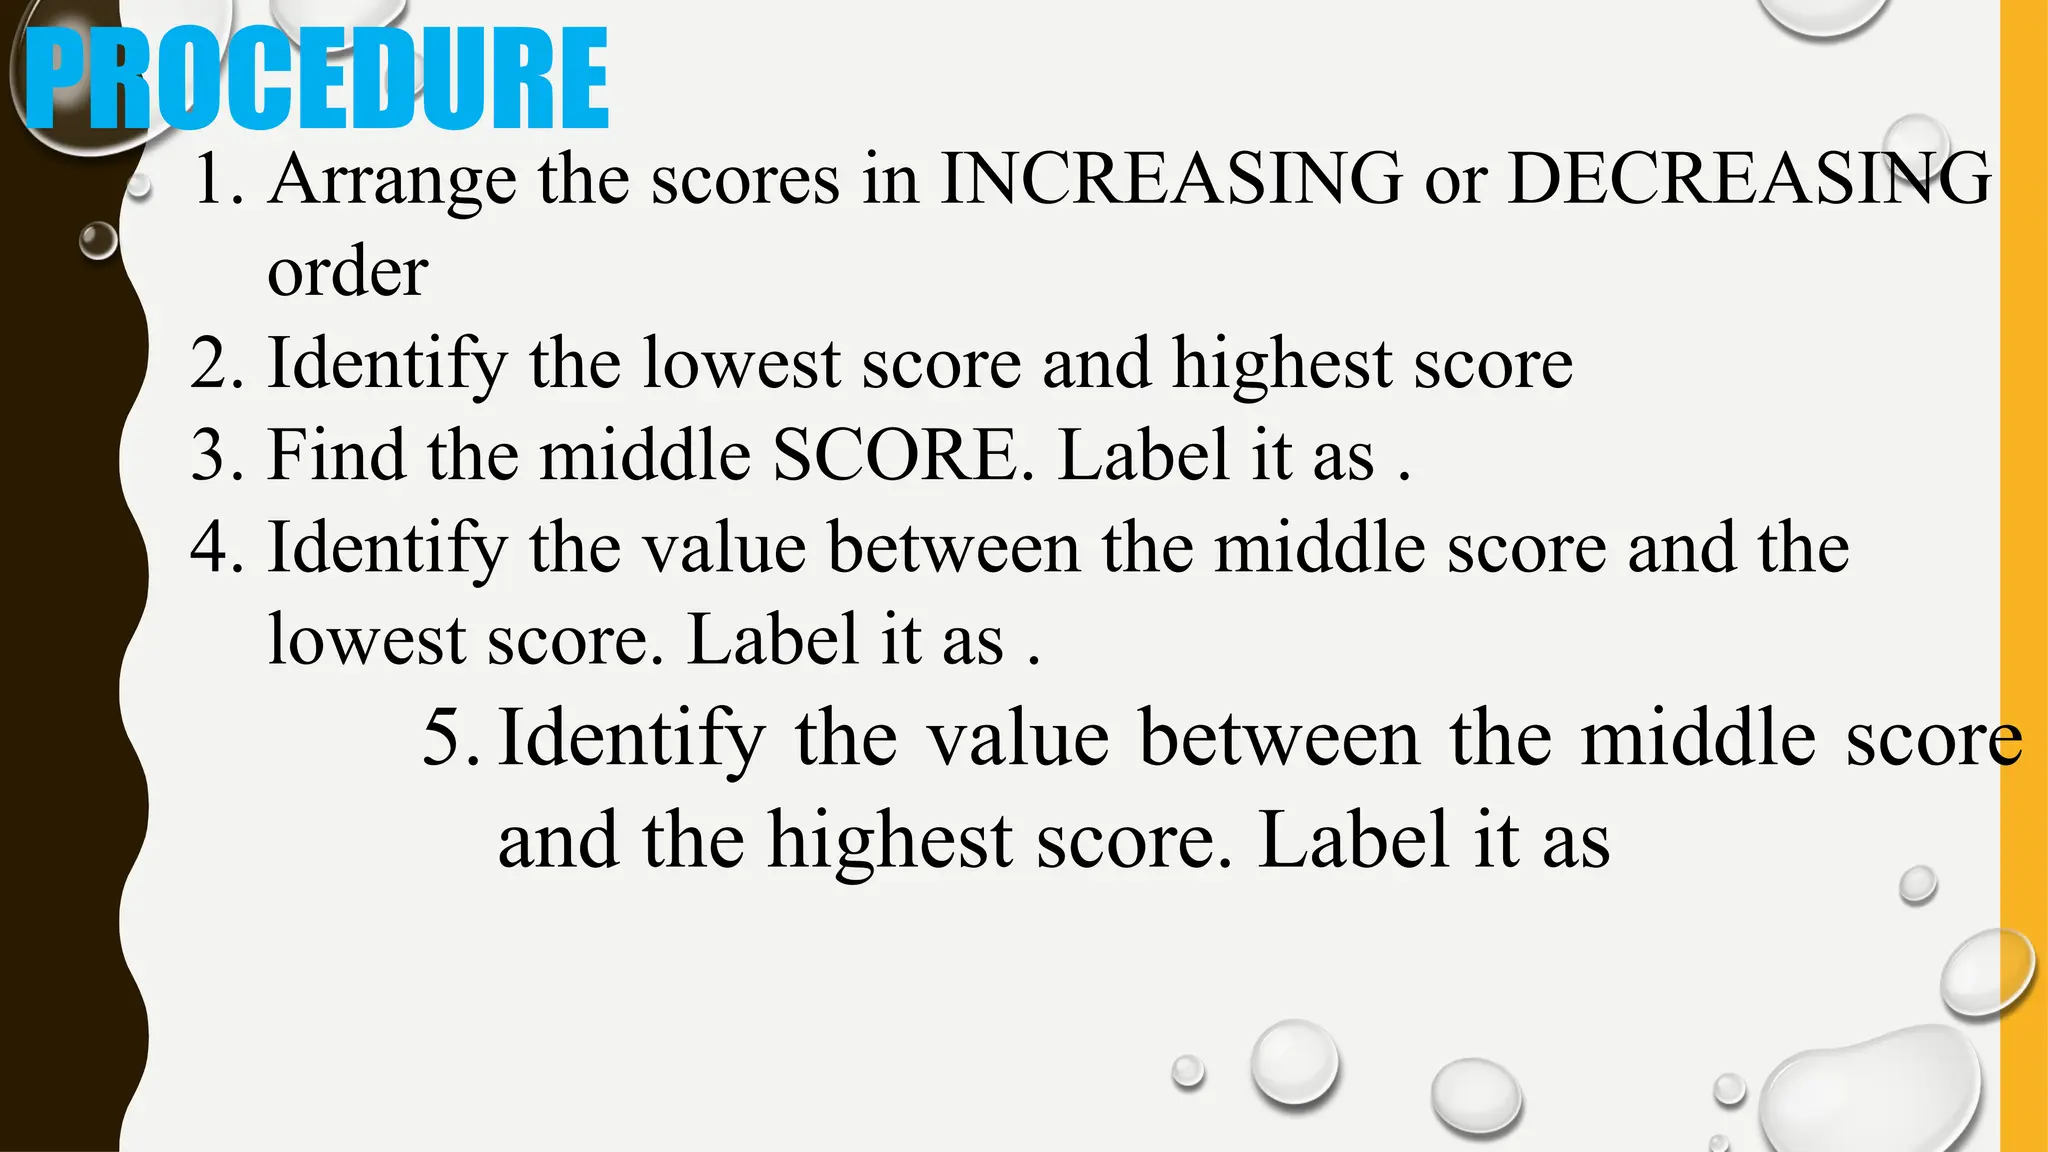
PROCEDURE
1. Arrange thescores in INCREASING or DECREASING
order
2. Identify the lowest score and highest score
3. Find the middle SCORE. Label it as .
4. Identify the value between the middle score and the
lowest score. Label it as .
5. Identify the value between the middle score
and the highest score. Label it as
5.
Guide questions:
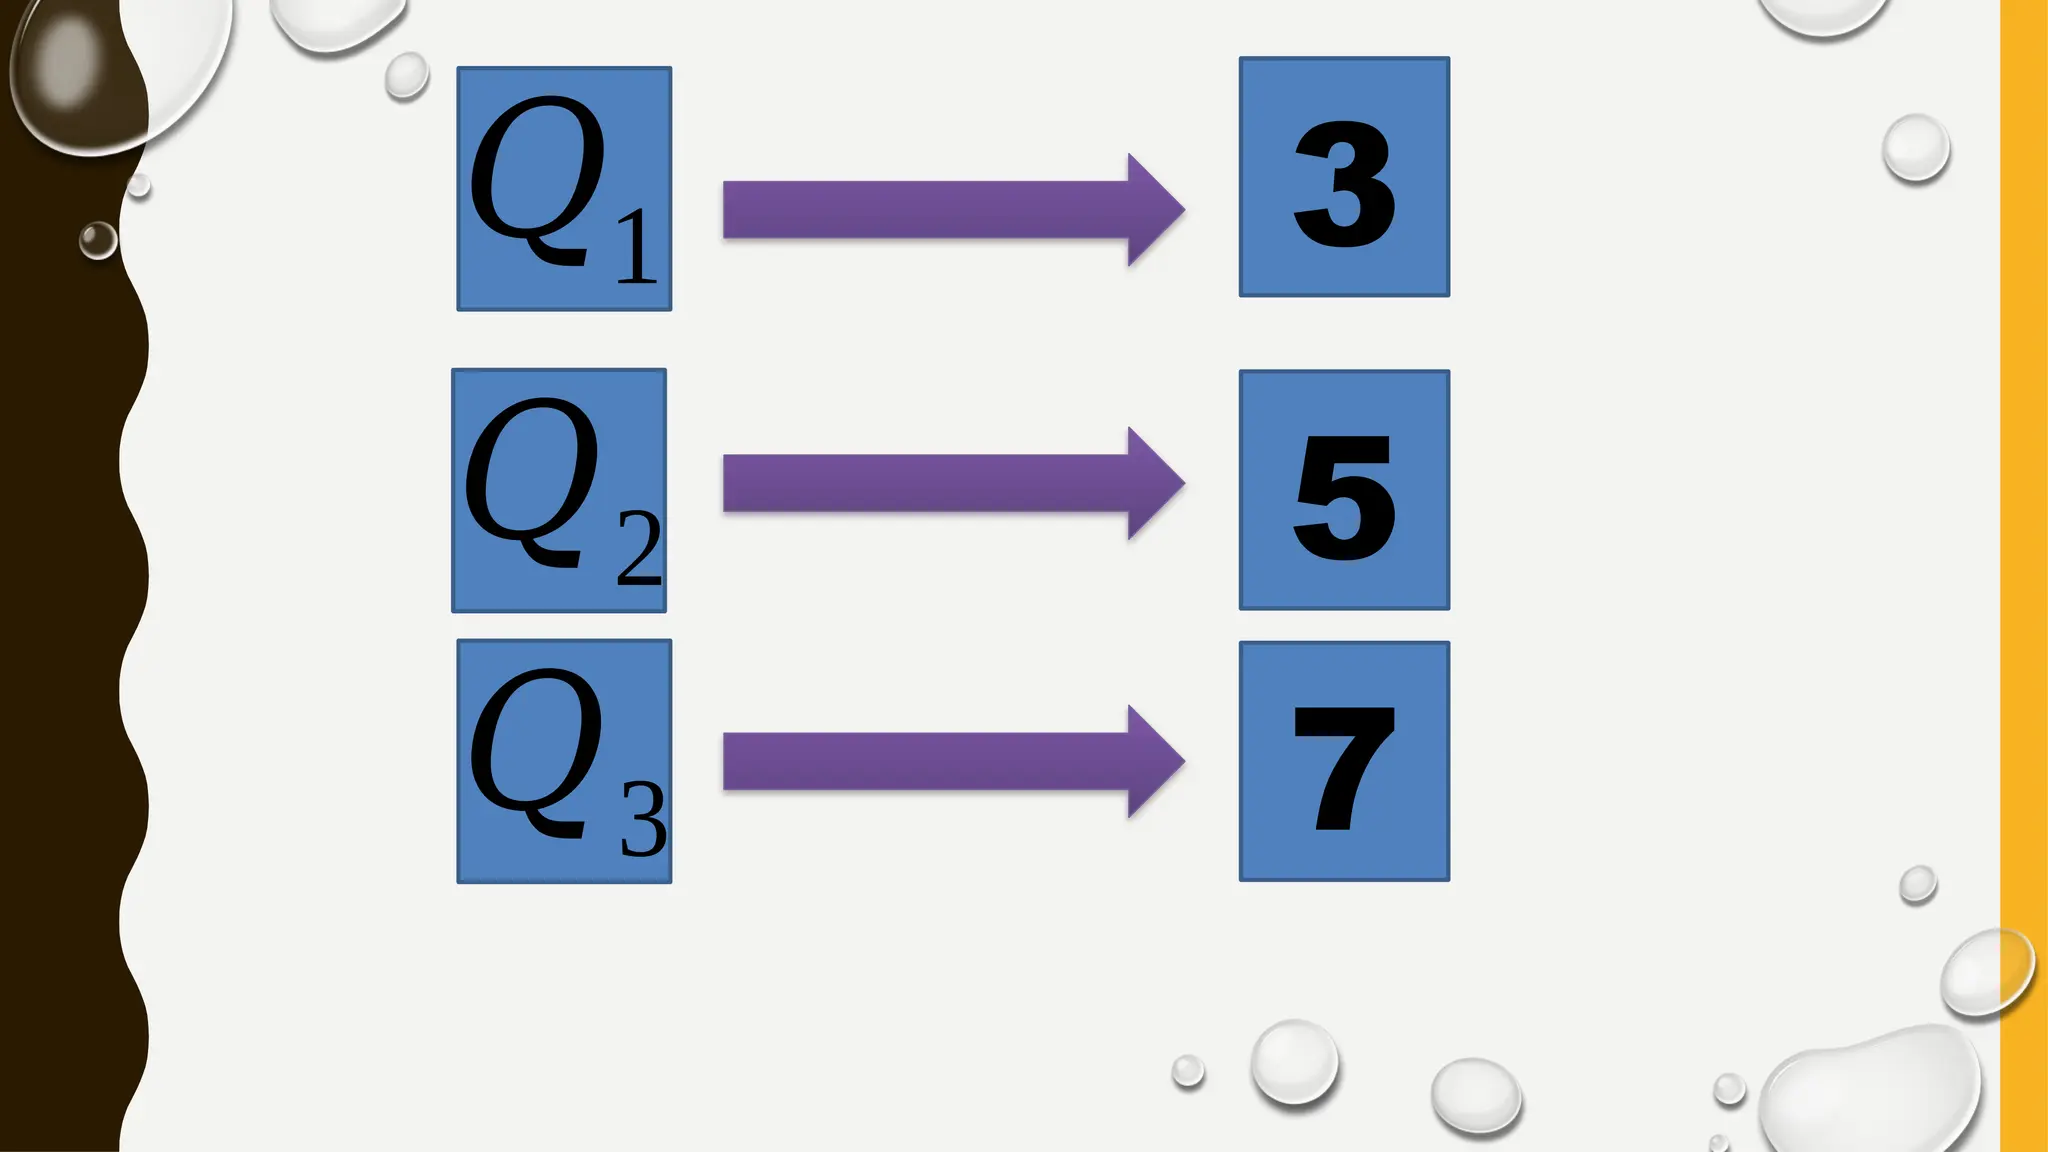
1. Whatis , , and of their scores?
2. How many students belong to , , and in terms
of their scores?
3. Have you realize of finding the position of the
scores?
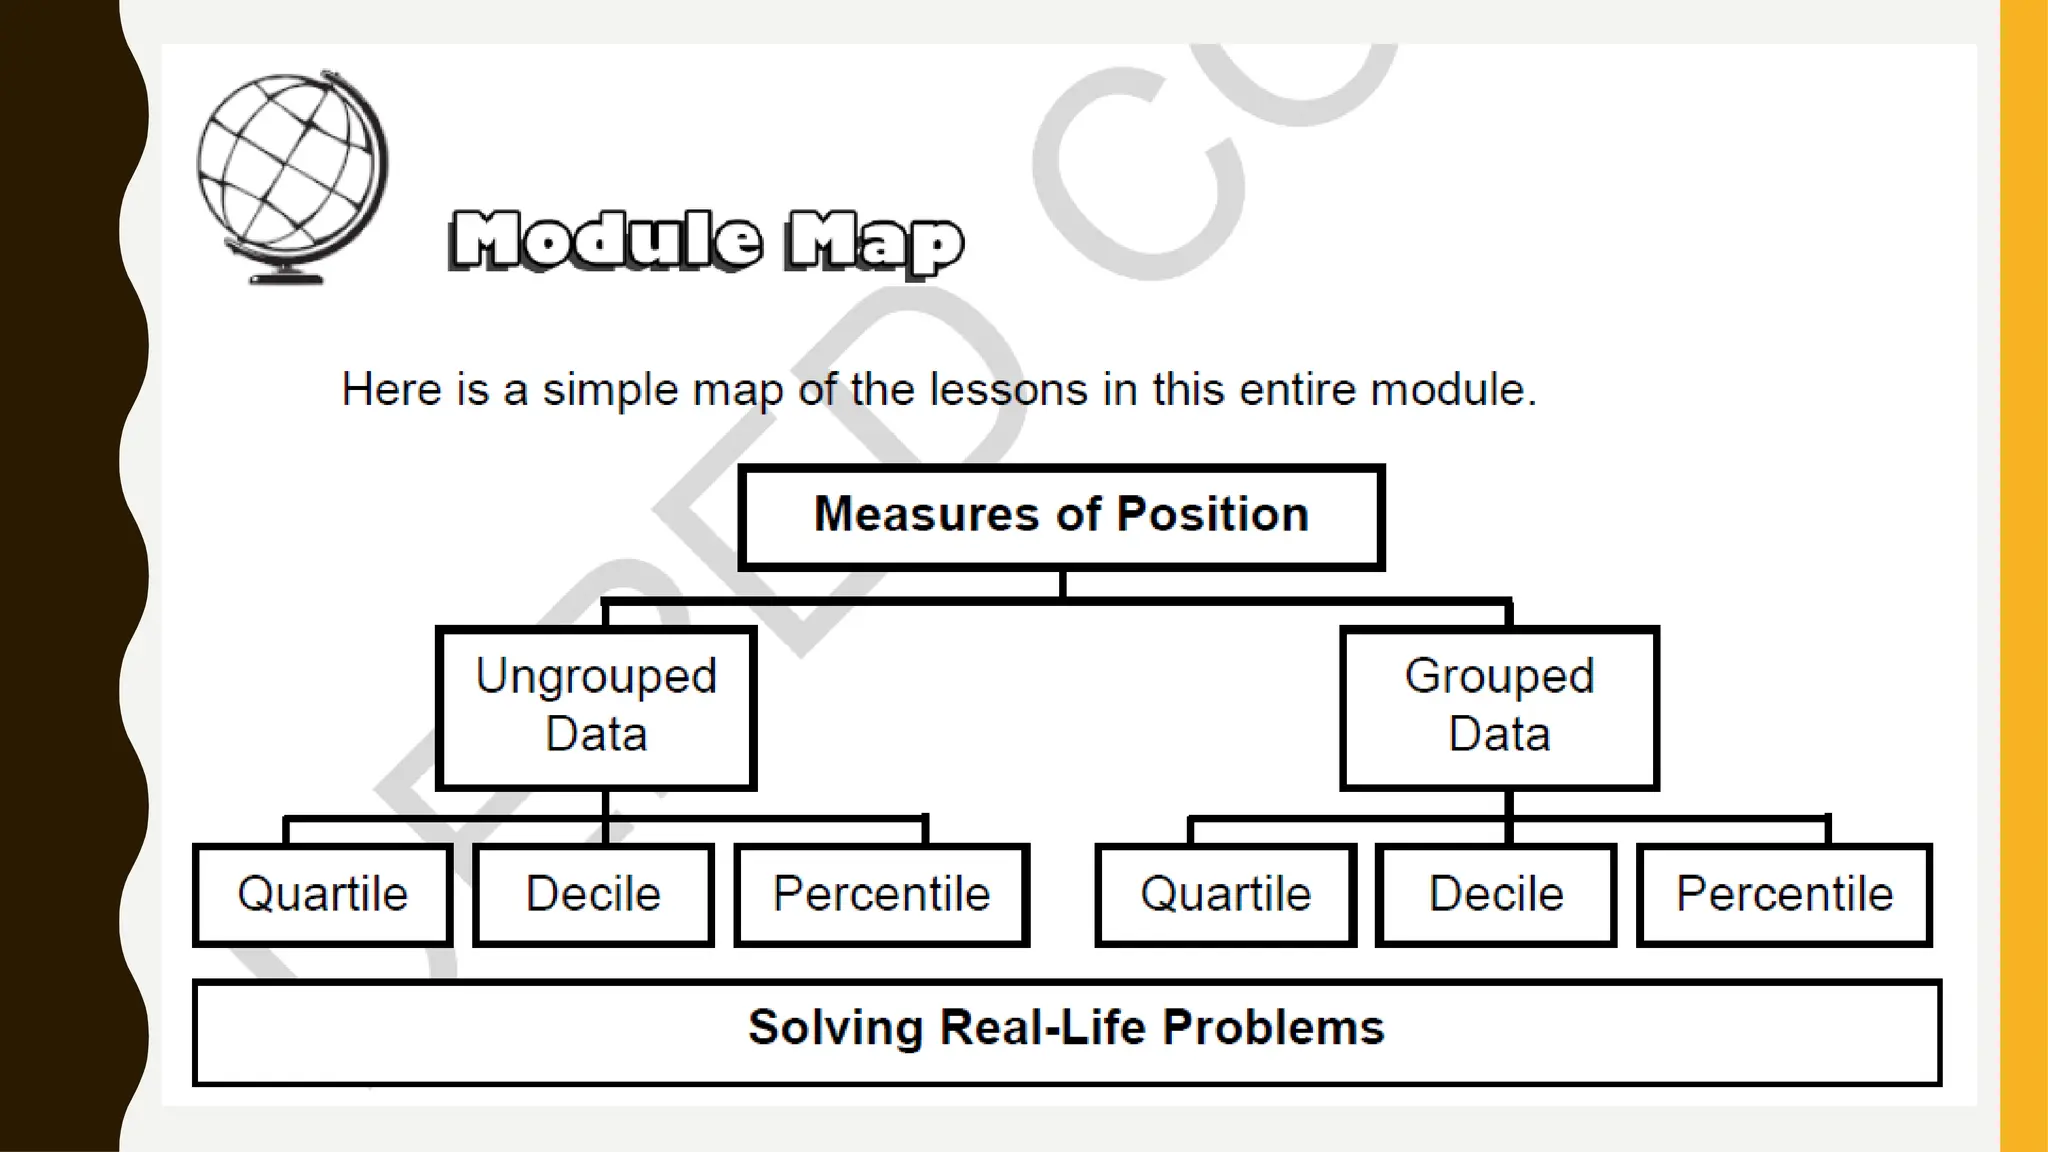
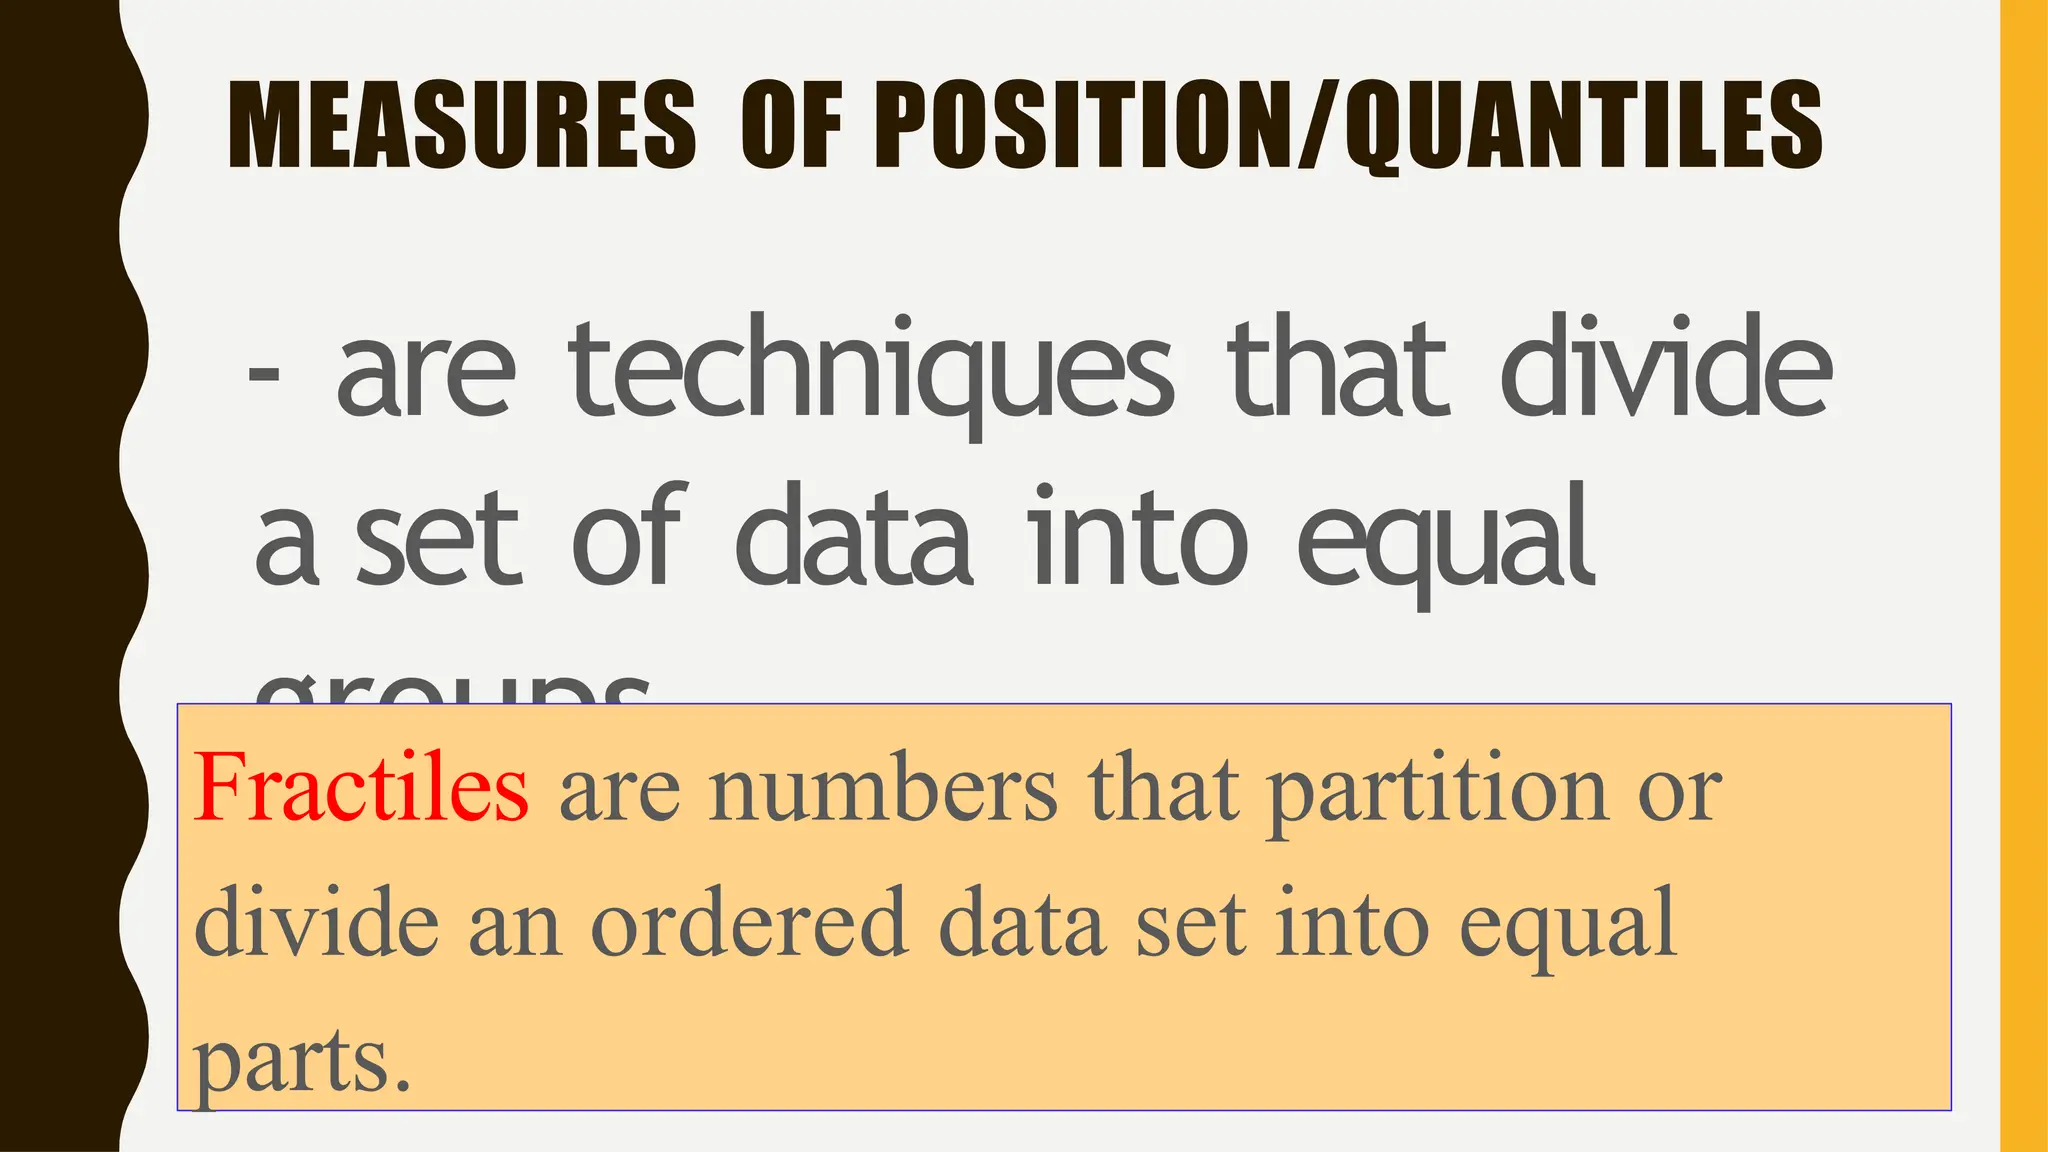
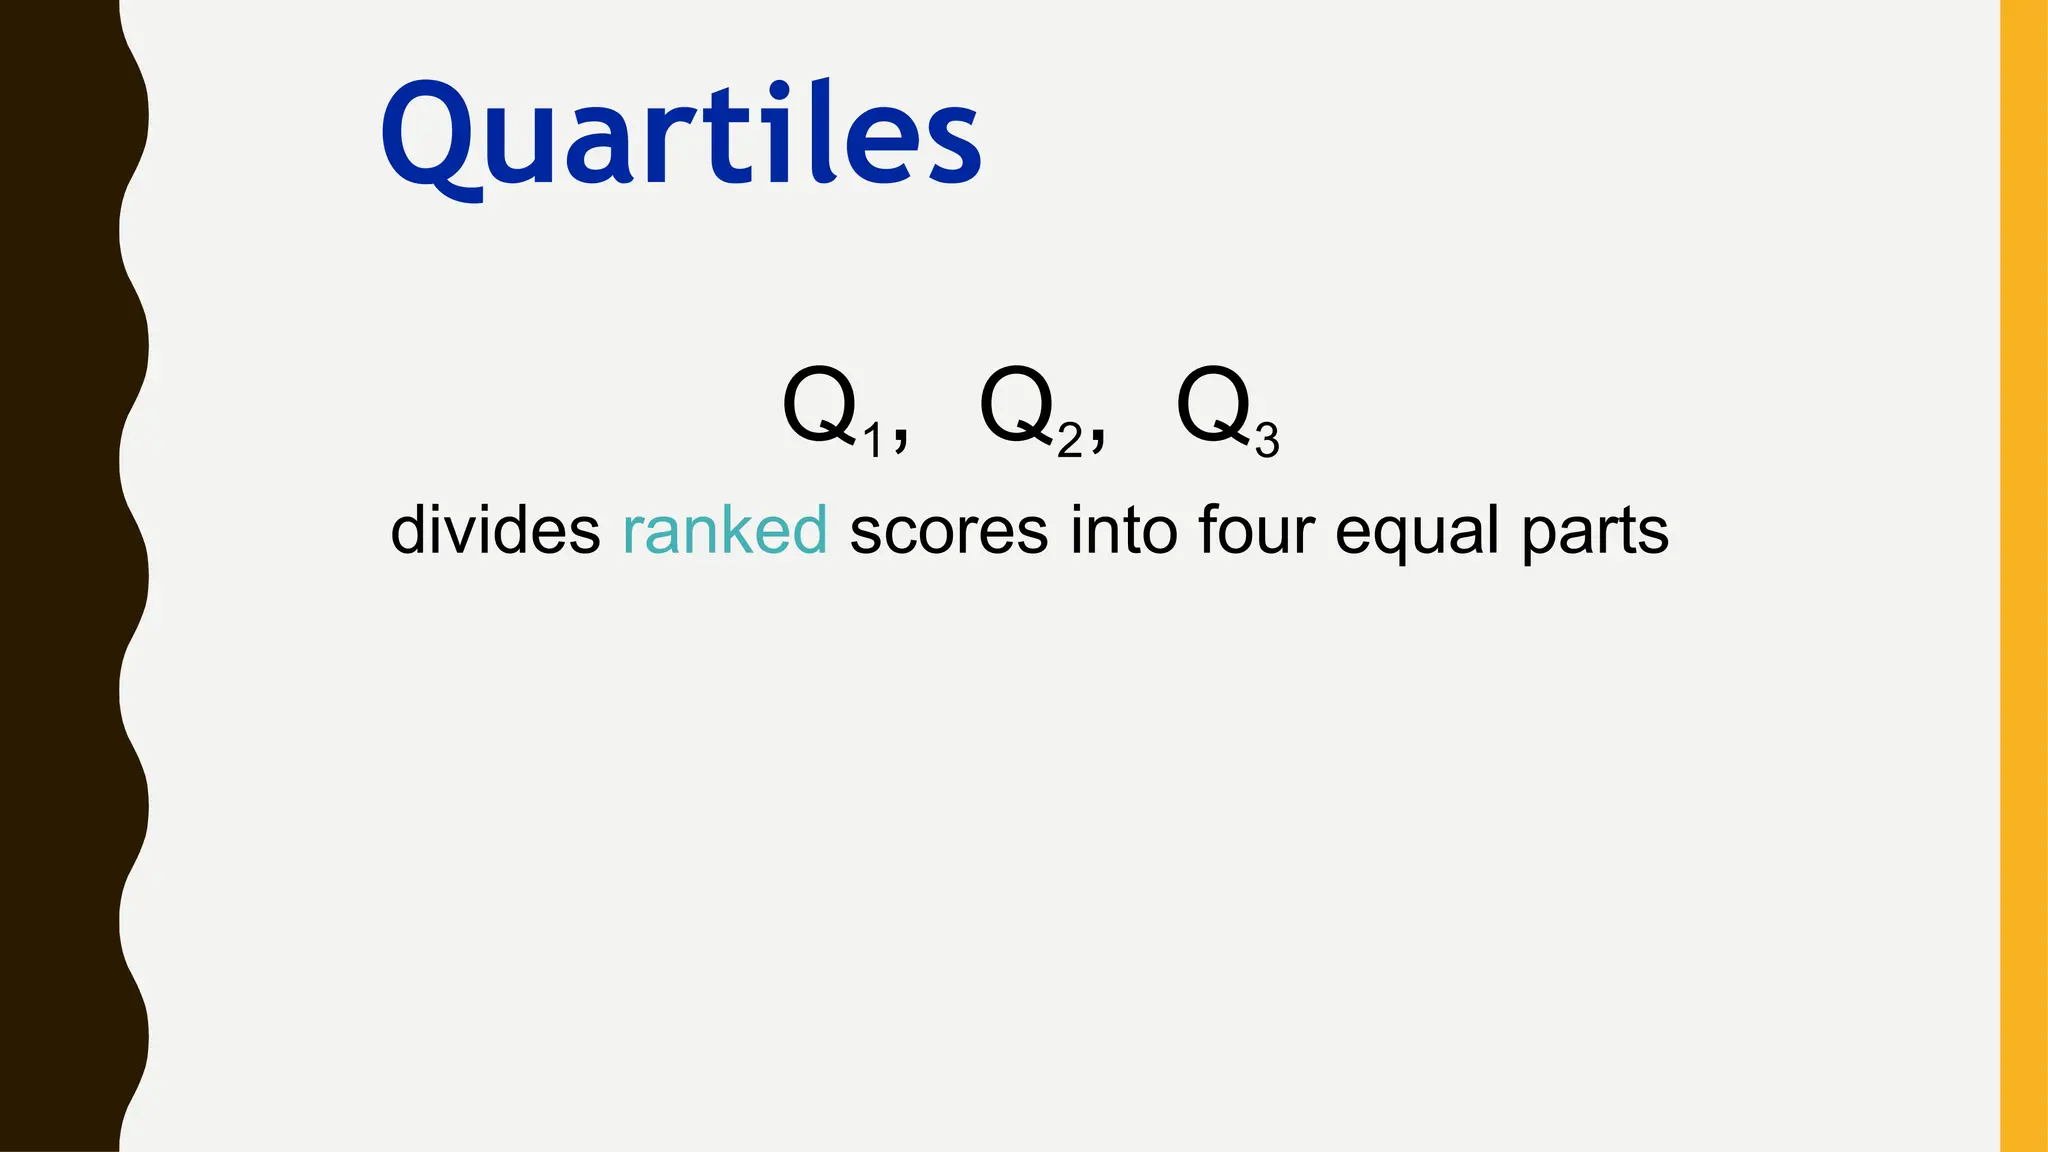
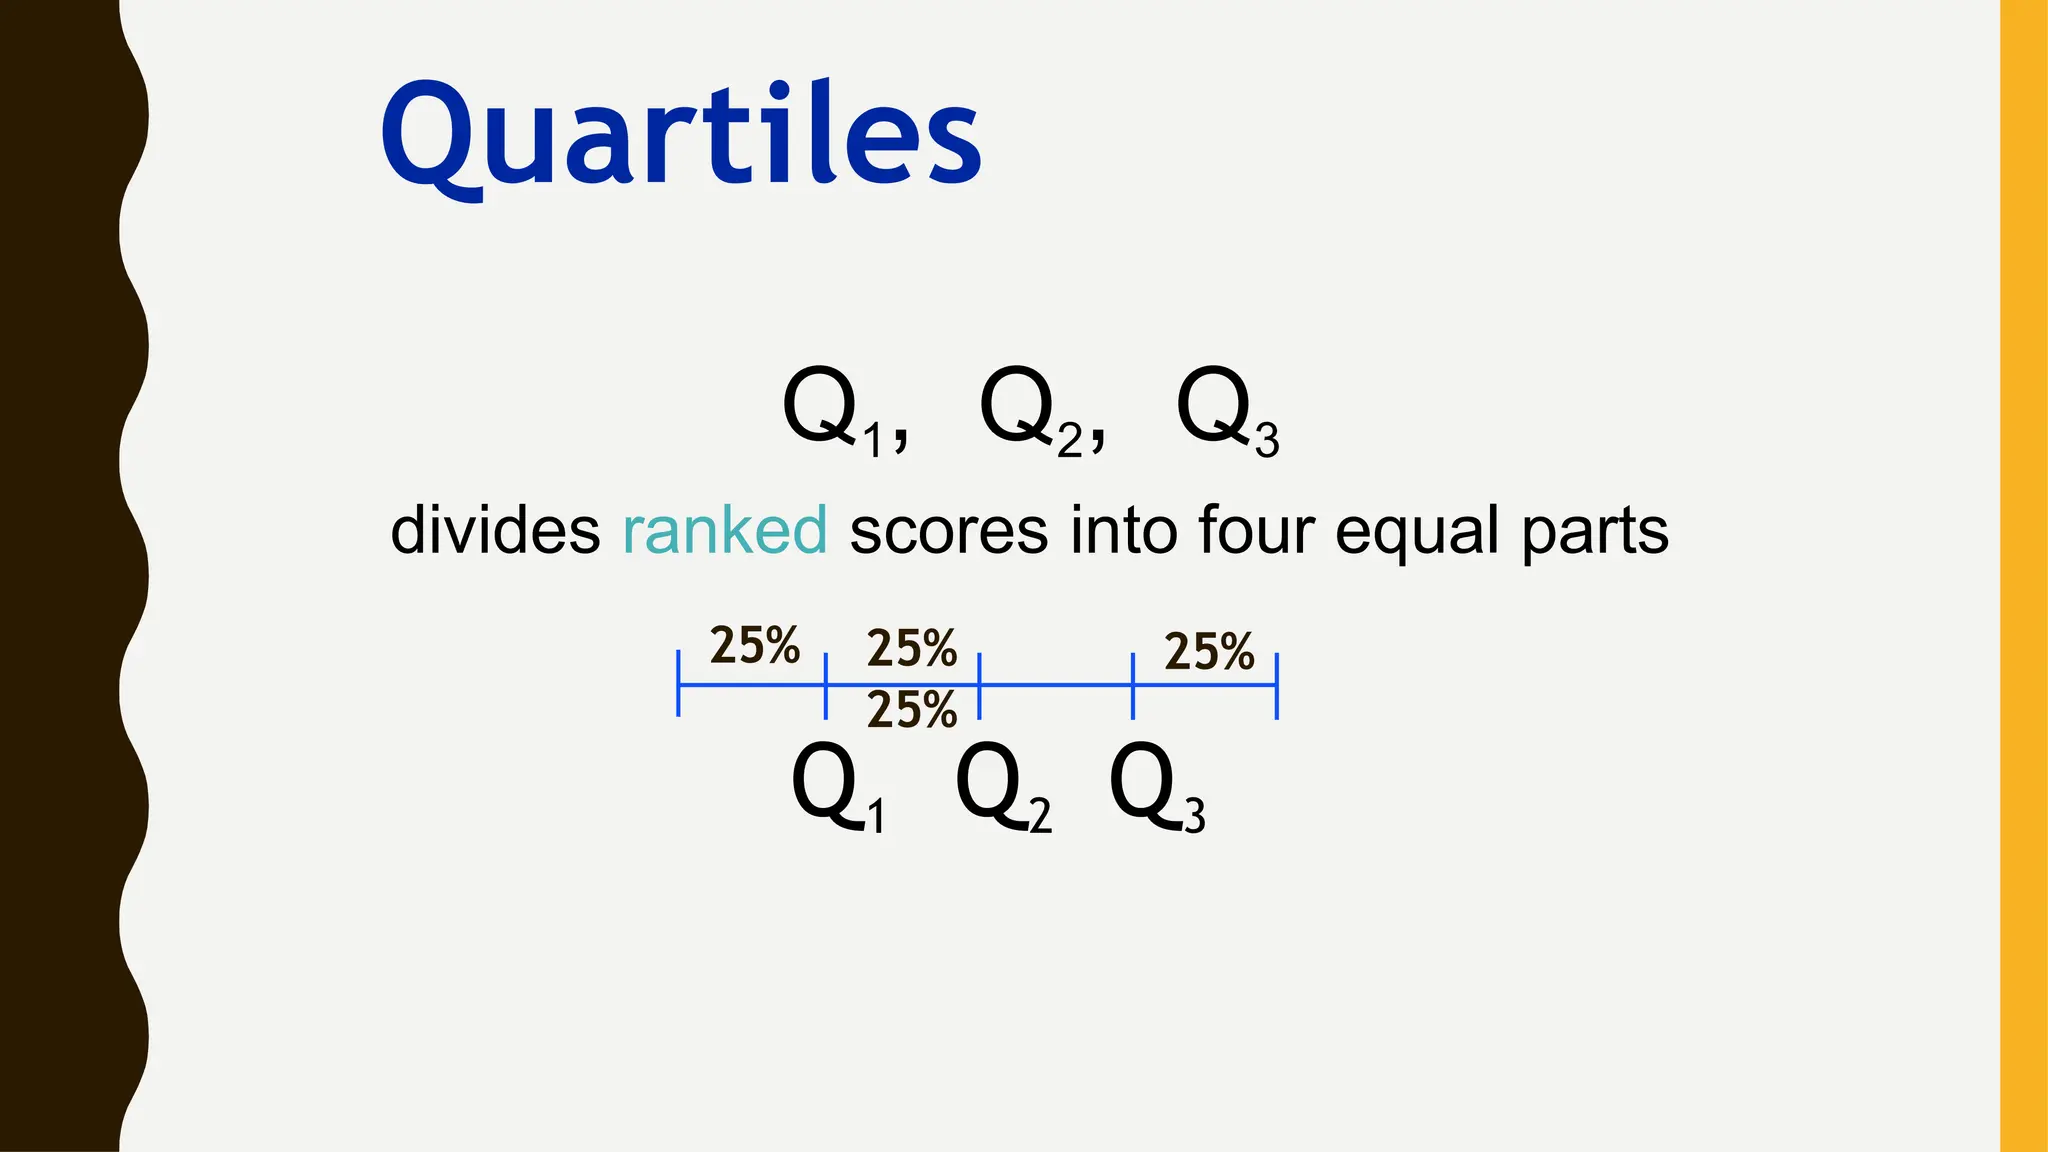
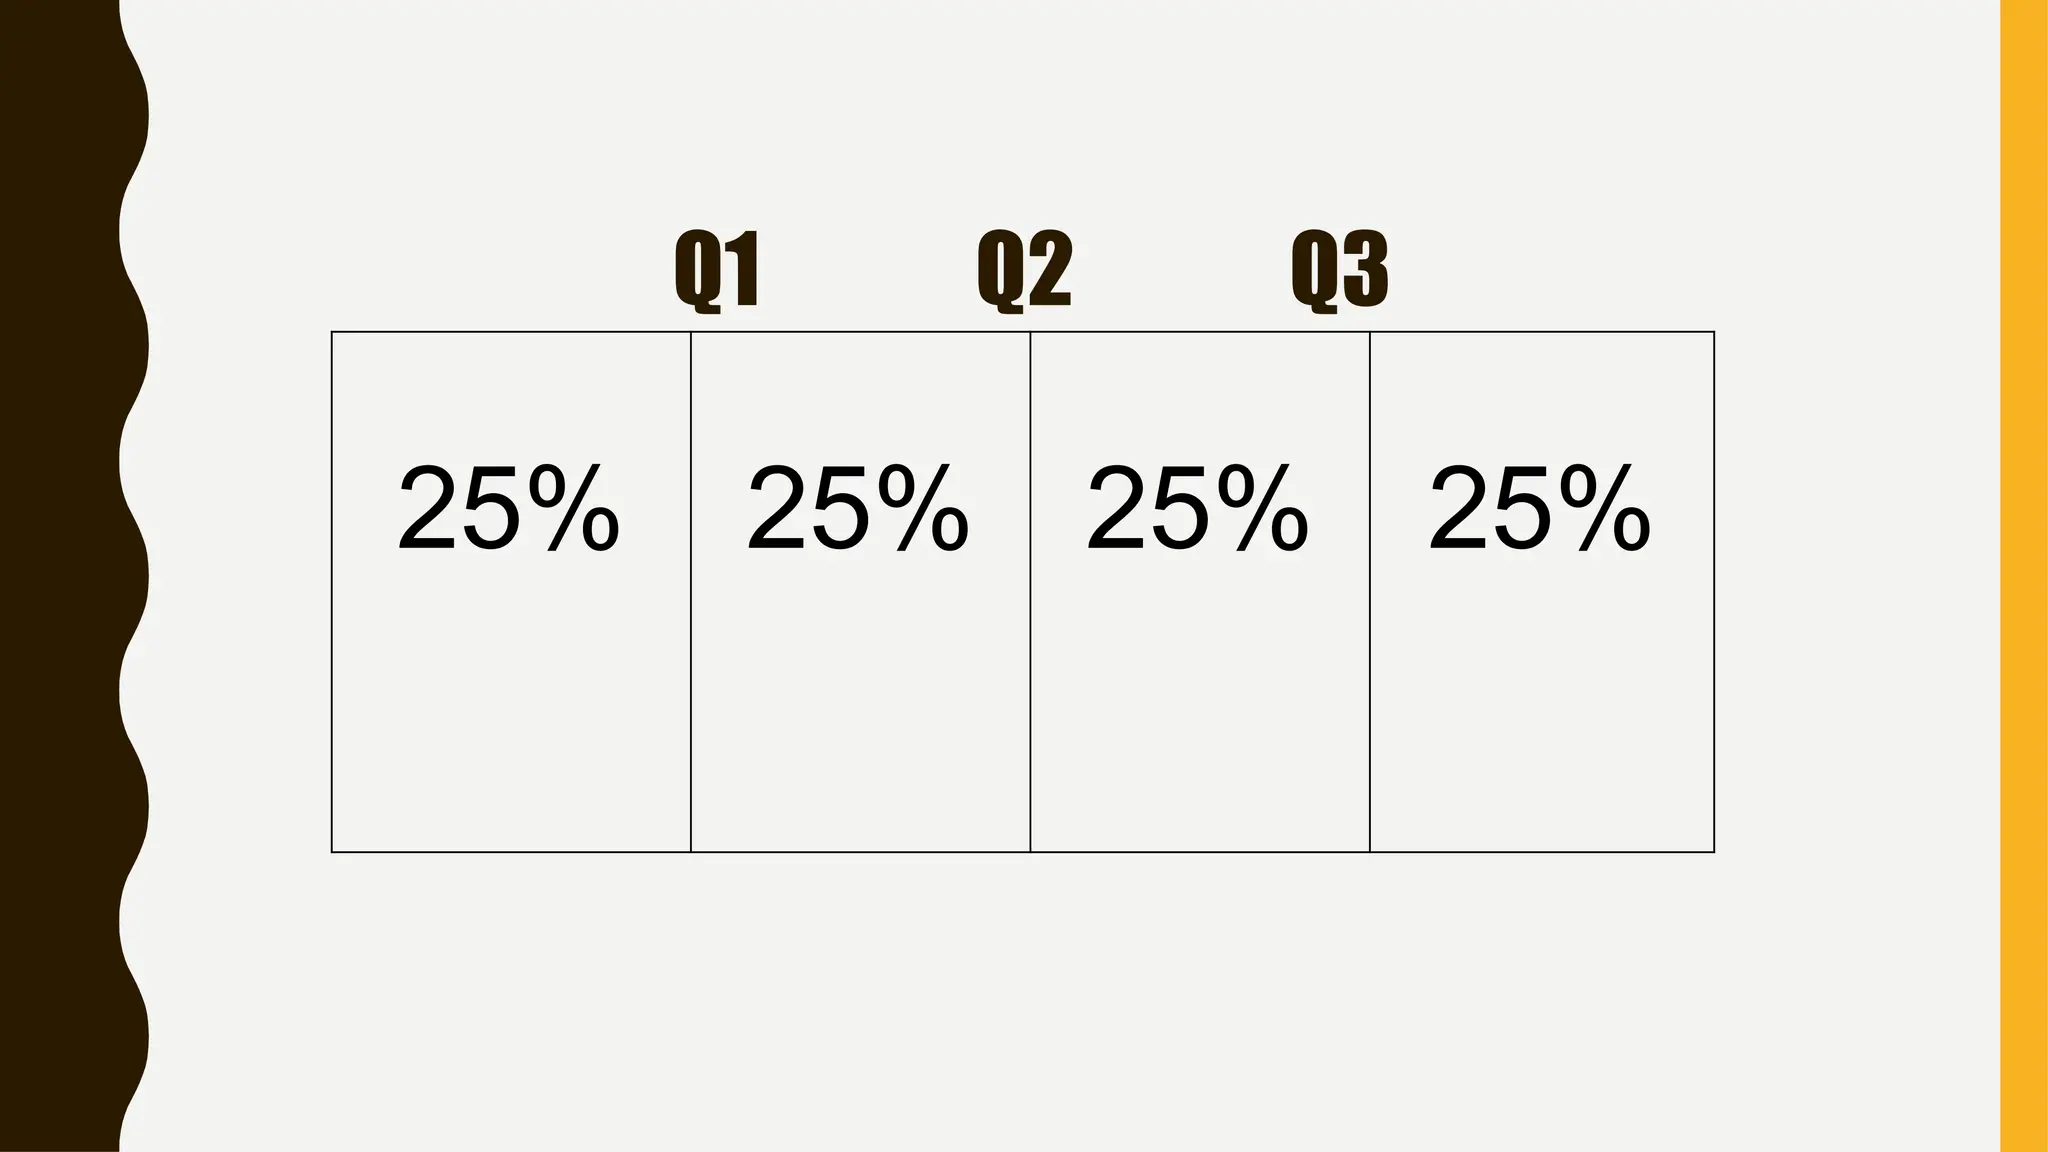
MEASURES OF POSITION/QUANTILES
-are techniques that divide
a set of data into equal
groups
Fractiles are numbers that partition or
divide an ordered data set into equal
parts.
10.
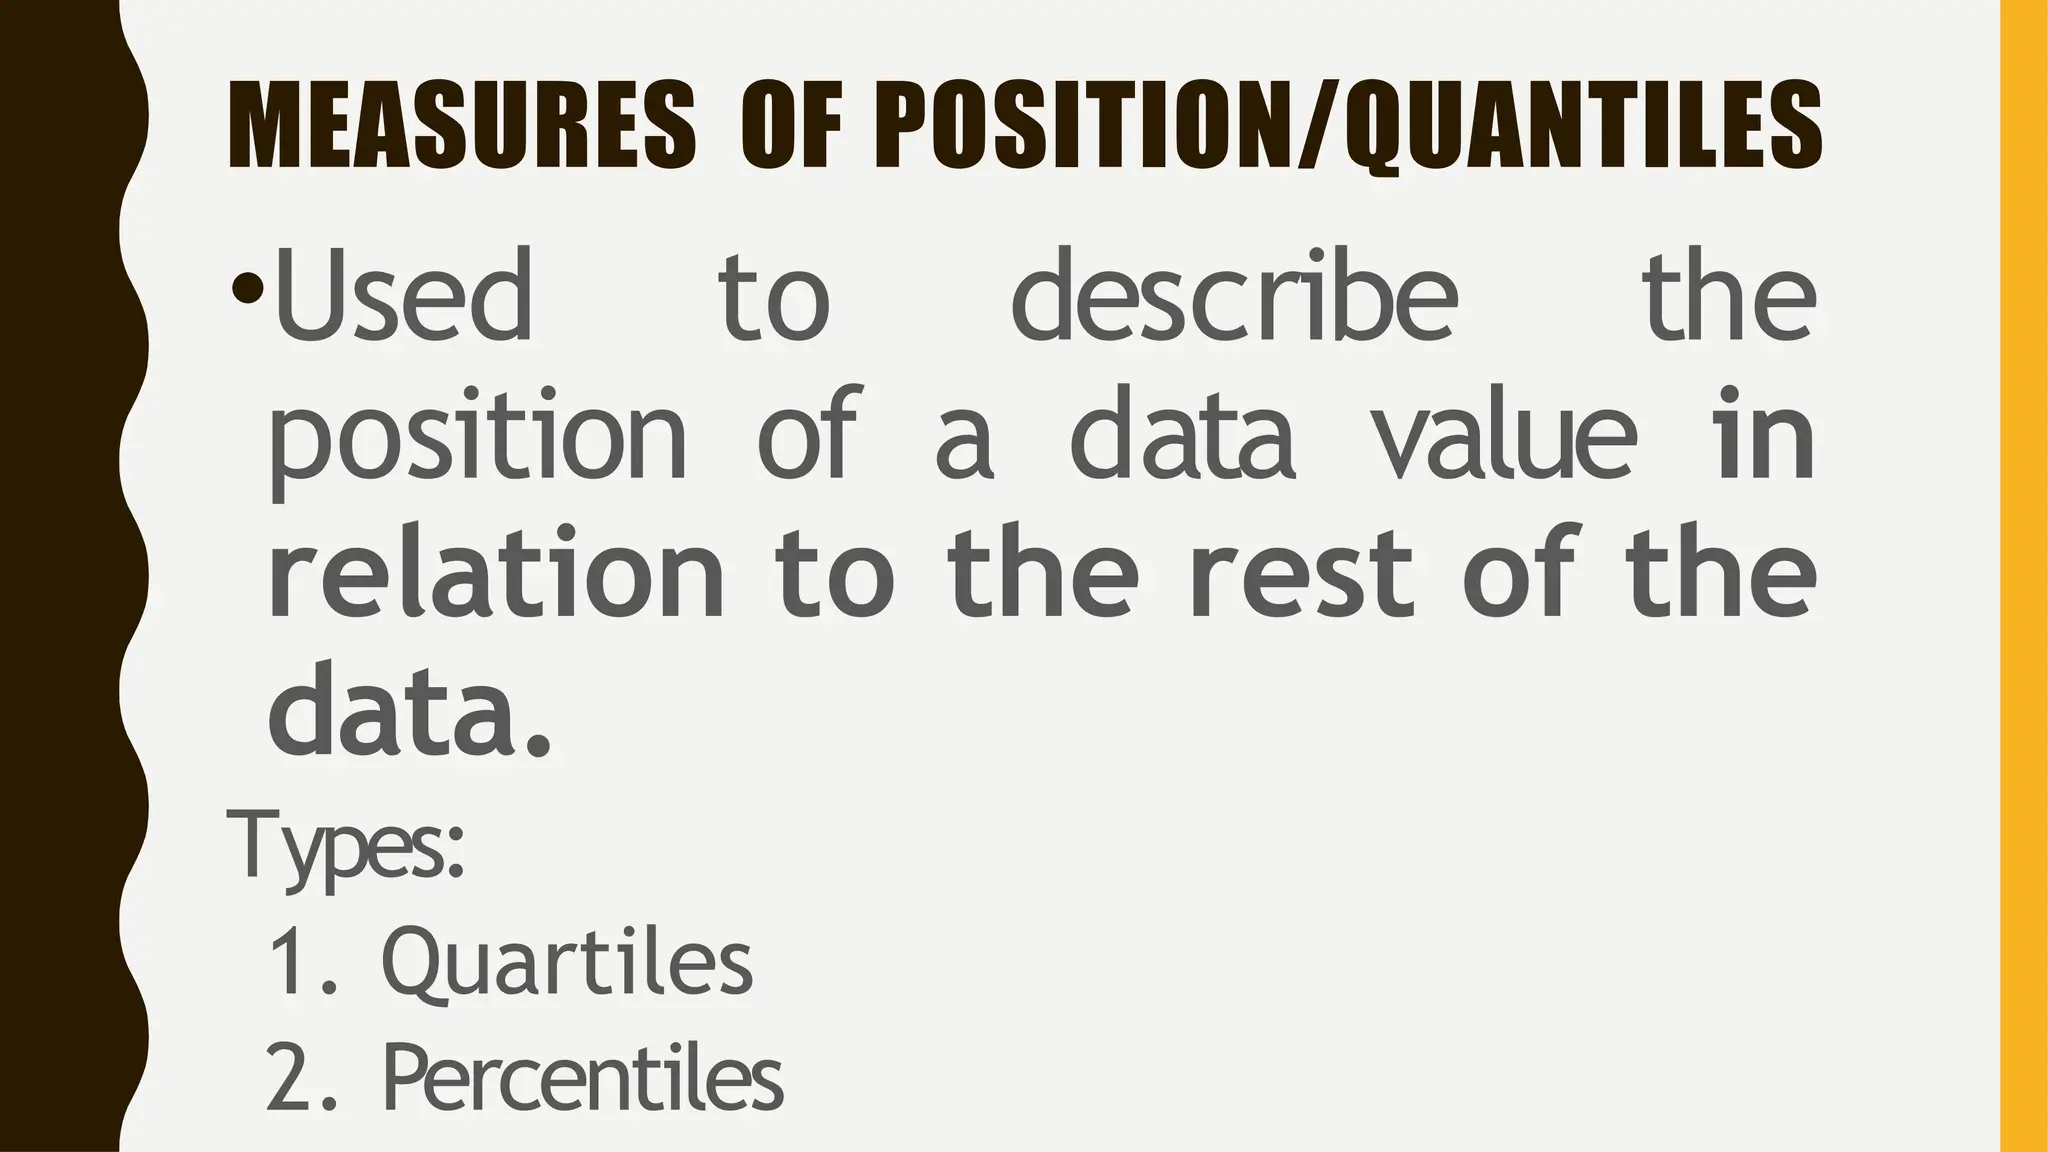
MEASURES OF POSITION/QUANTILES
•Usedto describe the
position of a data value in
relation to the rest of the
data.
Types:
1. Quartiles
2. Percentiles
11.
QUANTILES CAN BEAPPLIED WHEN:
•Dealing with large amount of data, which
includes the timely results for
standardized tests in schools, etc.
•Trying to discover the smallest as well as
the largest values in a given distribution.
•Examining financial fields for academic as
well as statistical studies.
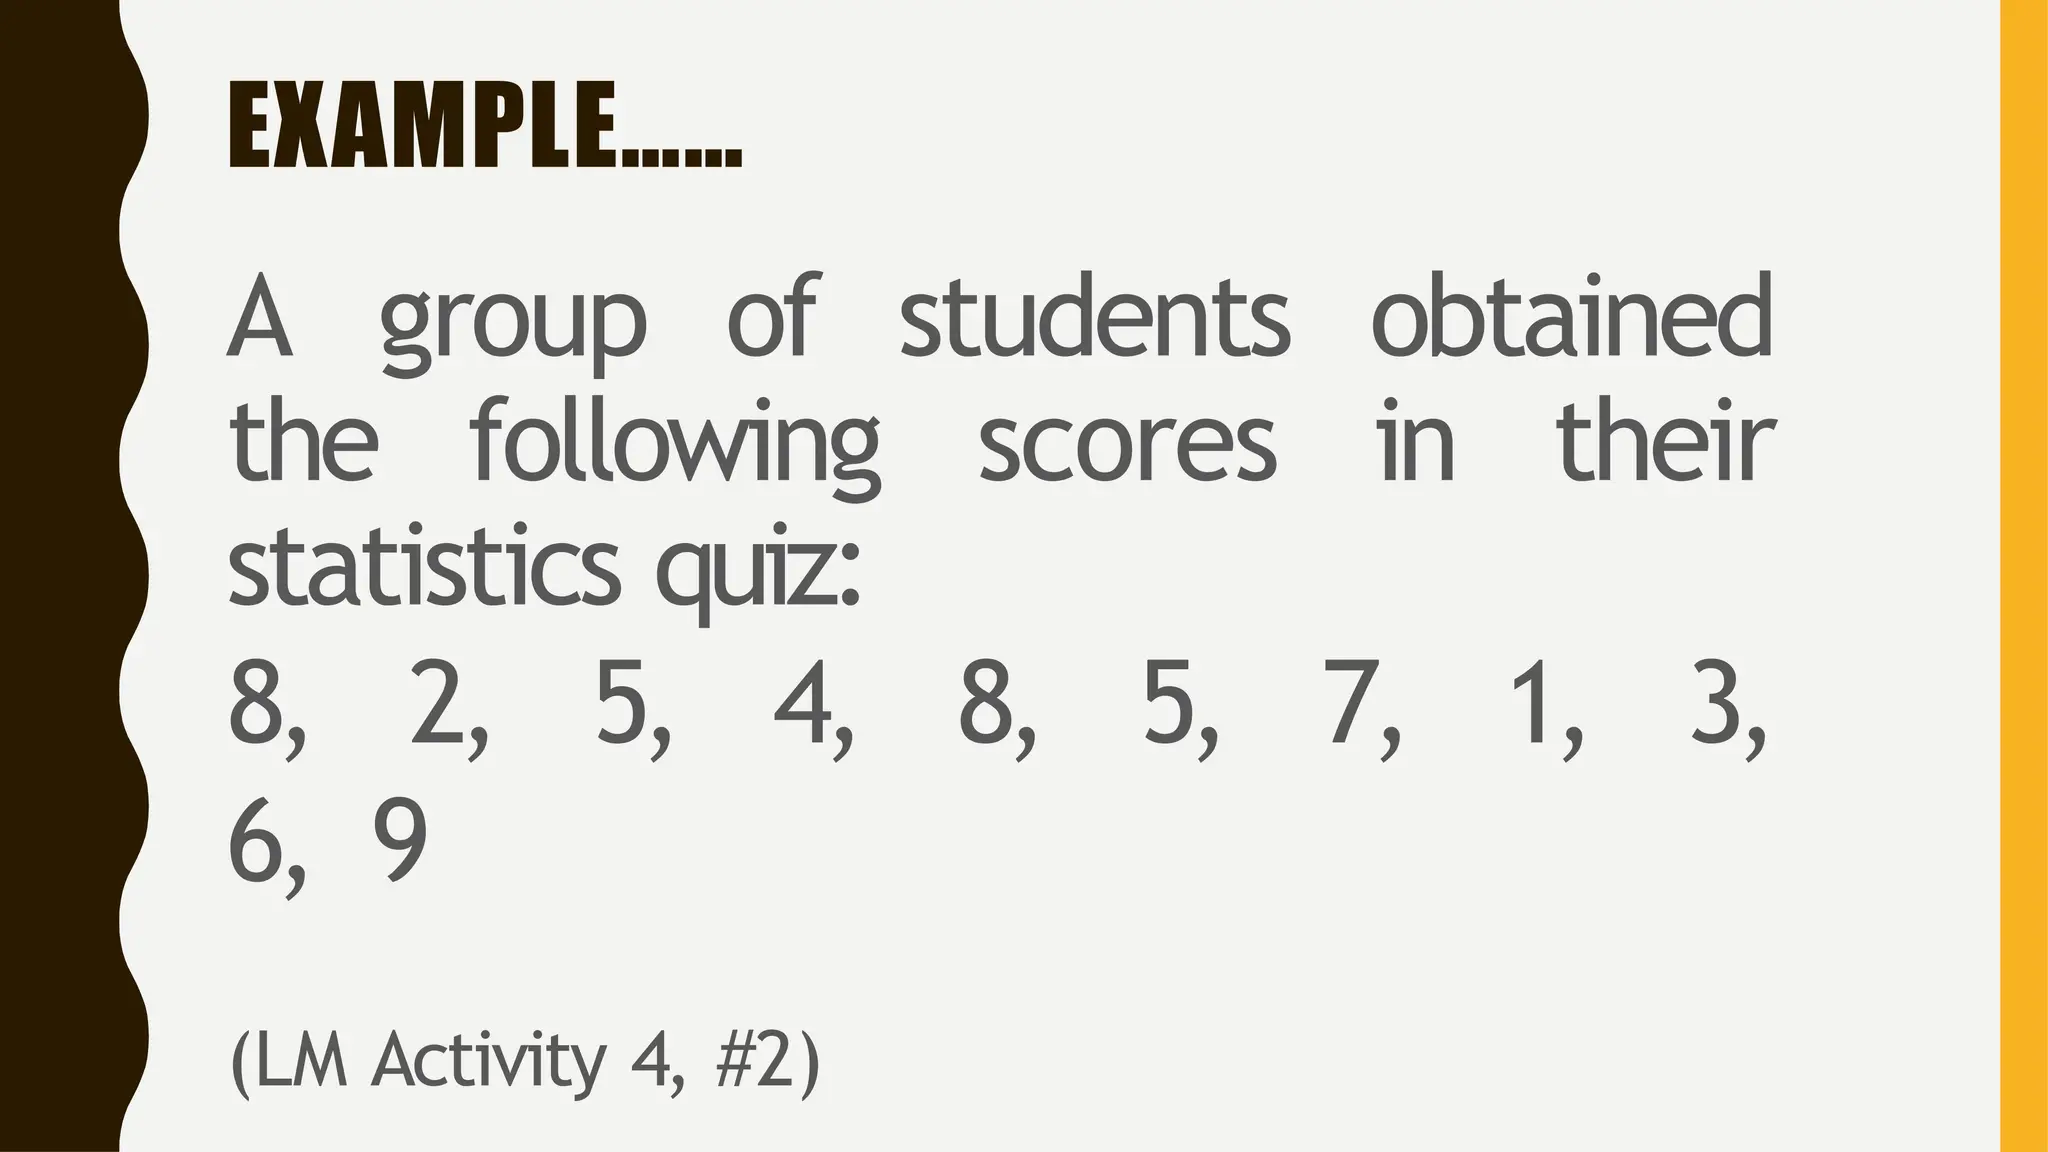
EXAMPLE……
A group ofstudents obtained
the following scores in their
statistics quiz:
8, 2, 5, 4, 8, 5, 7, 1, 3,
6, 9
(LM Activity 4, #2)
24.
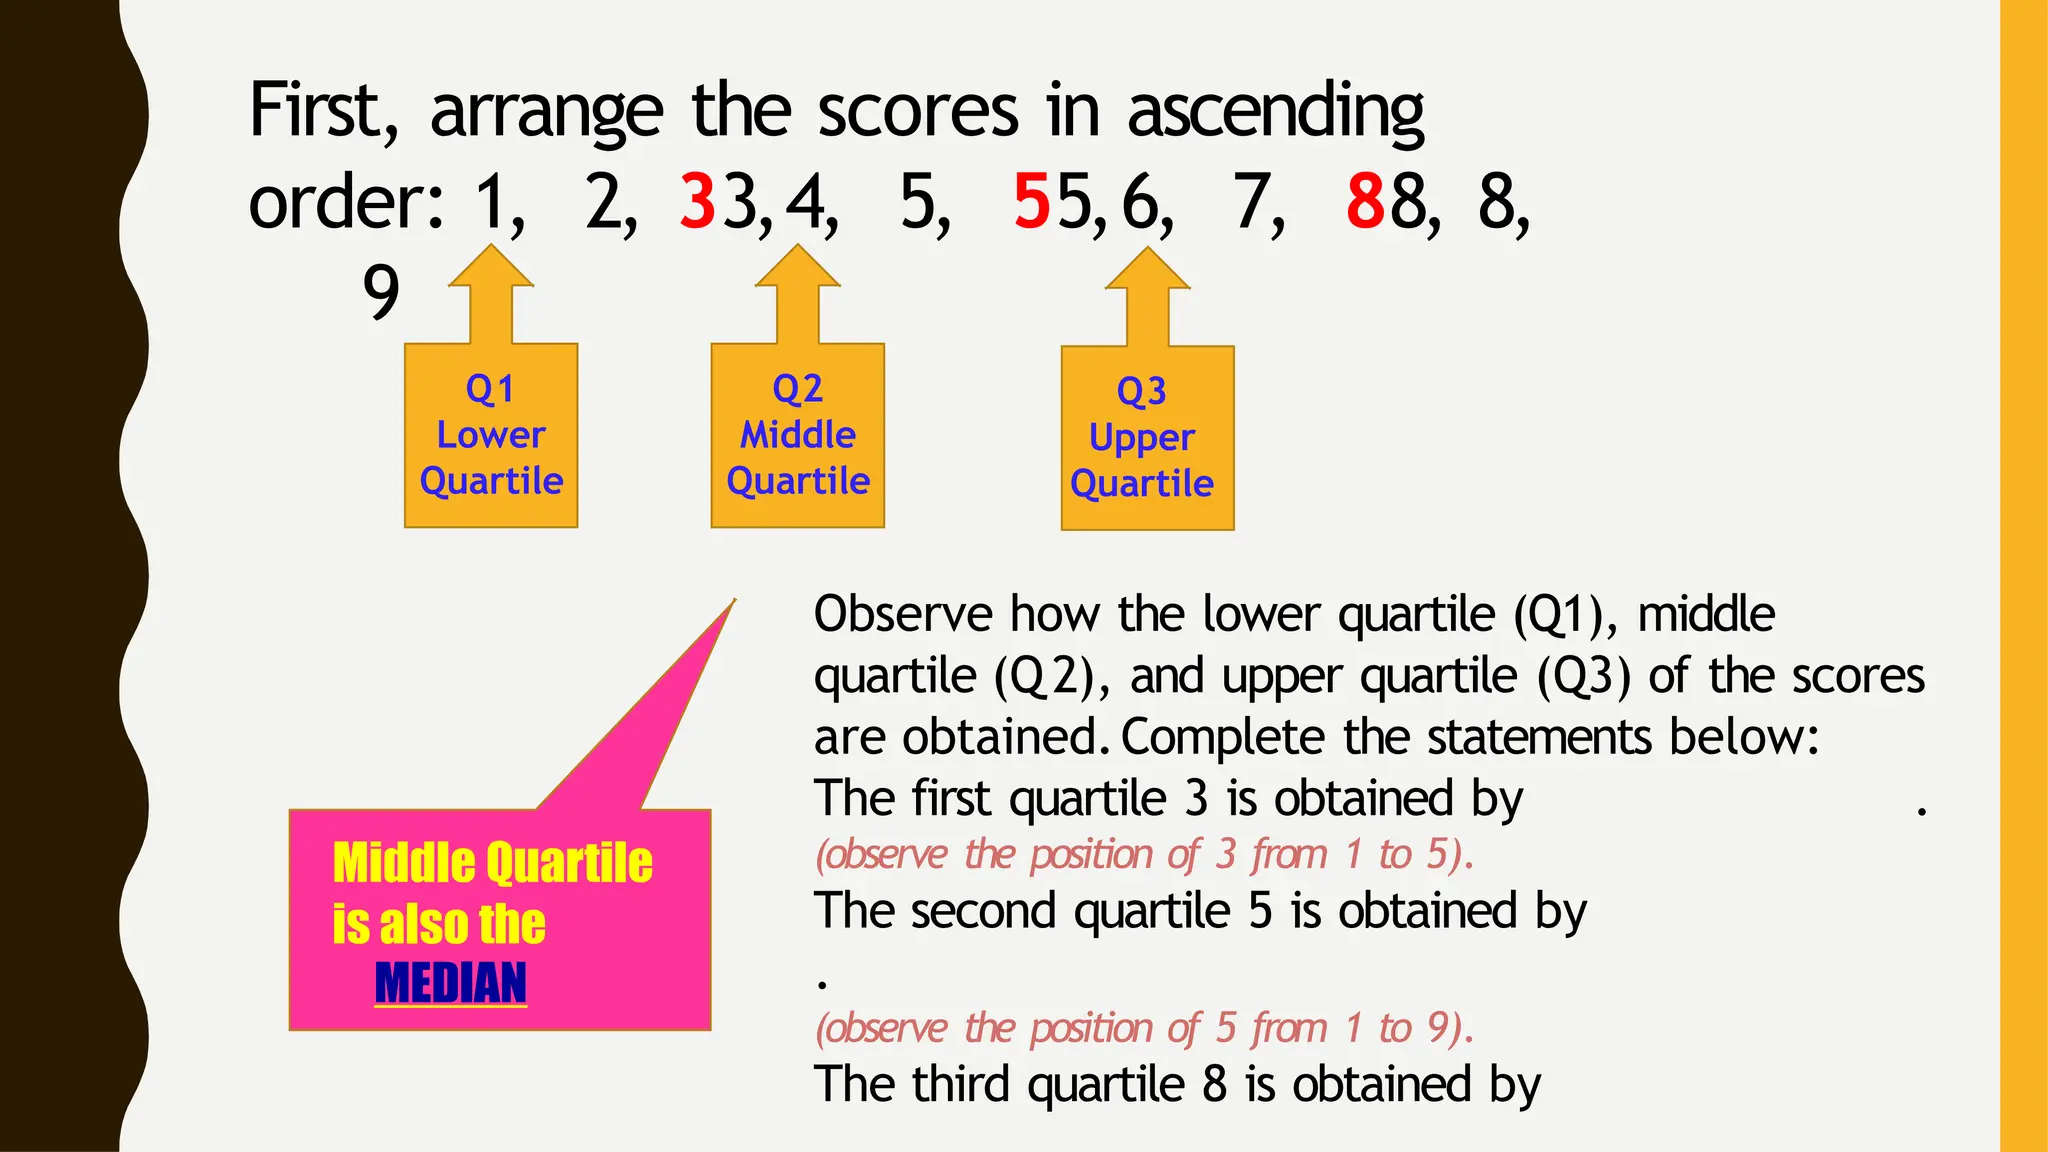
First, arrange thescores in ascending
order: 1, 2, 33,4, 5, 55,6, 7, 88, 8,
9
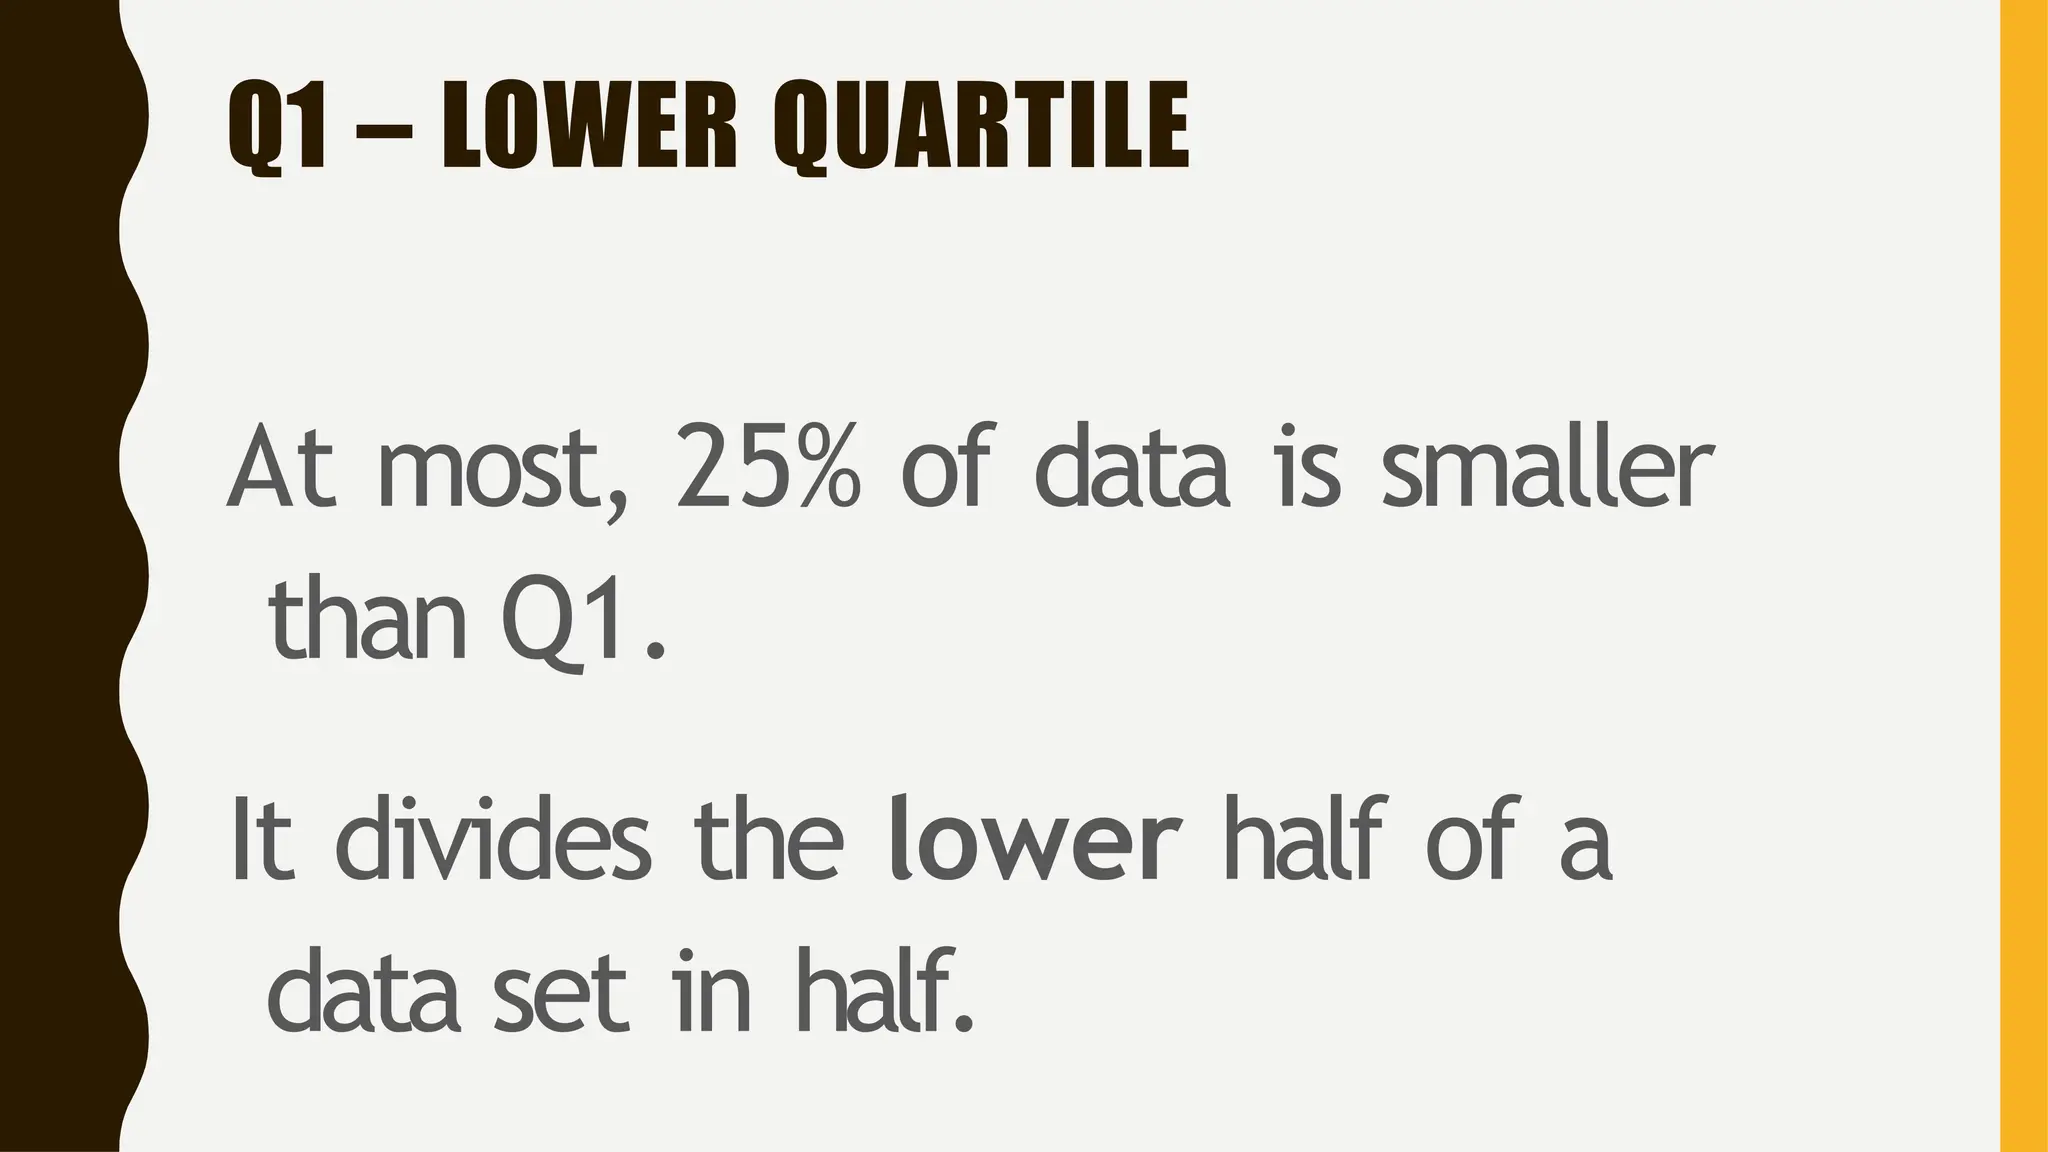
Q1
Lower
Quartile
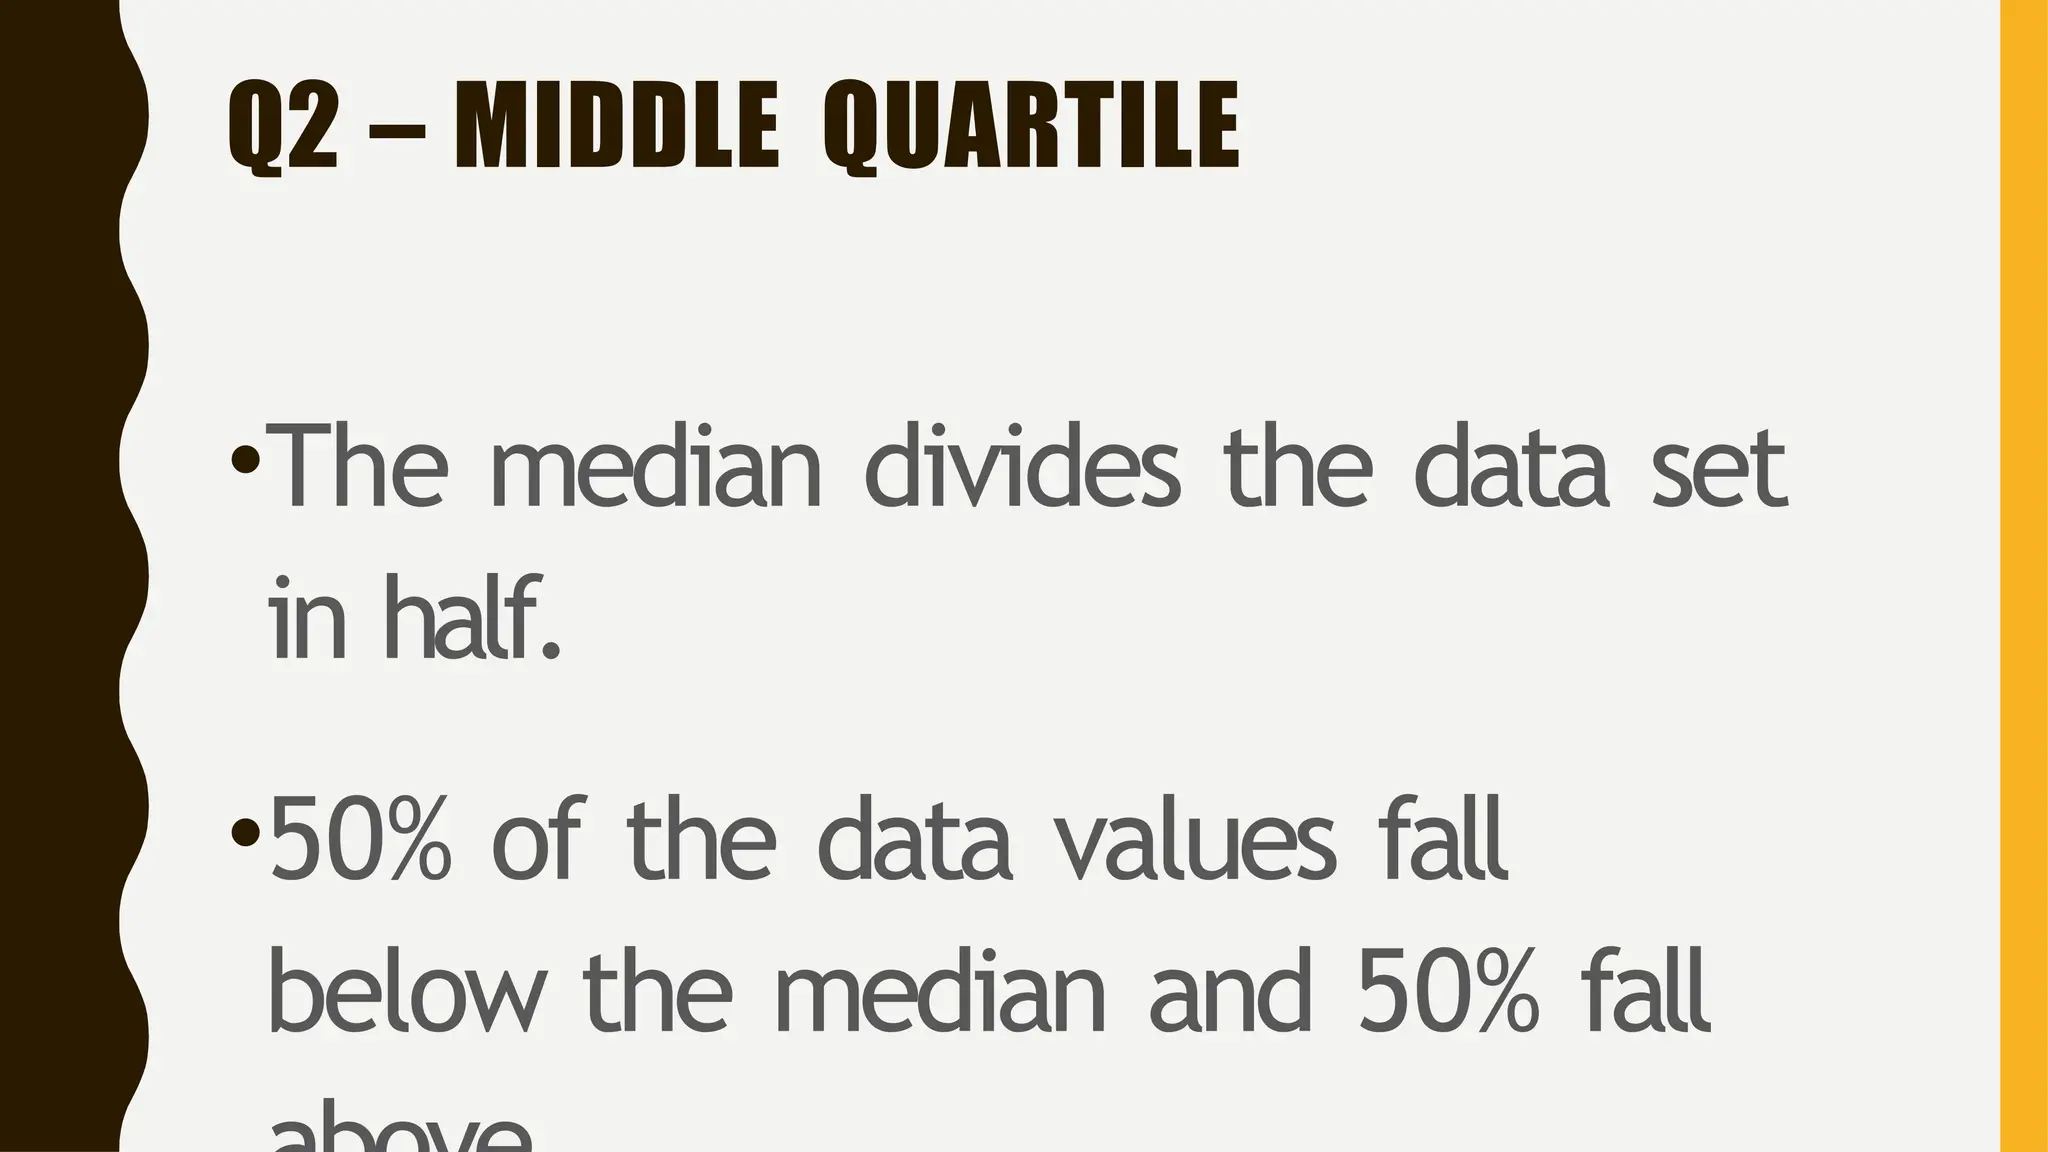
Q2
Middle
Quartile
Q3
Upper
Quartile
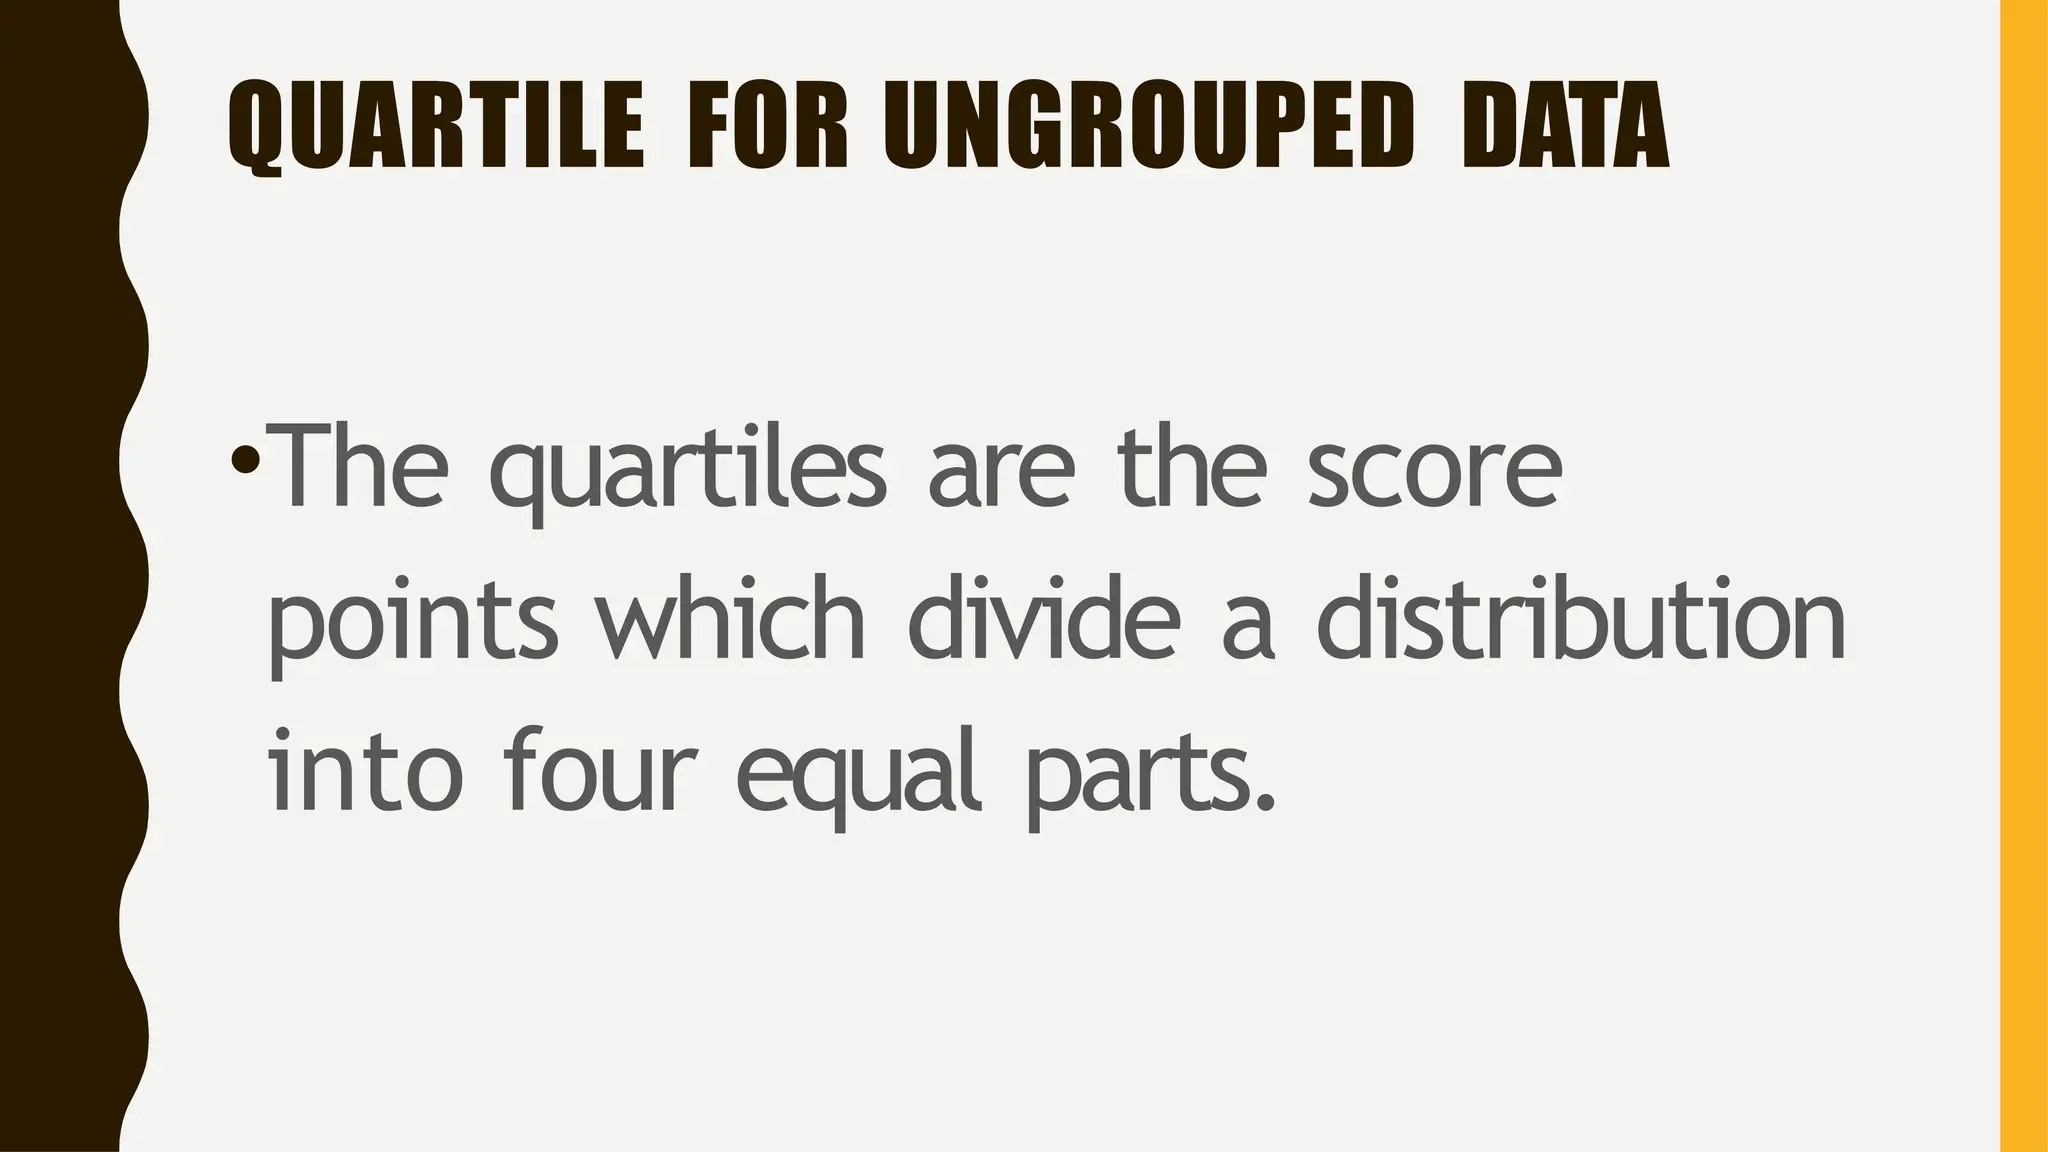
Observe how the lower quartile (Q1), middle
quartile (Q 2), and upper quartile (Q3) of the scores
are obtained.Complete the statements below:
The first quartile 3 is obtained by .
(observe the position of 3 from 1 to 5).
The second quartile 5 is obtained by
.
(observe the position of 5 from 1 to 9).
The third quartile 8 is obtained by
Middle Quartile
is also the
MEDIAN
25.
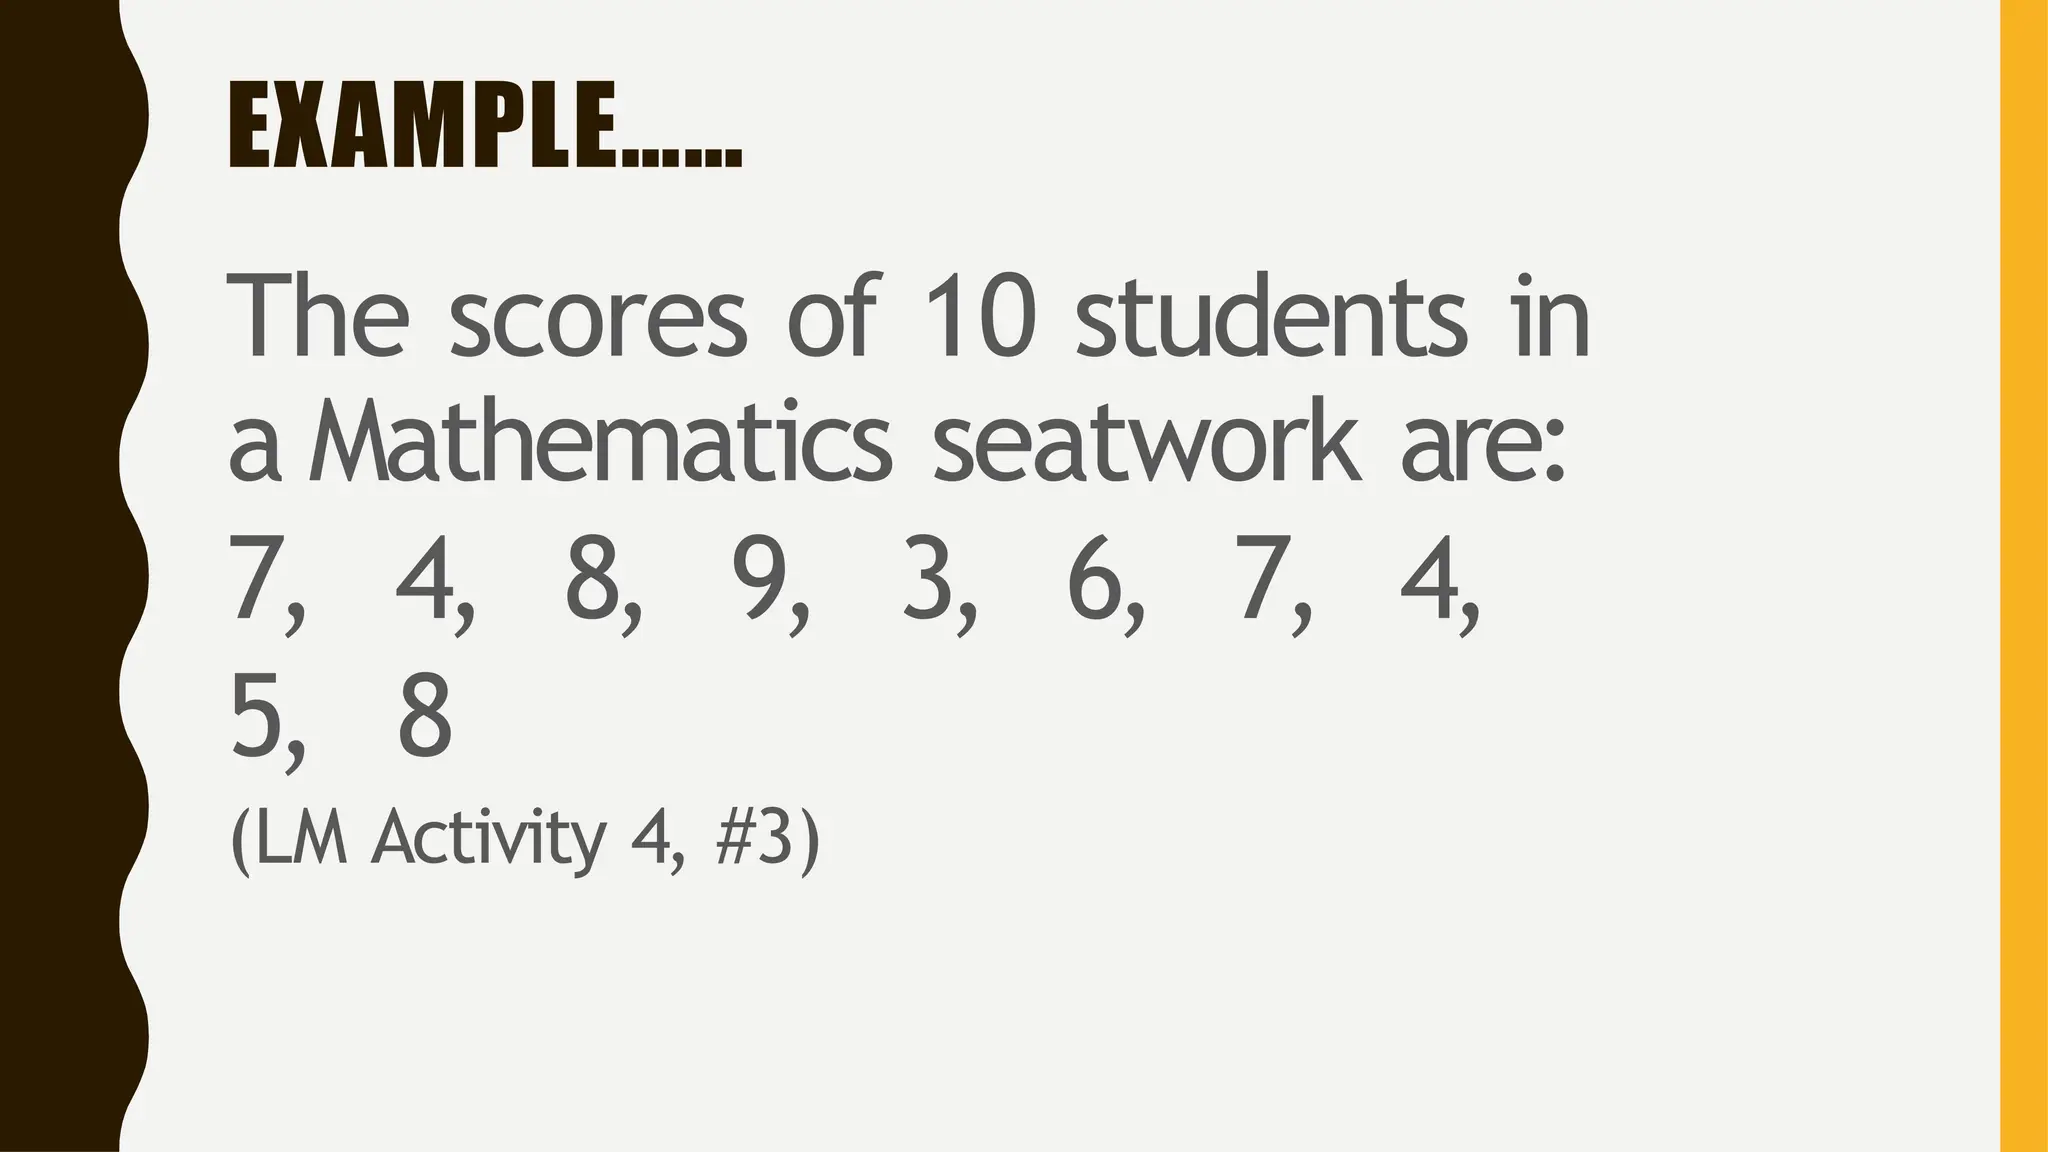
EXAMPLE……
The scores of10 students in
a Mathematics seatwork are:
7, 4, 8, 9, 3, 6, 7, 4,
5, 8
(LM Activity 4, #3)
26.
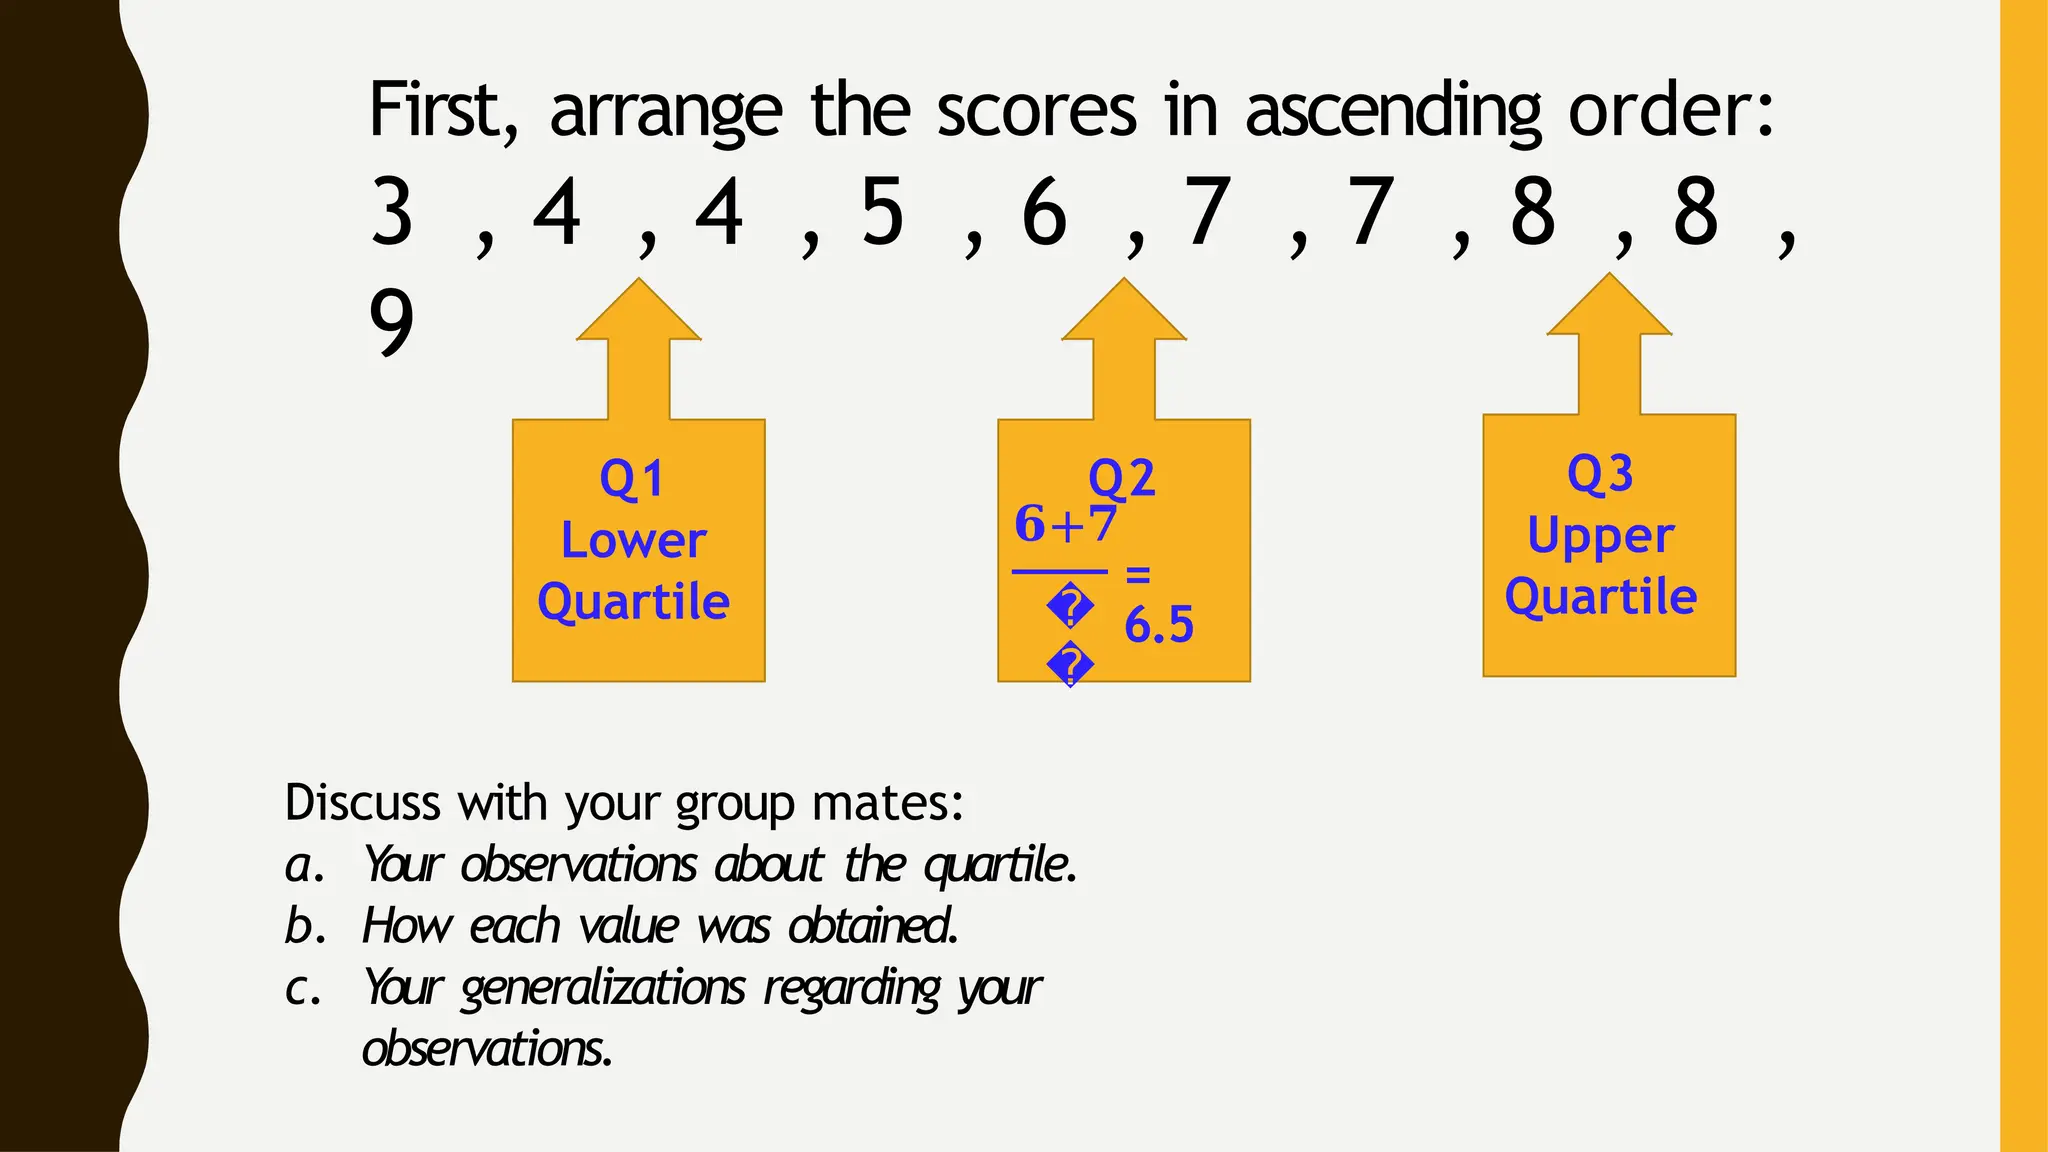
First, arrange thescores in ascending order:
3 , 4 , 4 , 5 , 6 , 7 , 7 , 8 , 8 ,
9
Q1
Lower
Quartile
Q2
�
�
𝟔+𝟕
=
6.5
Q3
Upper
Quartile
Discuss with your group mates:
a. Y
our observations about the quartile.
b. How each value was obtained.
c. Y
our generalizations regarding your
observations.
27.
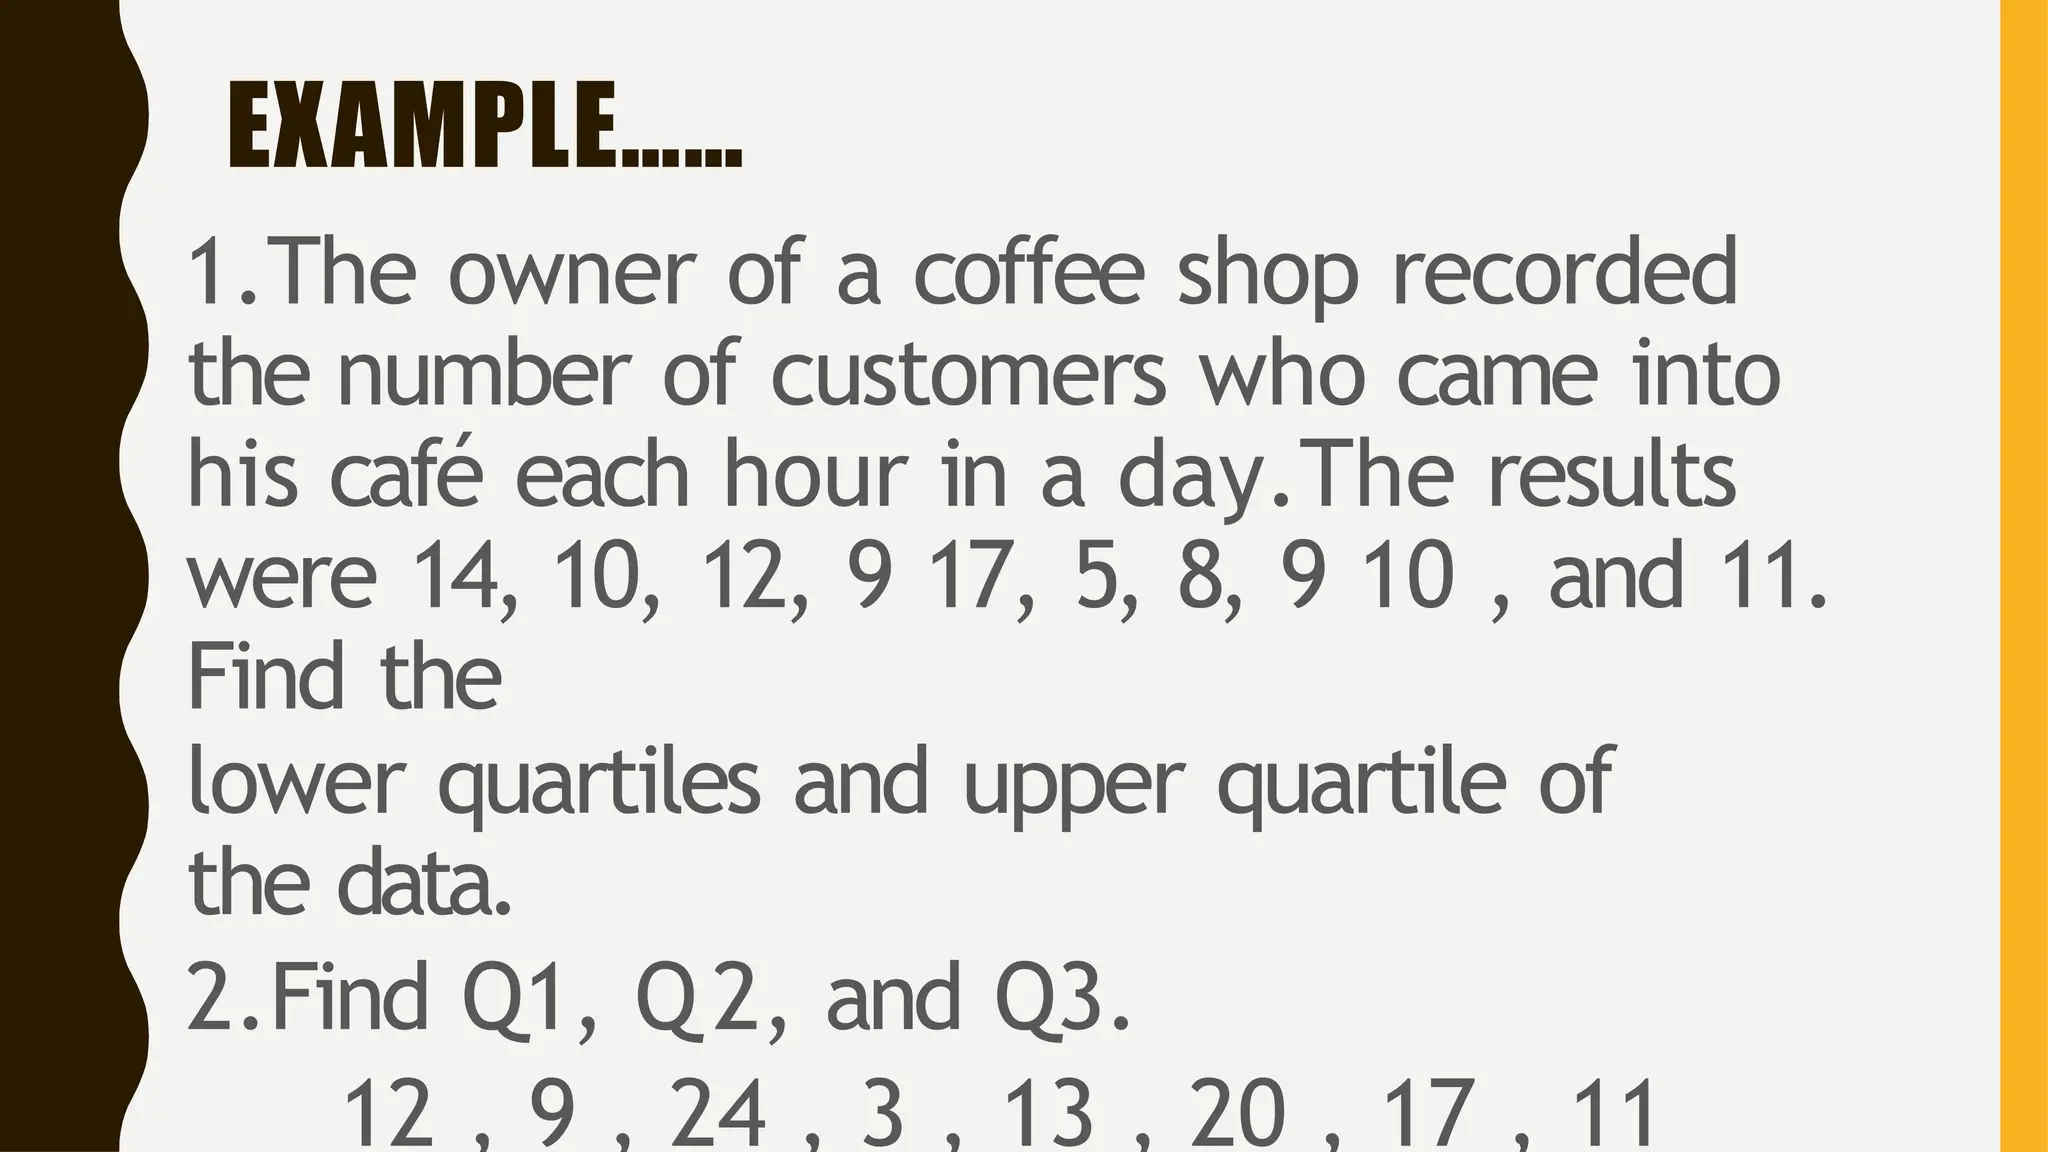
EXAMPLE……
1.The owner ofa coffee shop recorded
the number of customers who came into
his café each hour in a day.The results
were 14, 10, 12, 9 17, 5, 8, 9 10 , and 11.
Find the
lower quartiles and upper quartile of
the data.
2.Find Q1, Q 2, and Q3.
12 , 9 , 24 , 3 , 13 , 20 , 17 , 11
28.
QUARTILE
U N GR O U P E D D ATA B Y M E N
D E N H A L L
A N D S I N C I C H M E T H O D
29.
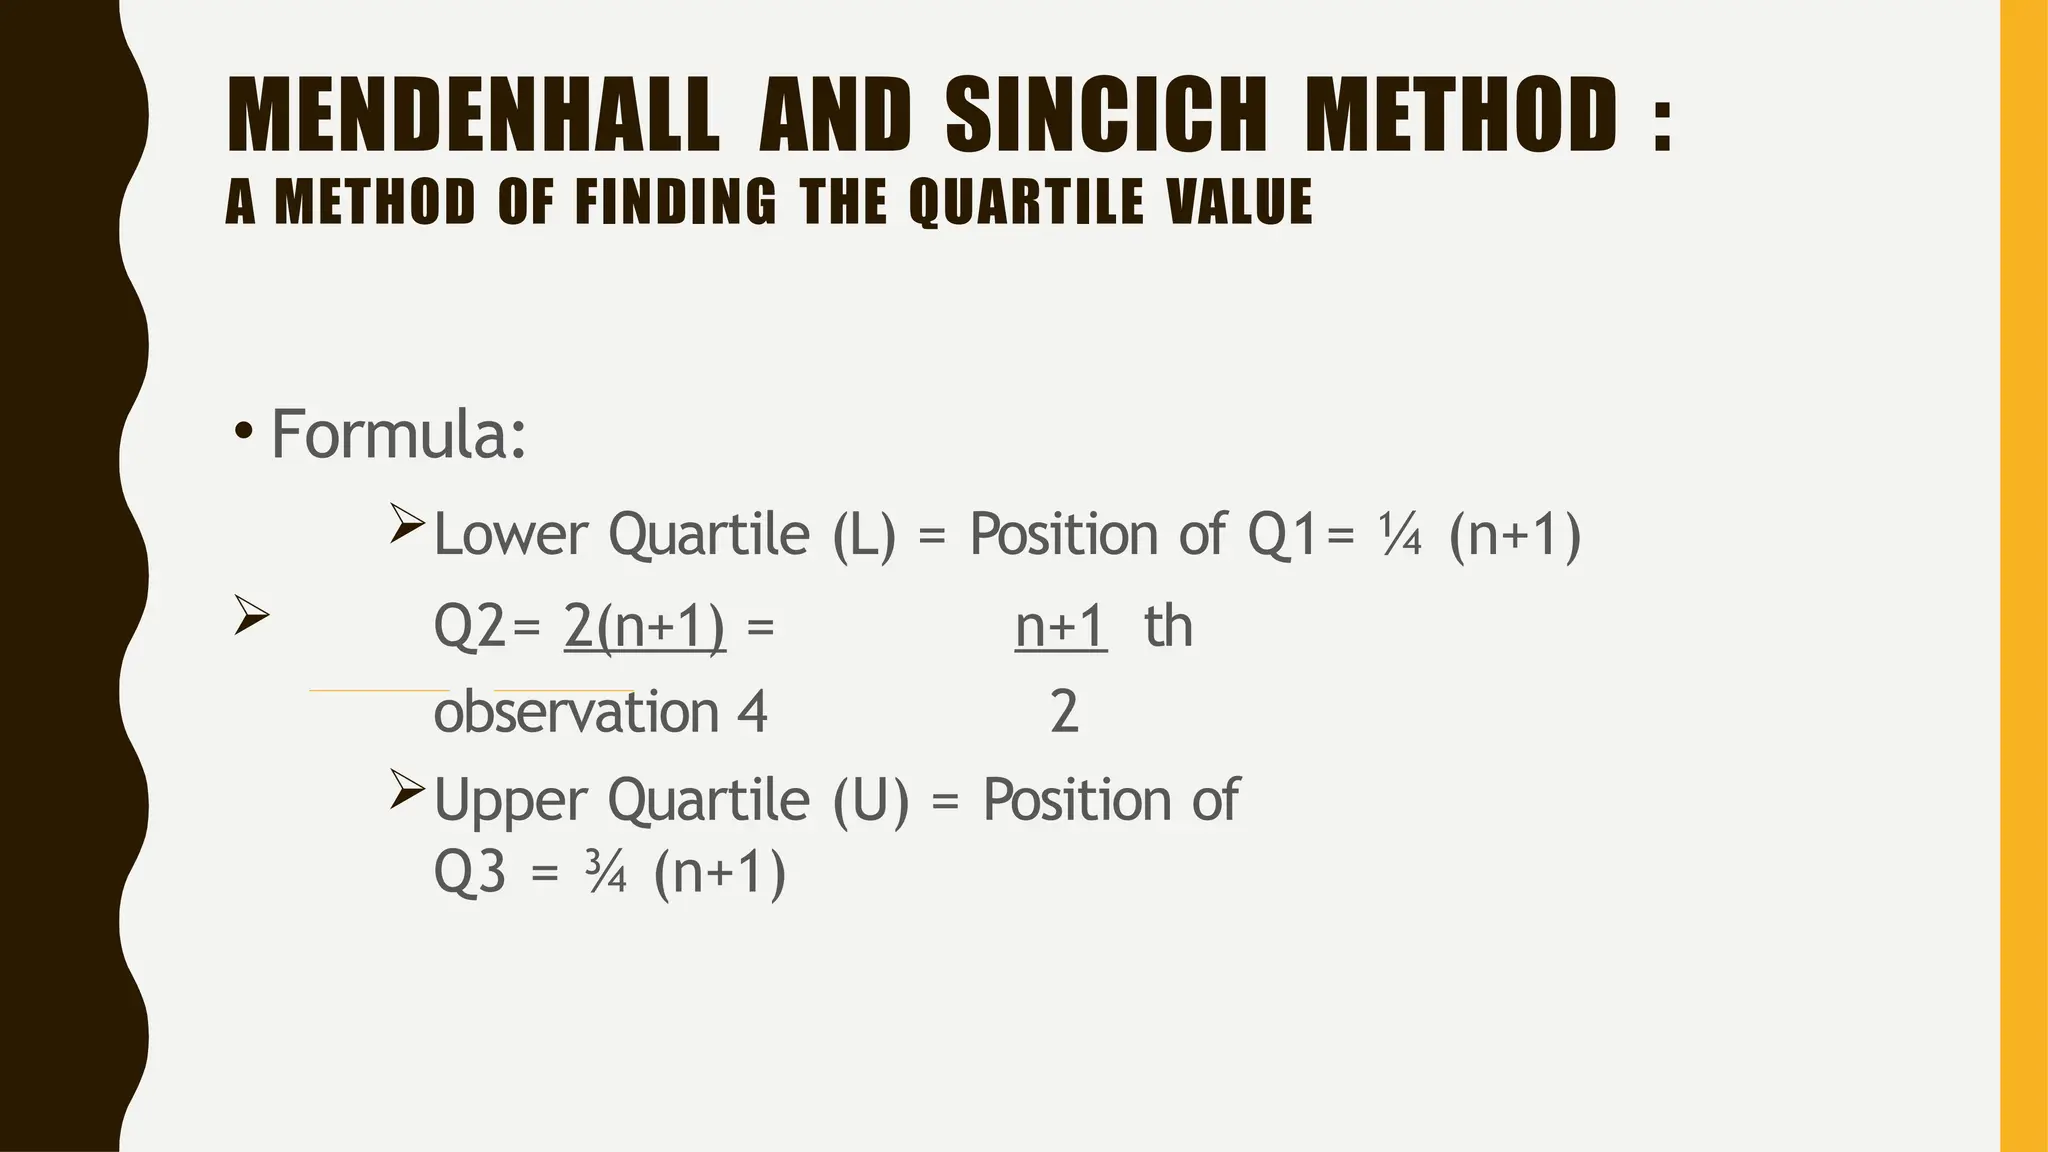
MENDENHALL AND SINCICHMETHOD :
A METHOD OF FINDING THE QUARTILE VALUE
• This method is being developed by William Mendenhall and
Terry Sincich to find the position of the quartile in the given
data.
30.
MENDENHALL AND SINCICHMETHOD :
A METHOD OF FINDING THE QUARTILE VALUE
• Formula:
Lower Quartile (L) = Position of Q1= ¼ (n+1)
Q2= 2(n+1) = n+1 th
observation 4 2
Upper Quartile (U) = Position of
Q3 = ¾ (n+1)
31.
MENDENHALL AND SINCICHMETHOD :
A METHOD OF FINDING THE QUARTILE VALUE
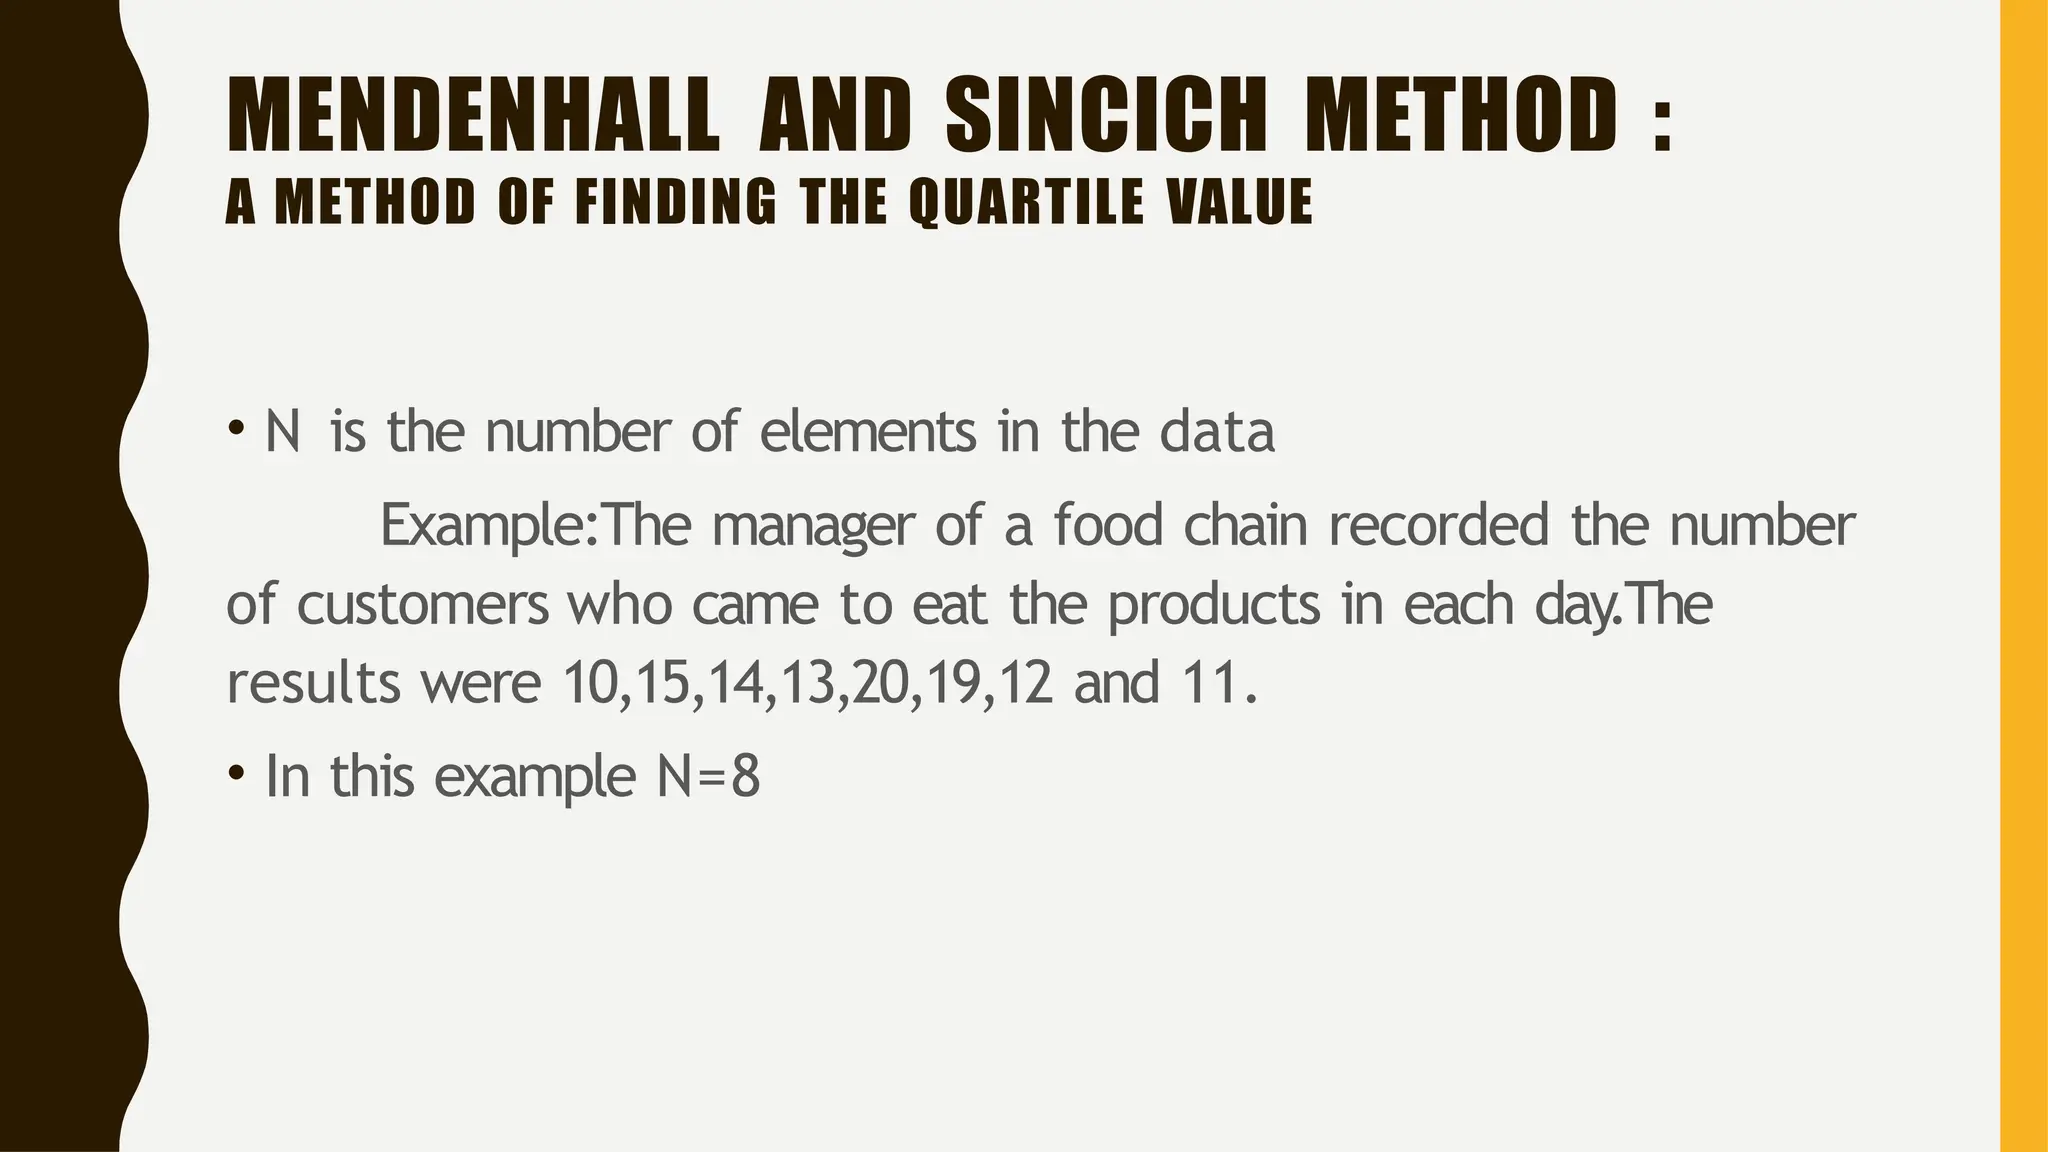
• N is the number of elements in the data
Example:The manager of a food chain recorded the number
of customers who came to eat the products in each day.The
results were 10,15,14,13,20,19,12 and 11.
• In this example N=8
32.
MENDENHALL AND SINCICHMETHOD
A METHOD OF FINDING THE QUARTILE VALUE
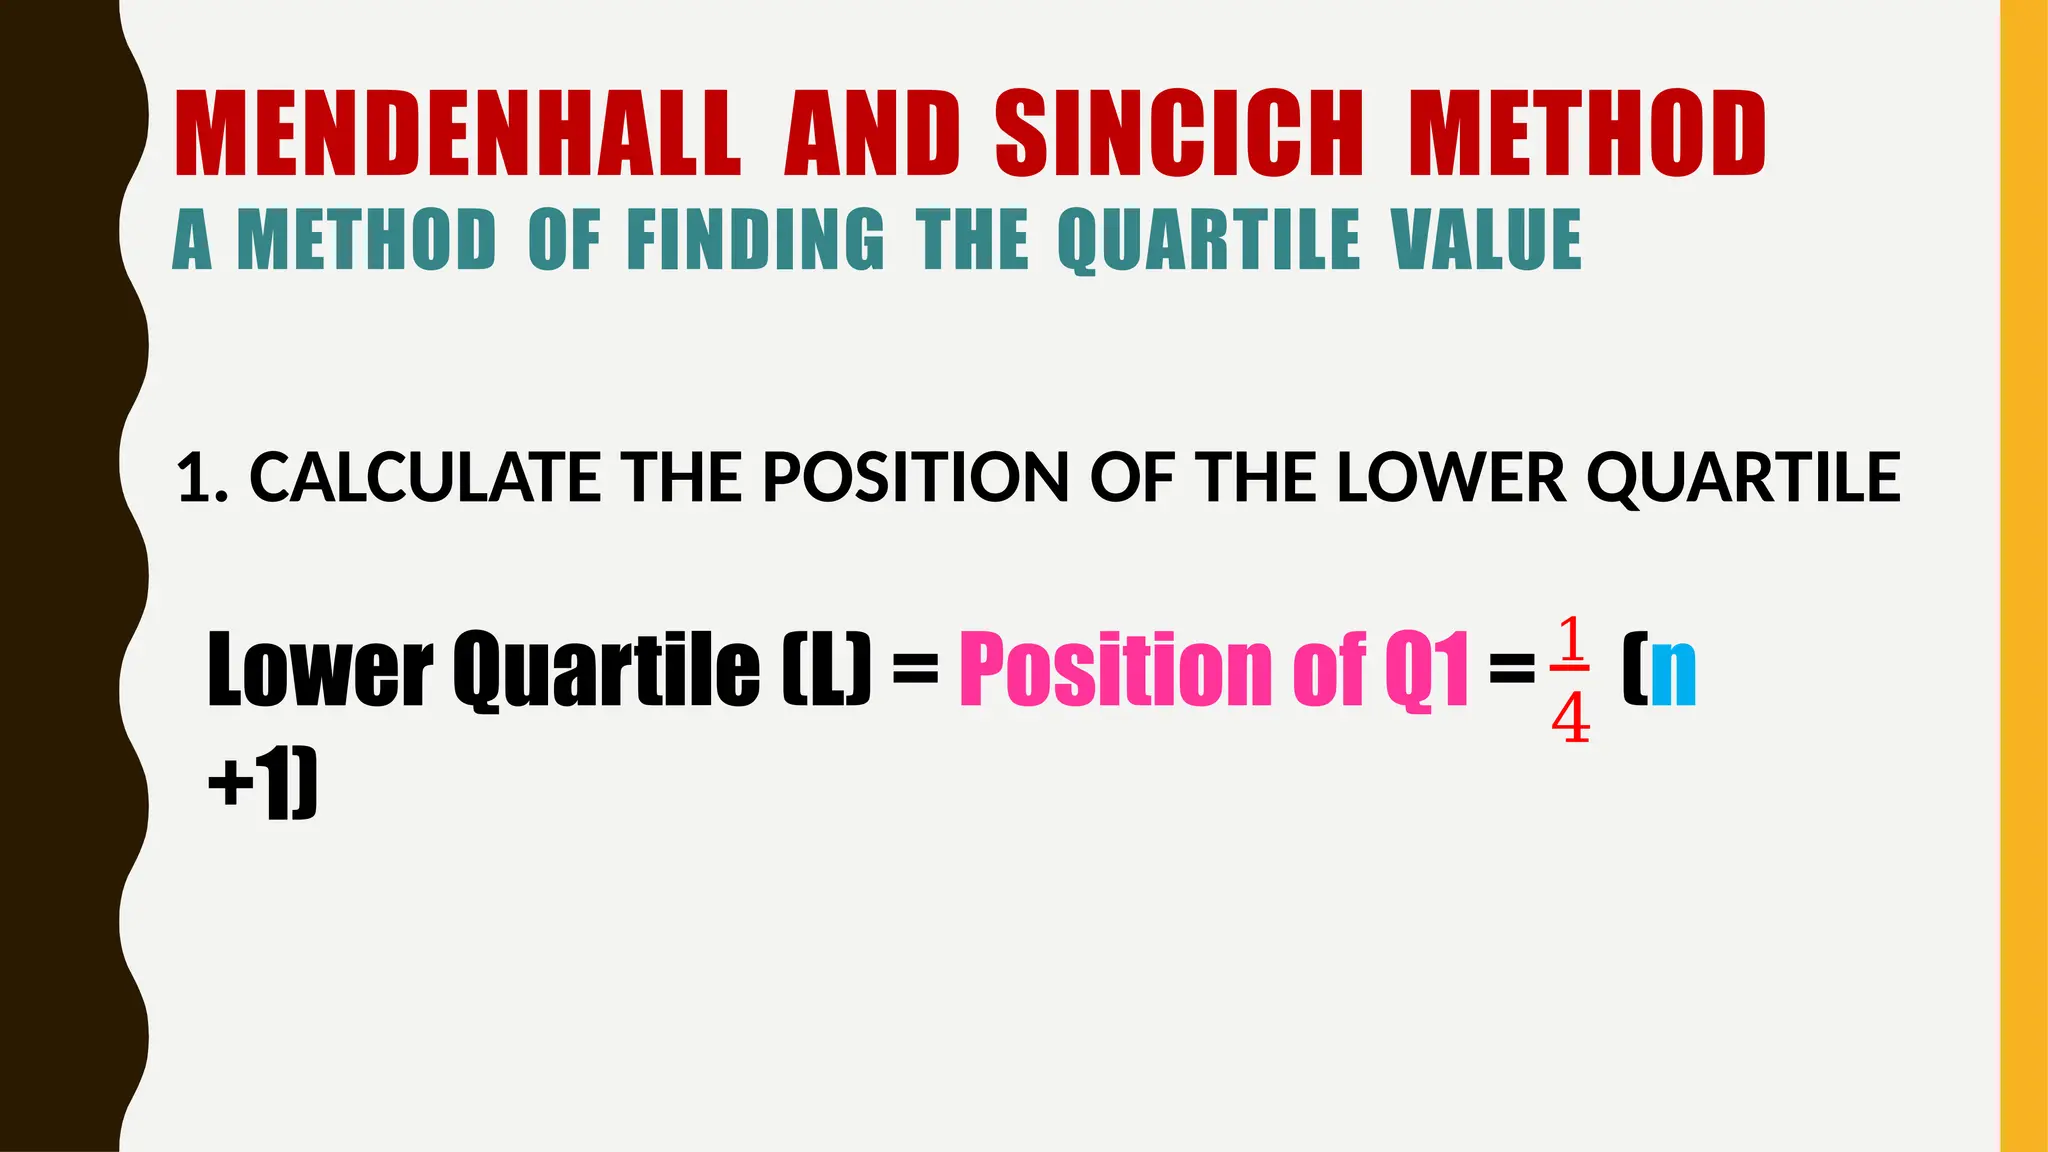
1. CALCULATE THE POSITION OF THE LOWER QUARTILE
4
Lower Quartile (L) = Position of Q1 = 1
(n
+1)
33.
MENDENHALL AND SINCICHMETHOD
A METHOD OF FINDING THE QUARTILE VALUE
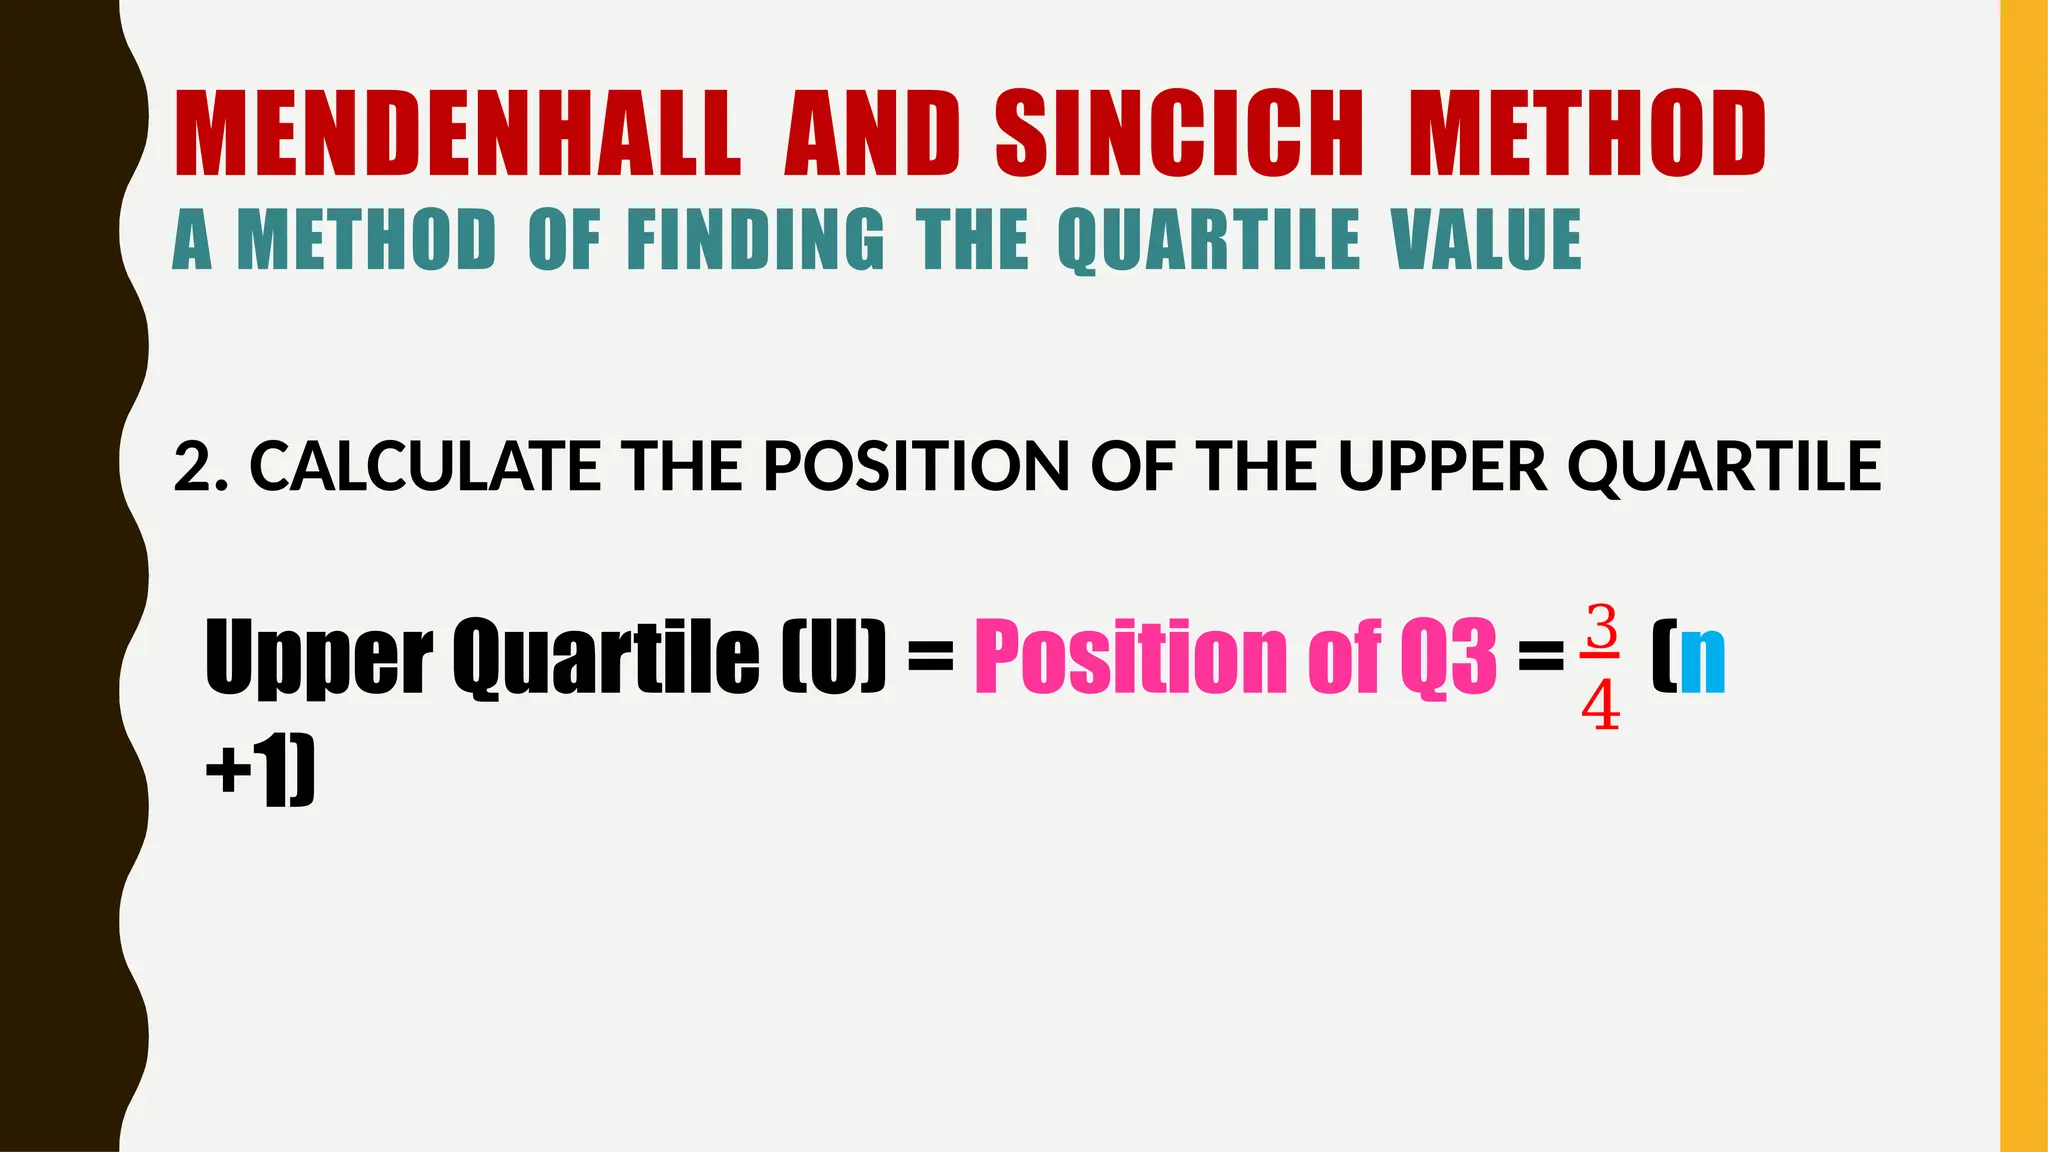
2. CALCULATE THE POSITION OF THE UPPER QUARTILE
4
Upper Quartile (U) = Position of Q3 = 3
(n
+1)
34.
MENDENHALL AND SINCICHMETHOD
A M ET H O D O F F I N D I N G T H E Q U AR T I L E VAL UE
4
Position of Q1 = 1
(n
+1) = 1
(9
+1)
4
= 2.5 (round up)
= 3
THE LOWER QUARTILE VALUE Q1 IS THE 3RD DATA ELEMENT, SO Q1 = 5
4
1
(n +1) and round off to the nearest integer.
EXAMPLE DATA SET
{1, 3, 5 7, 16, 21, 27, 30, 31} and n = 9
To find Q1 locate its position using the formula
35.
MENDENHALL AND SINCICHMETHOD
A M ET H O D O F F I N D I N G T H E Q U AR T I L E VAL UE
4
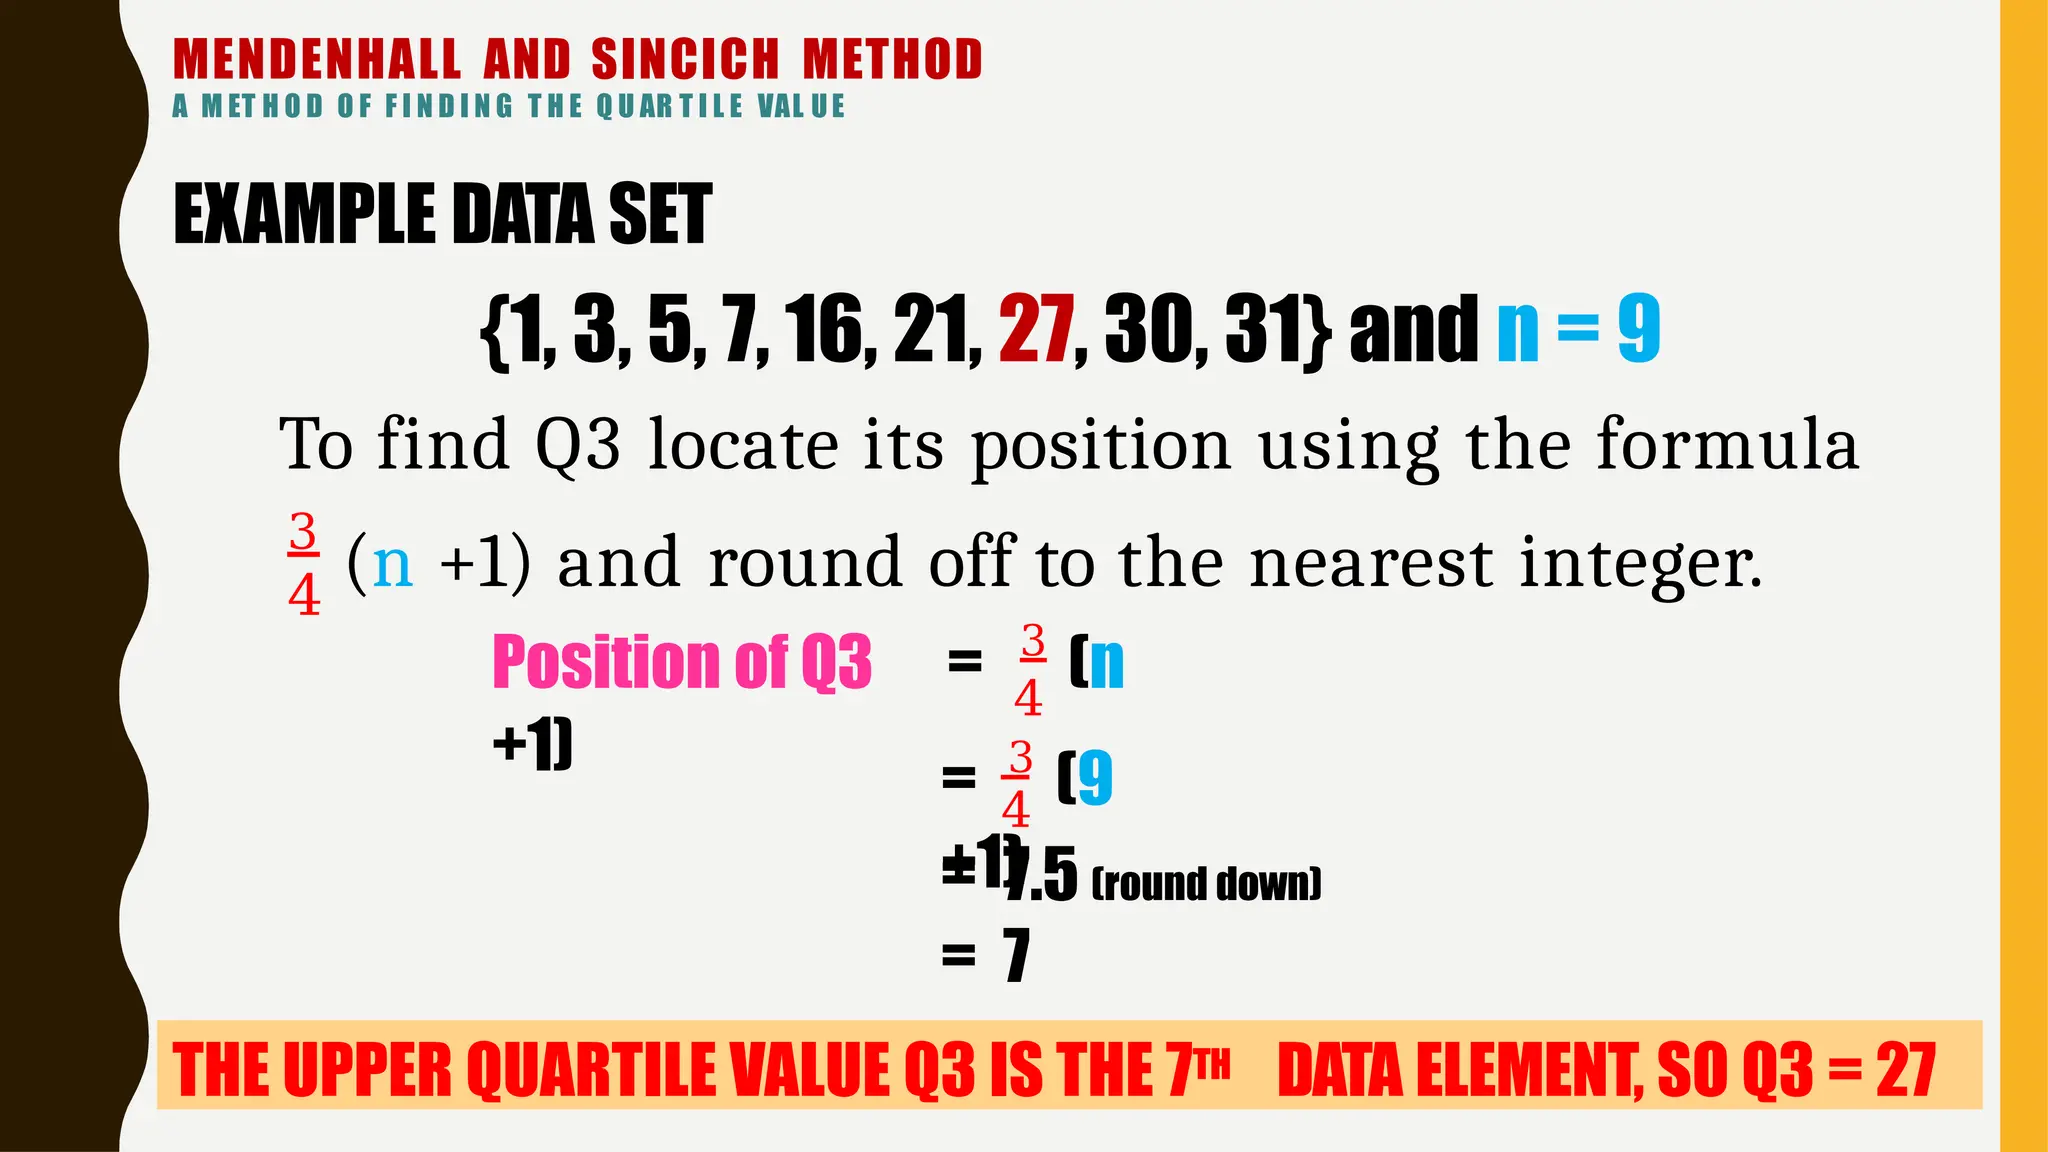
Position of Q3 = 3
(n
+1) = 3
(9
+1)
4
= 7.5 (round down)
= 7
THE UPPER QUARTILE VALUE Q3 IS THE 7TH DATA ELEMENT, SO Q3 = 27
4
3
(n +1) and round off to the nearest integer.
EXAMPLE DATA SET
{1, 3, 5, 7, 16, 21, 27, 30, 31} and n = 9
To find Q3 locate its position using the formula
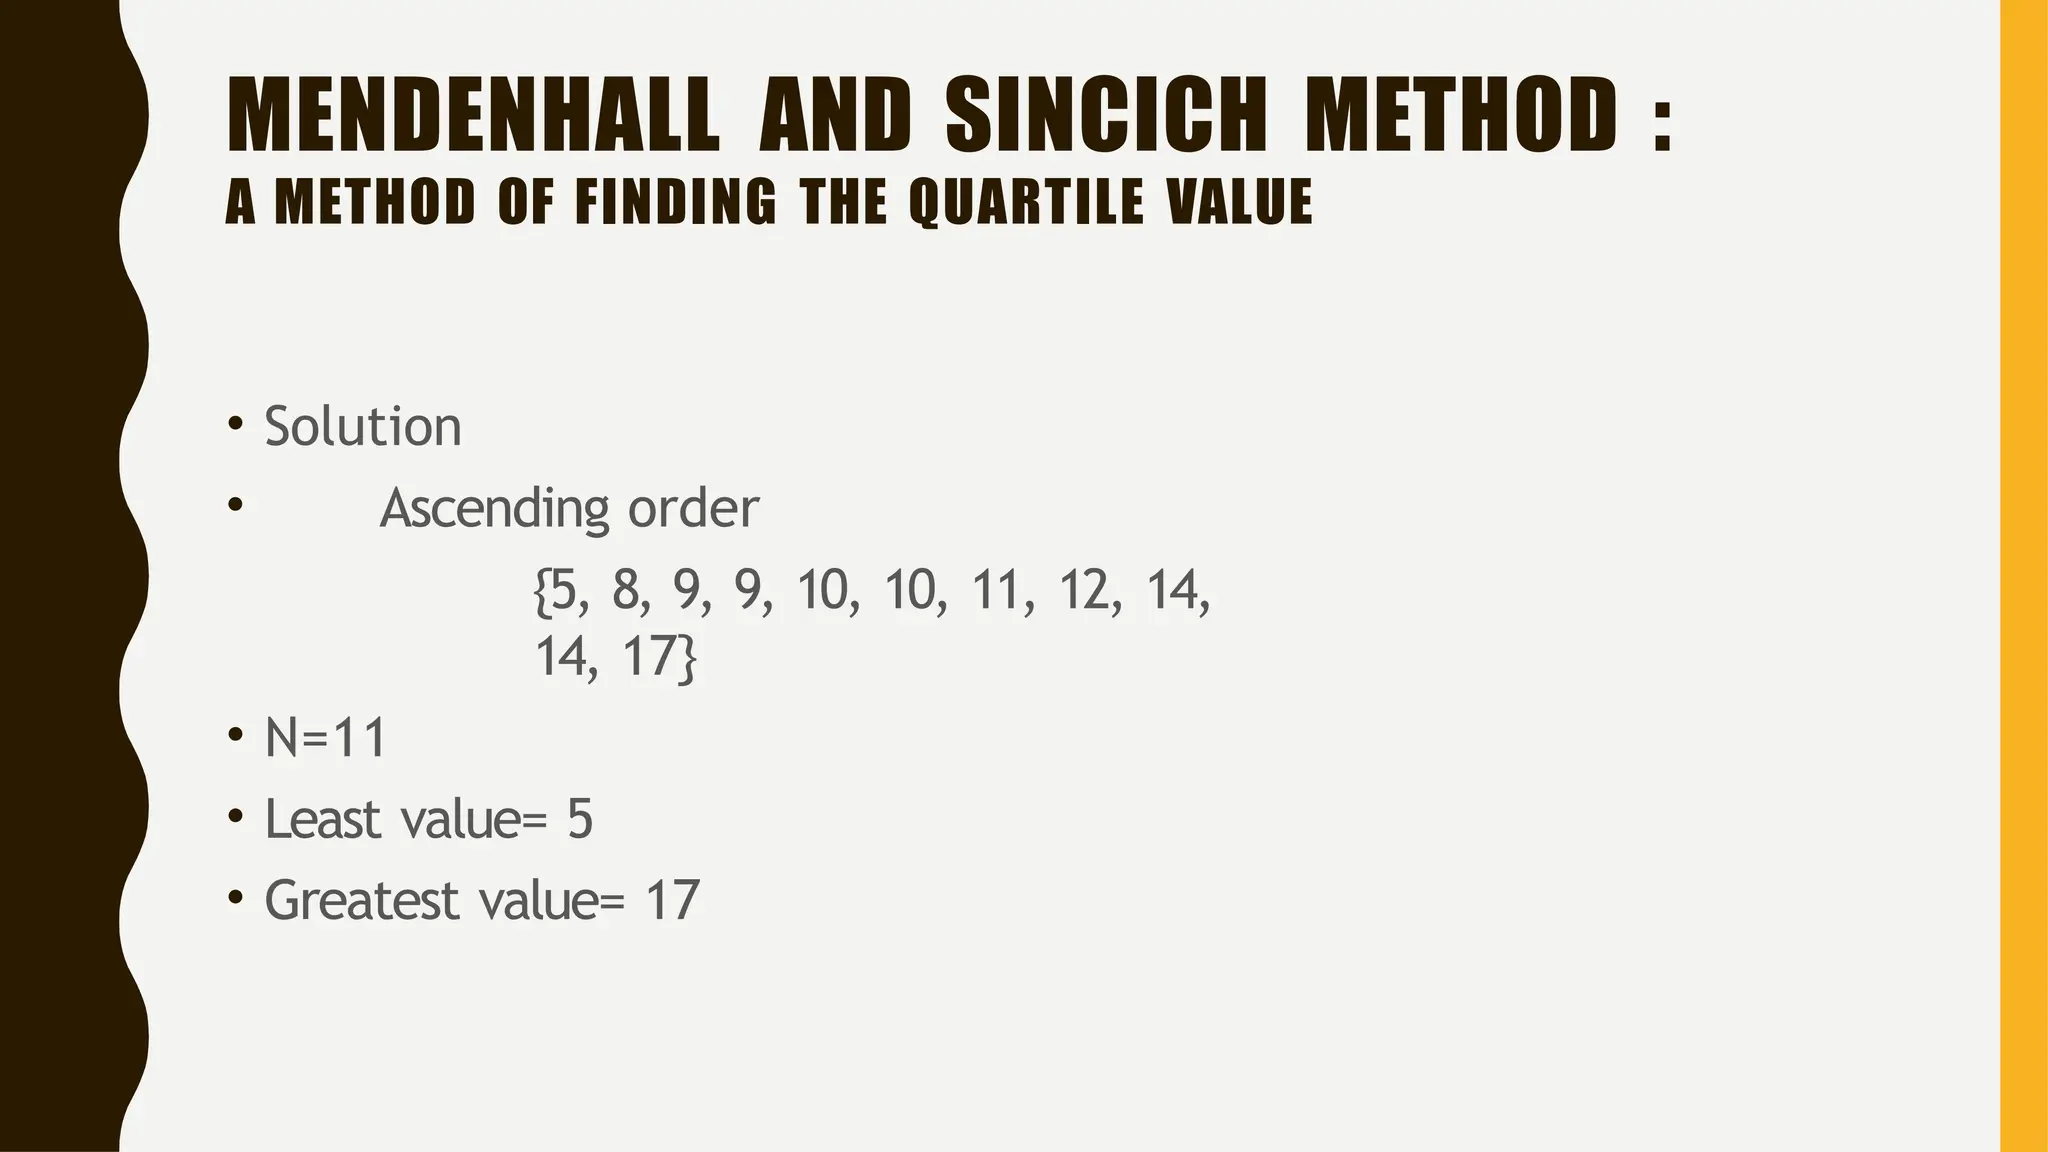
MENDENHALL AND SINCICHMETHOD :
A METHOD OF FINDING THE QUARTILE VALUE
• Solution
• Ascending order
{5, 8, 9, 9, 10, 10, 11, 12, 14,
14, 17}
• N=11
• Least value= 5
• Greatest value= 17
38.
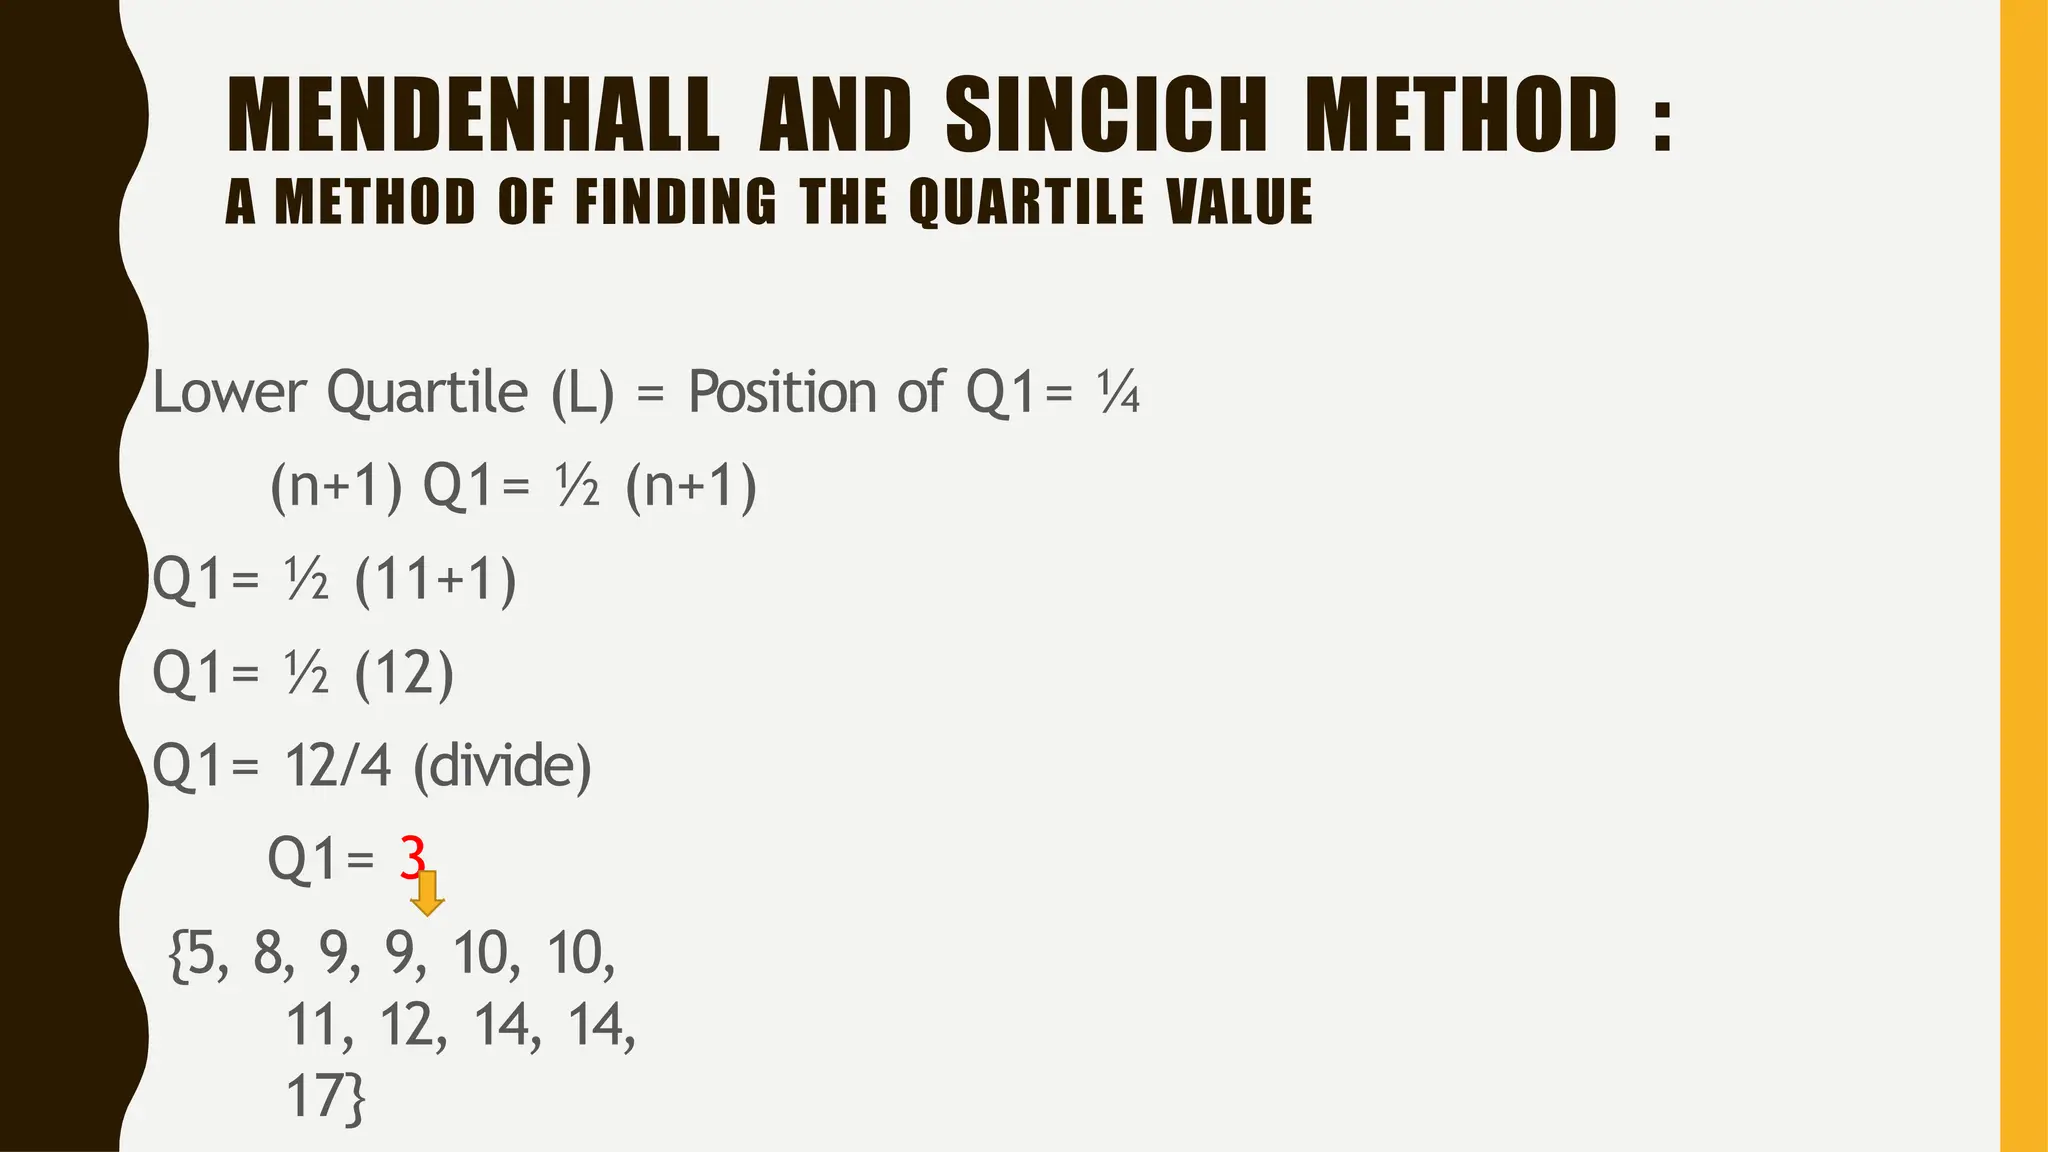
MENDENHALL AND SINCICHMETHOD :
A METHOD OF FINDING THE QUARTILE VALUE
Lower Quartile (L) = Position of Q1= ¼
(n+1) Q1= ½ (n+1)
Q1= ½ (11+1)
Q1= ½ (12)
Q1= 12/4 (divide)
Q1= 3
{5, 8, 9, 9, 10, 10,
11, 12, 14, 14,
17}
39.
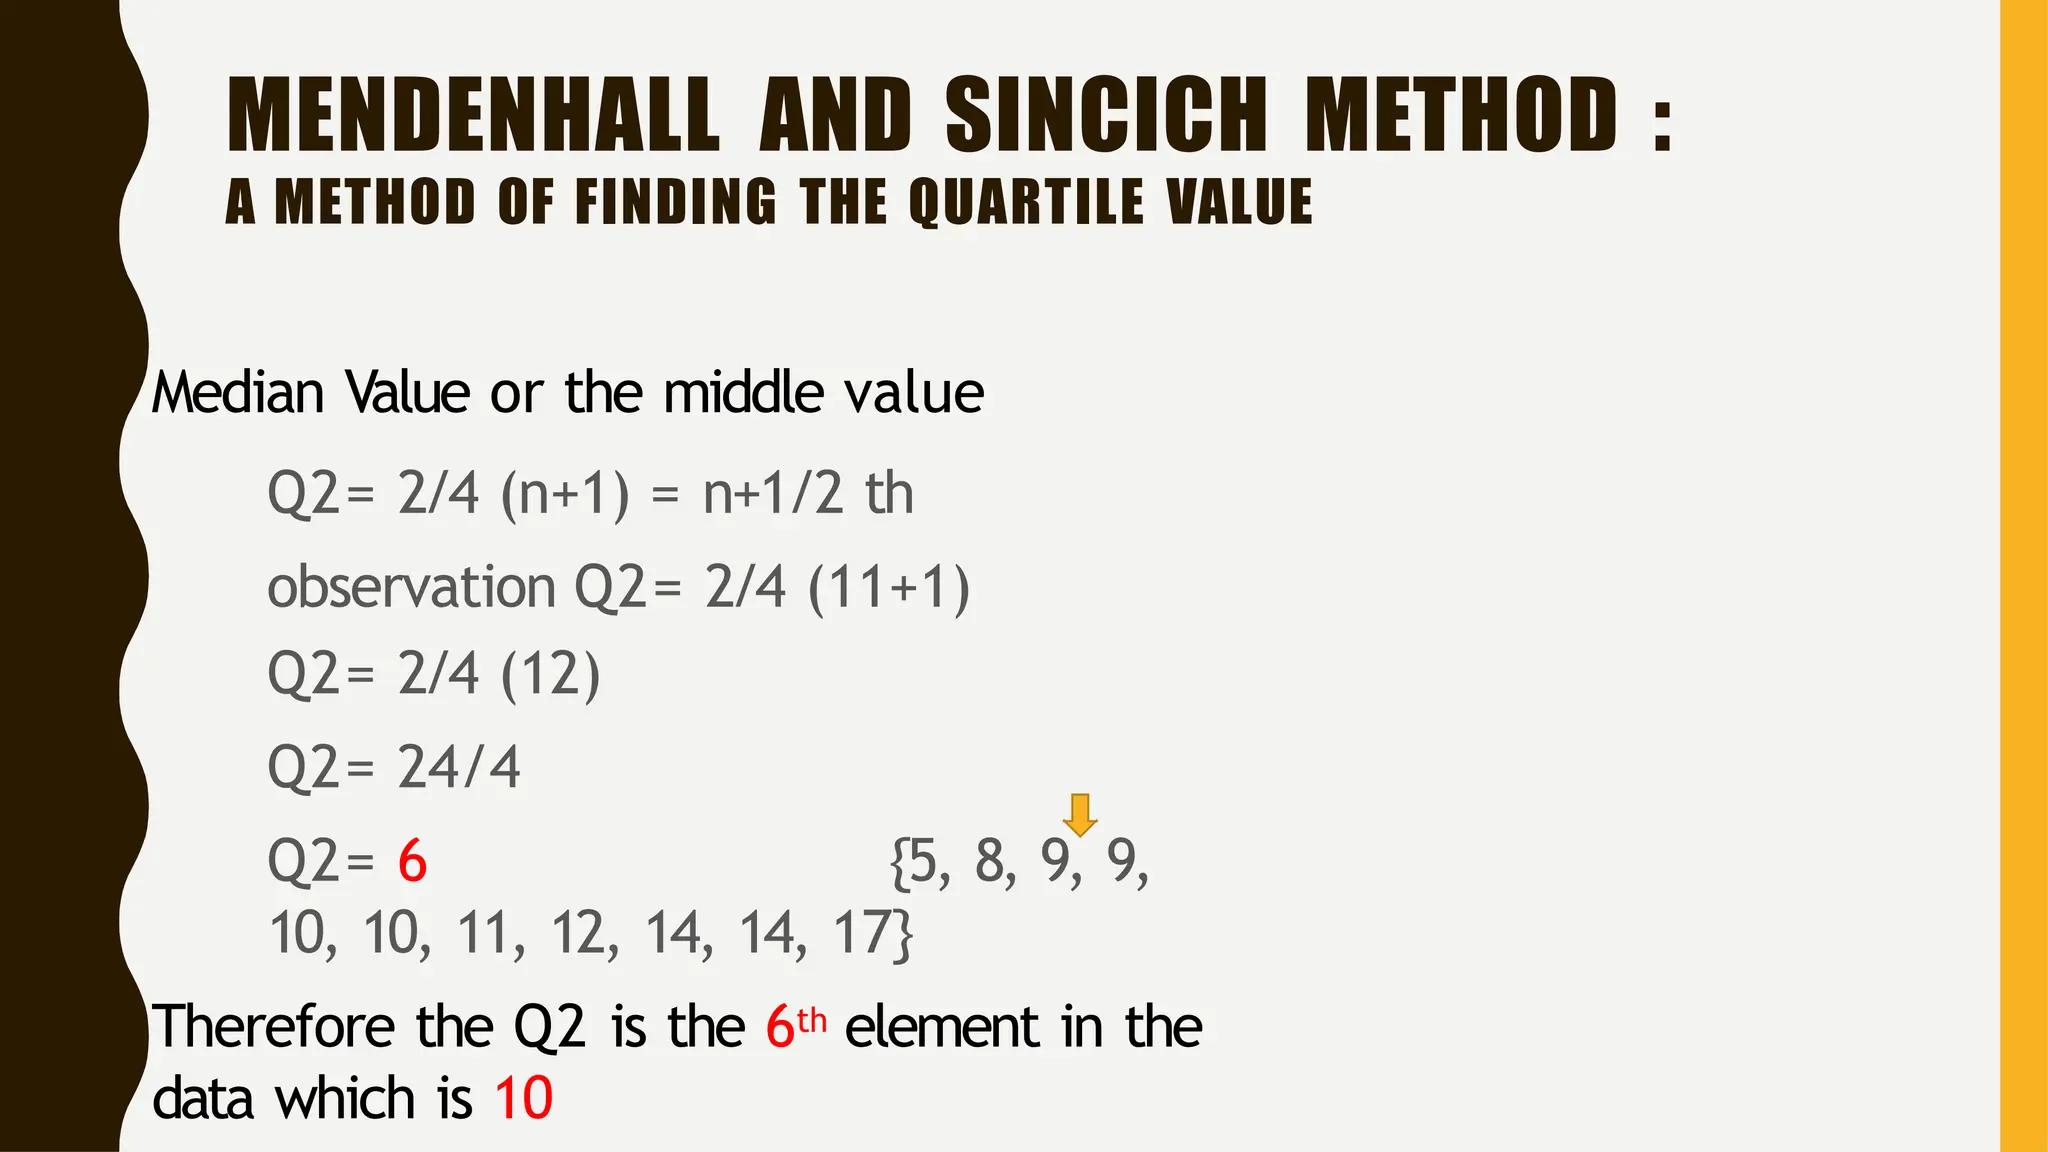
MENDENHALL AND SINCICHMETHOD :
A METHOD OF FINDING THE QUARTILE VALUE
Median Value or the middle value
Q2= 2/4 (n+1) = n+1/2 th
observation Q2= 2/4 (11+1)
Q2= 2/4 (12)
Q2= 24/4
Q2= 6 {5, 8, 9, 9,
10, 10, 11, 12, 14, 14, 17}
• Therefore the Q2 is the 6th element in the
data which is 10
40.
MENDENHALL AND SINCICHMETHOD :
A METHOD OF FINDING THE QUARTILE VALUE
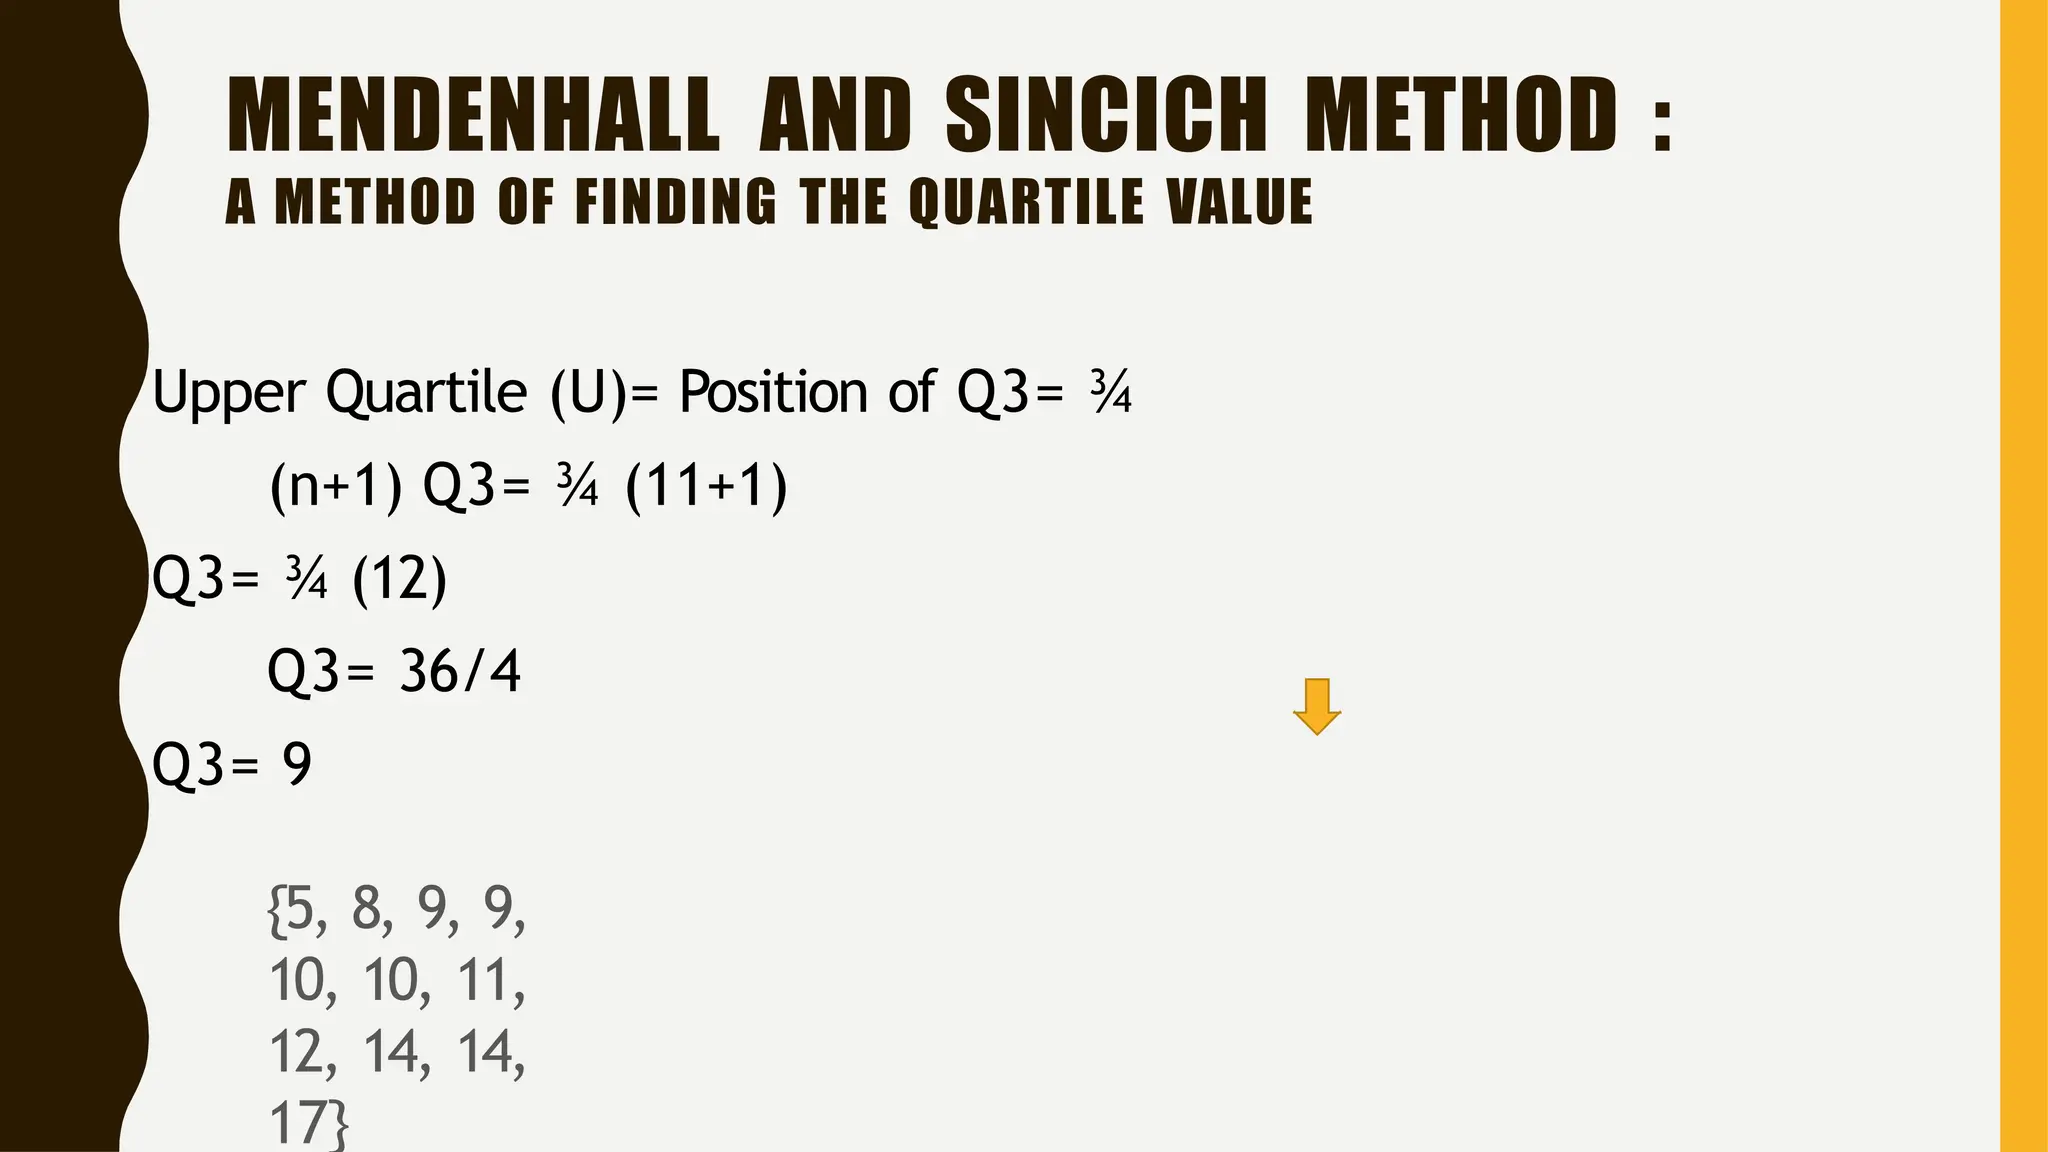
Upper Quartile (U)= Position of Q3= ¾
(n+1) Q3= ¾ (11+1)
Q3= ¾ (12)
Q3= 36/4
Q3= 9
{5, 8, 9, 9,
10, 10, 11,
12, 14, 14,
17}
41.
MENDENHALL AND SINCICHMETHOD :
A METHOD OF FINDING THE QUARTILE VALUE
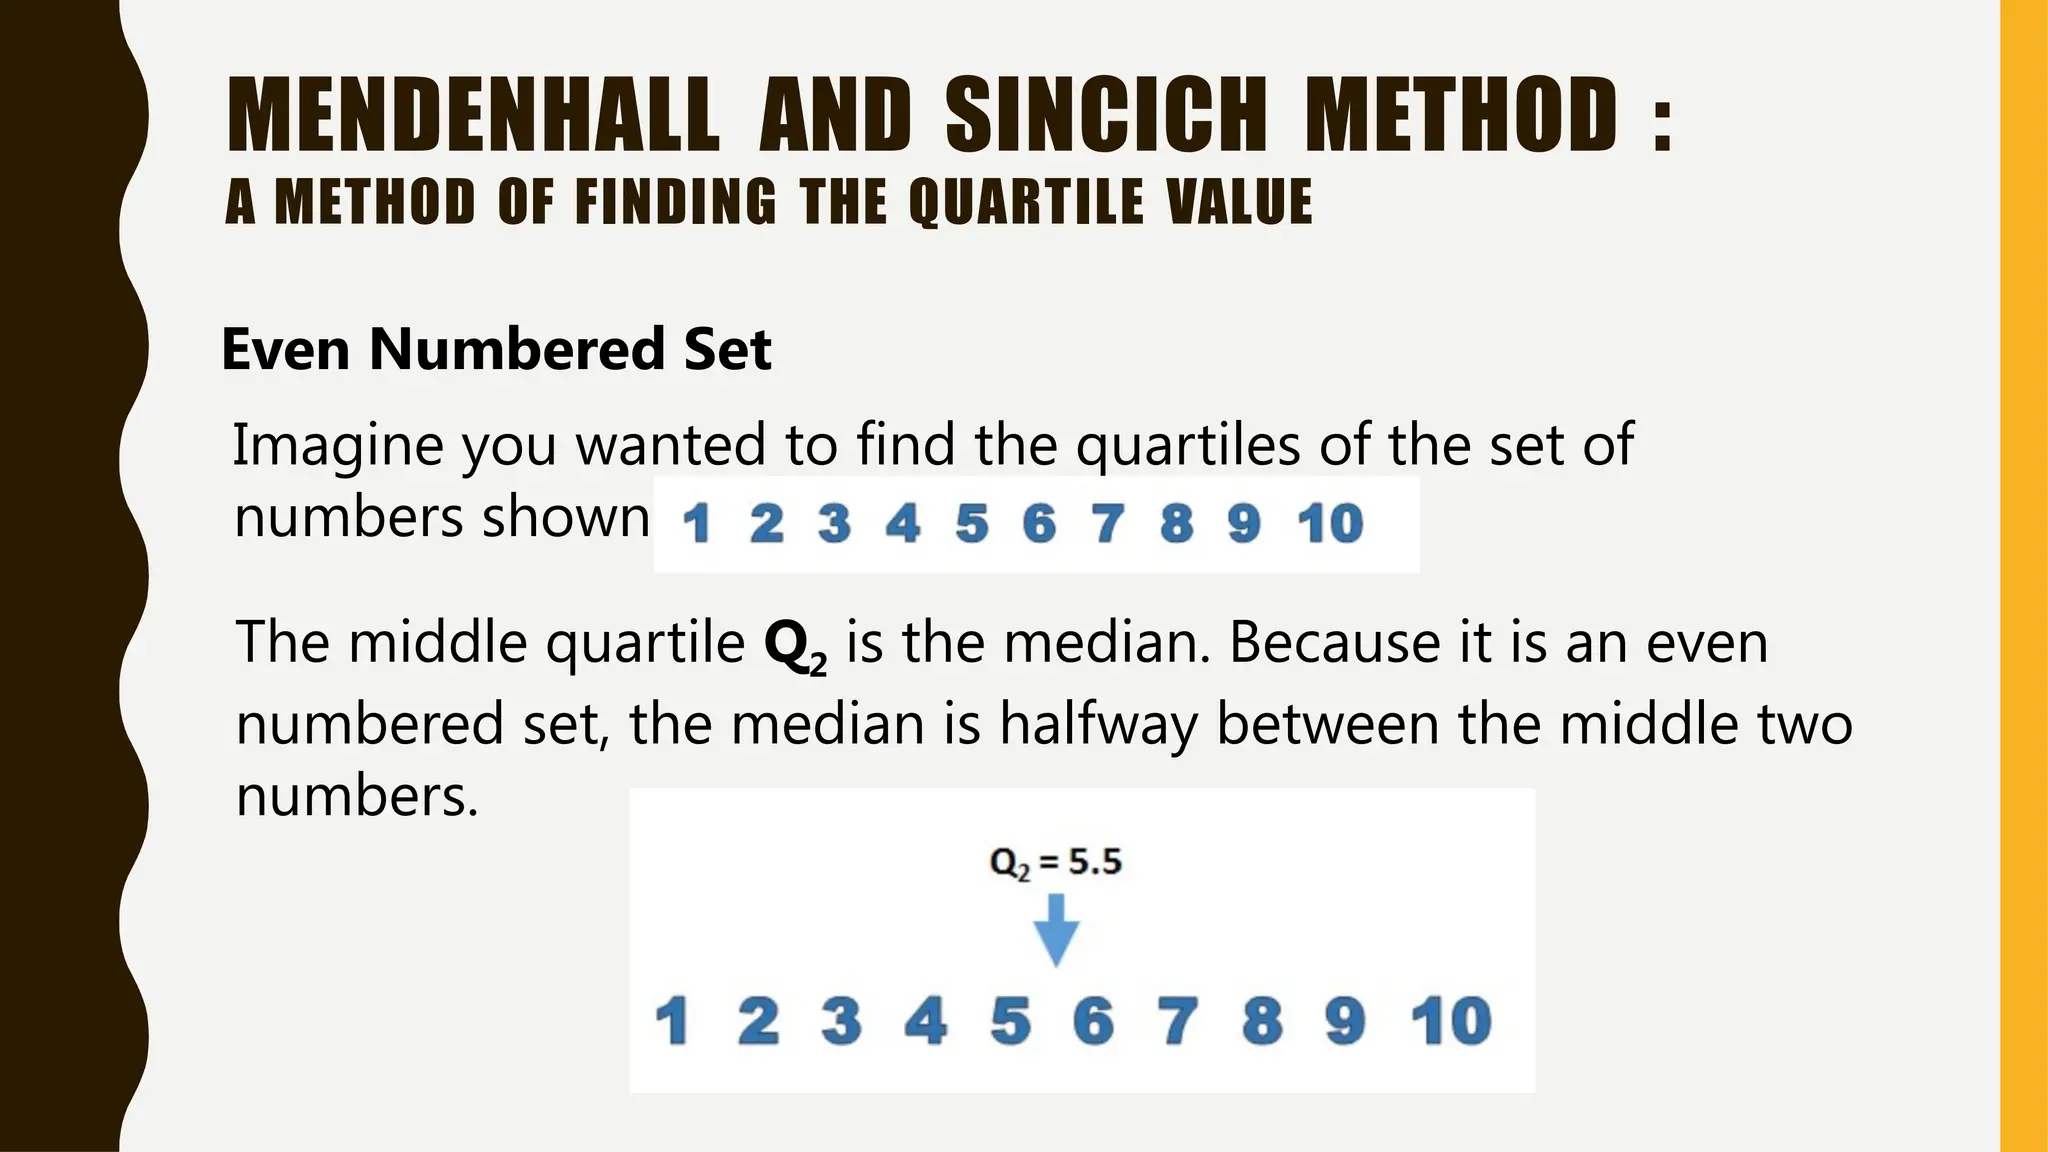
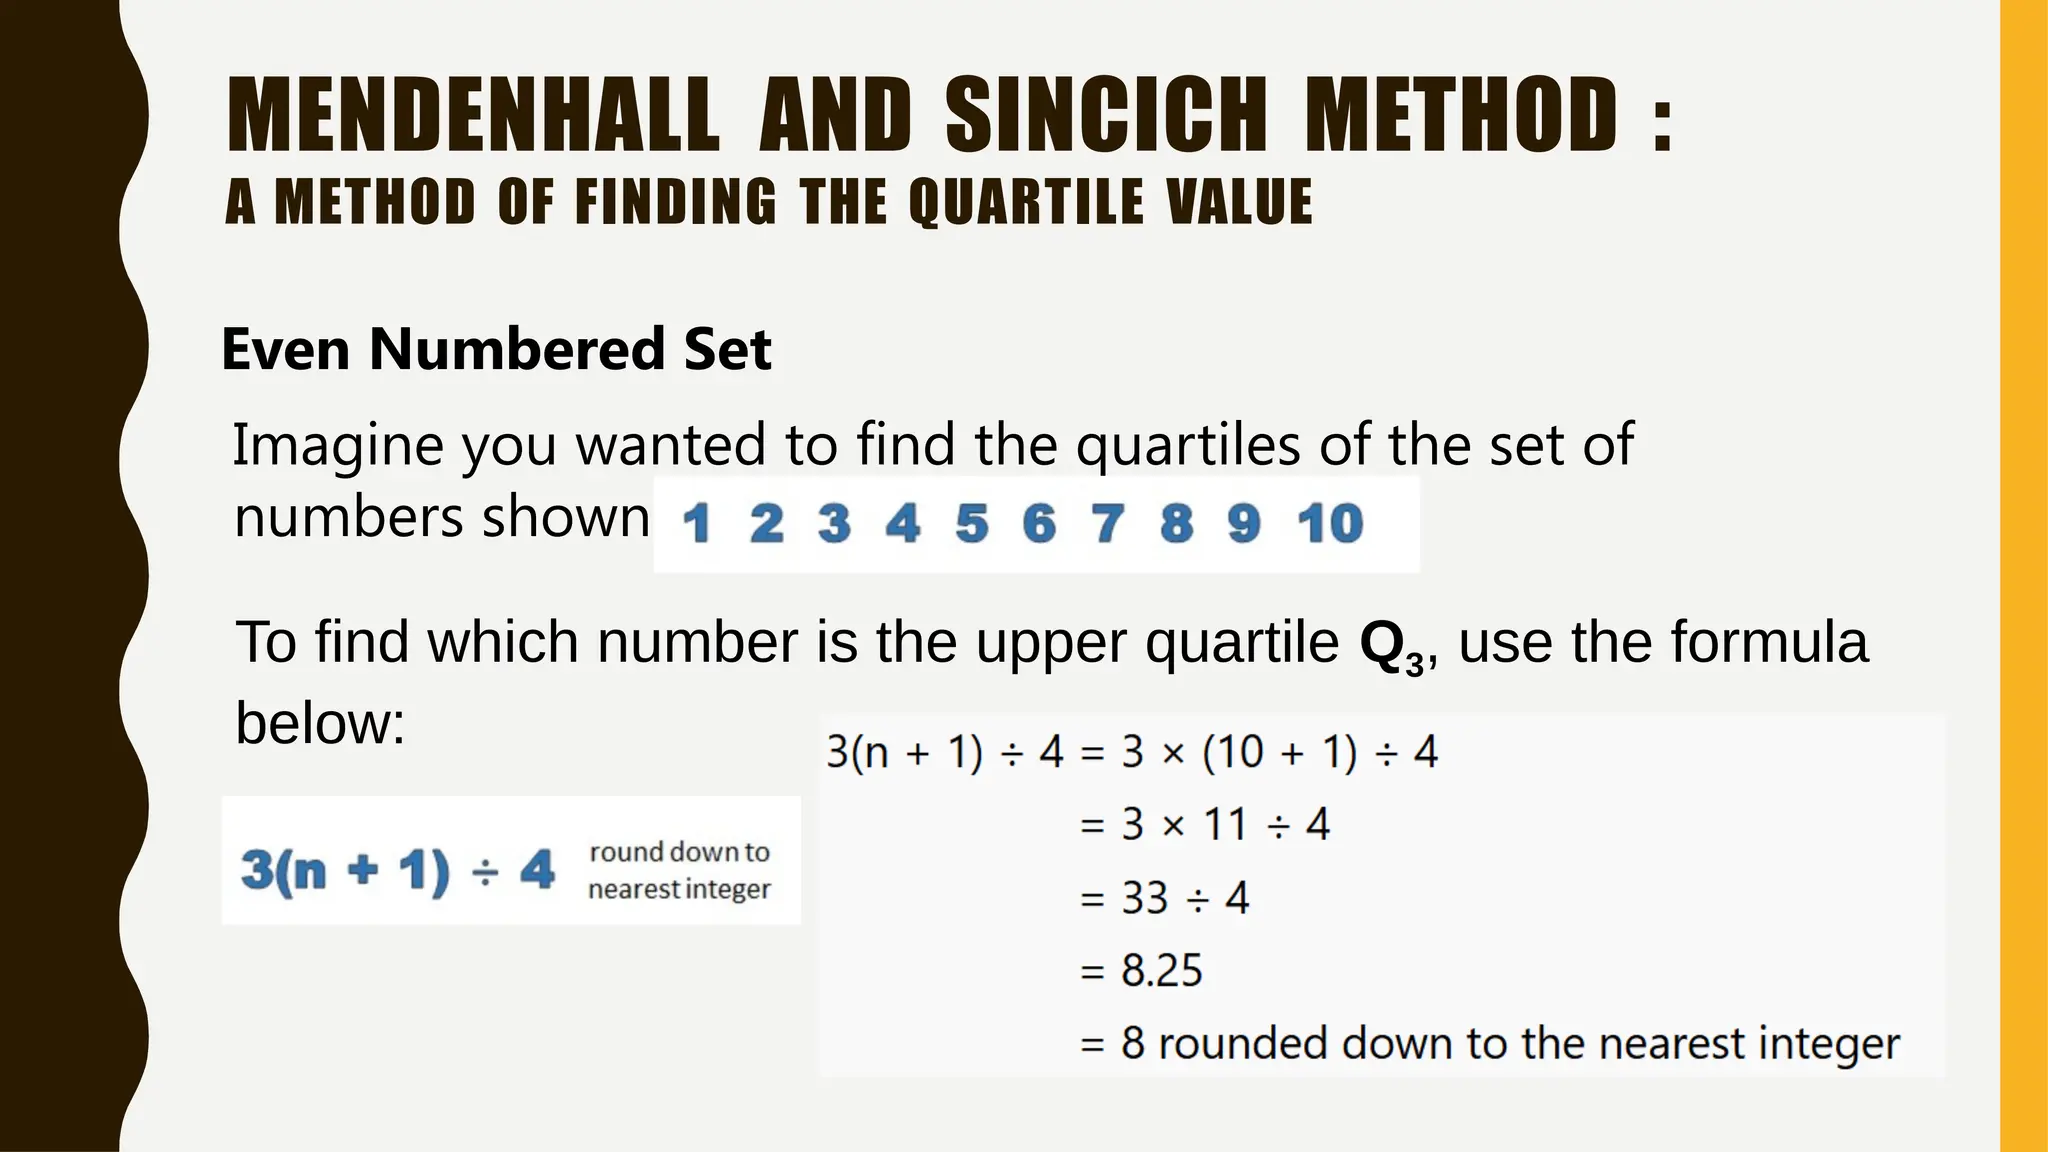
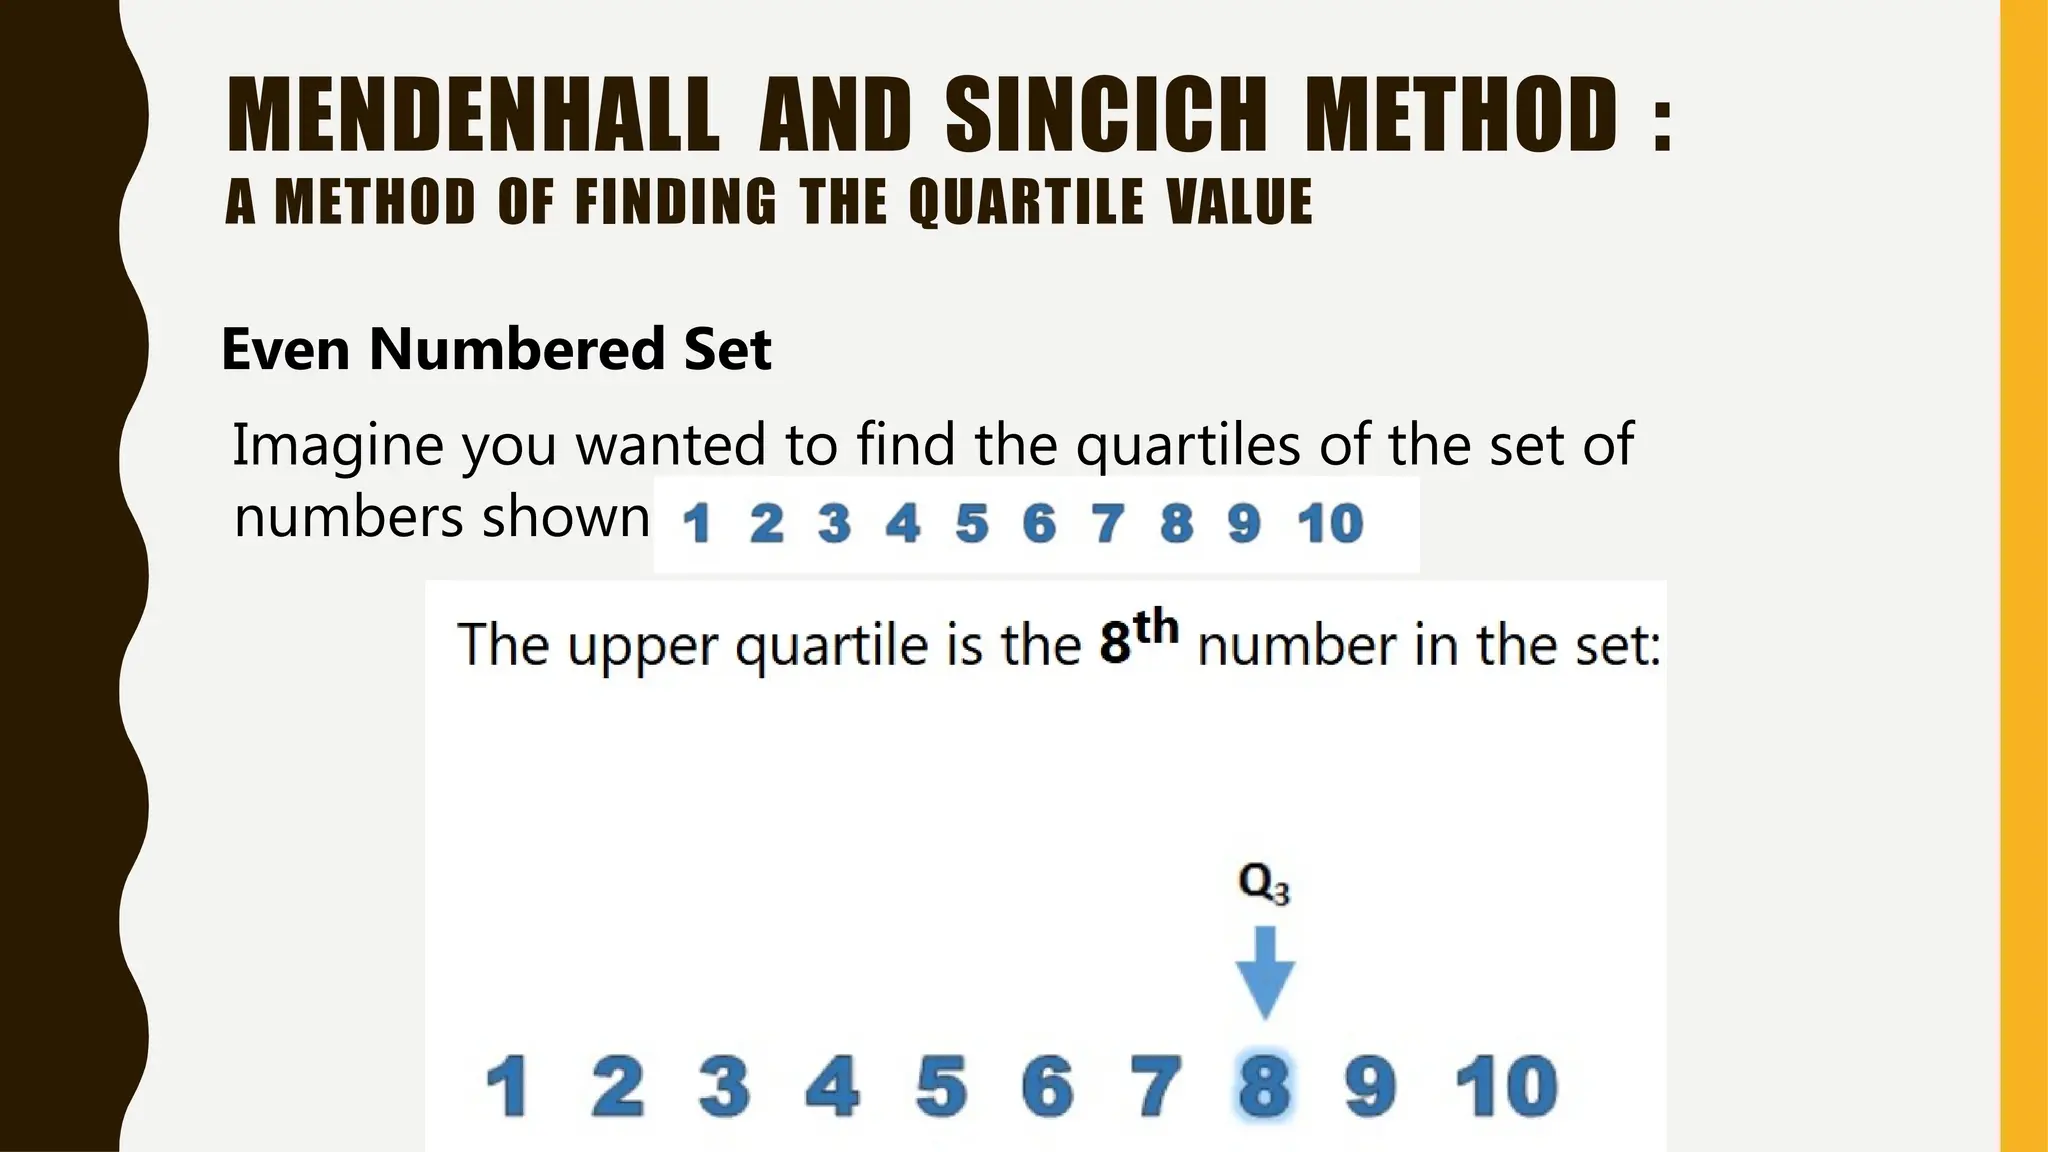
Even Numbered Set
Imagine you wanted to find the quartiles of the set of
numbers shown below:
The middle quartile Q2 is the median. Because it is an even
numbered set, the median is halfway between the middle two
numbers.
42.
MENDENHALL AND SINCICHMETHOD :
A METHOD OF FINDING THE QUARTILE VALUE
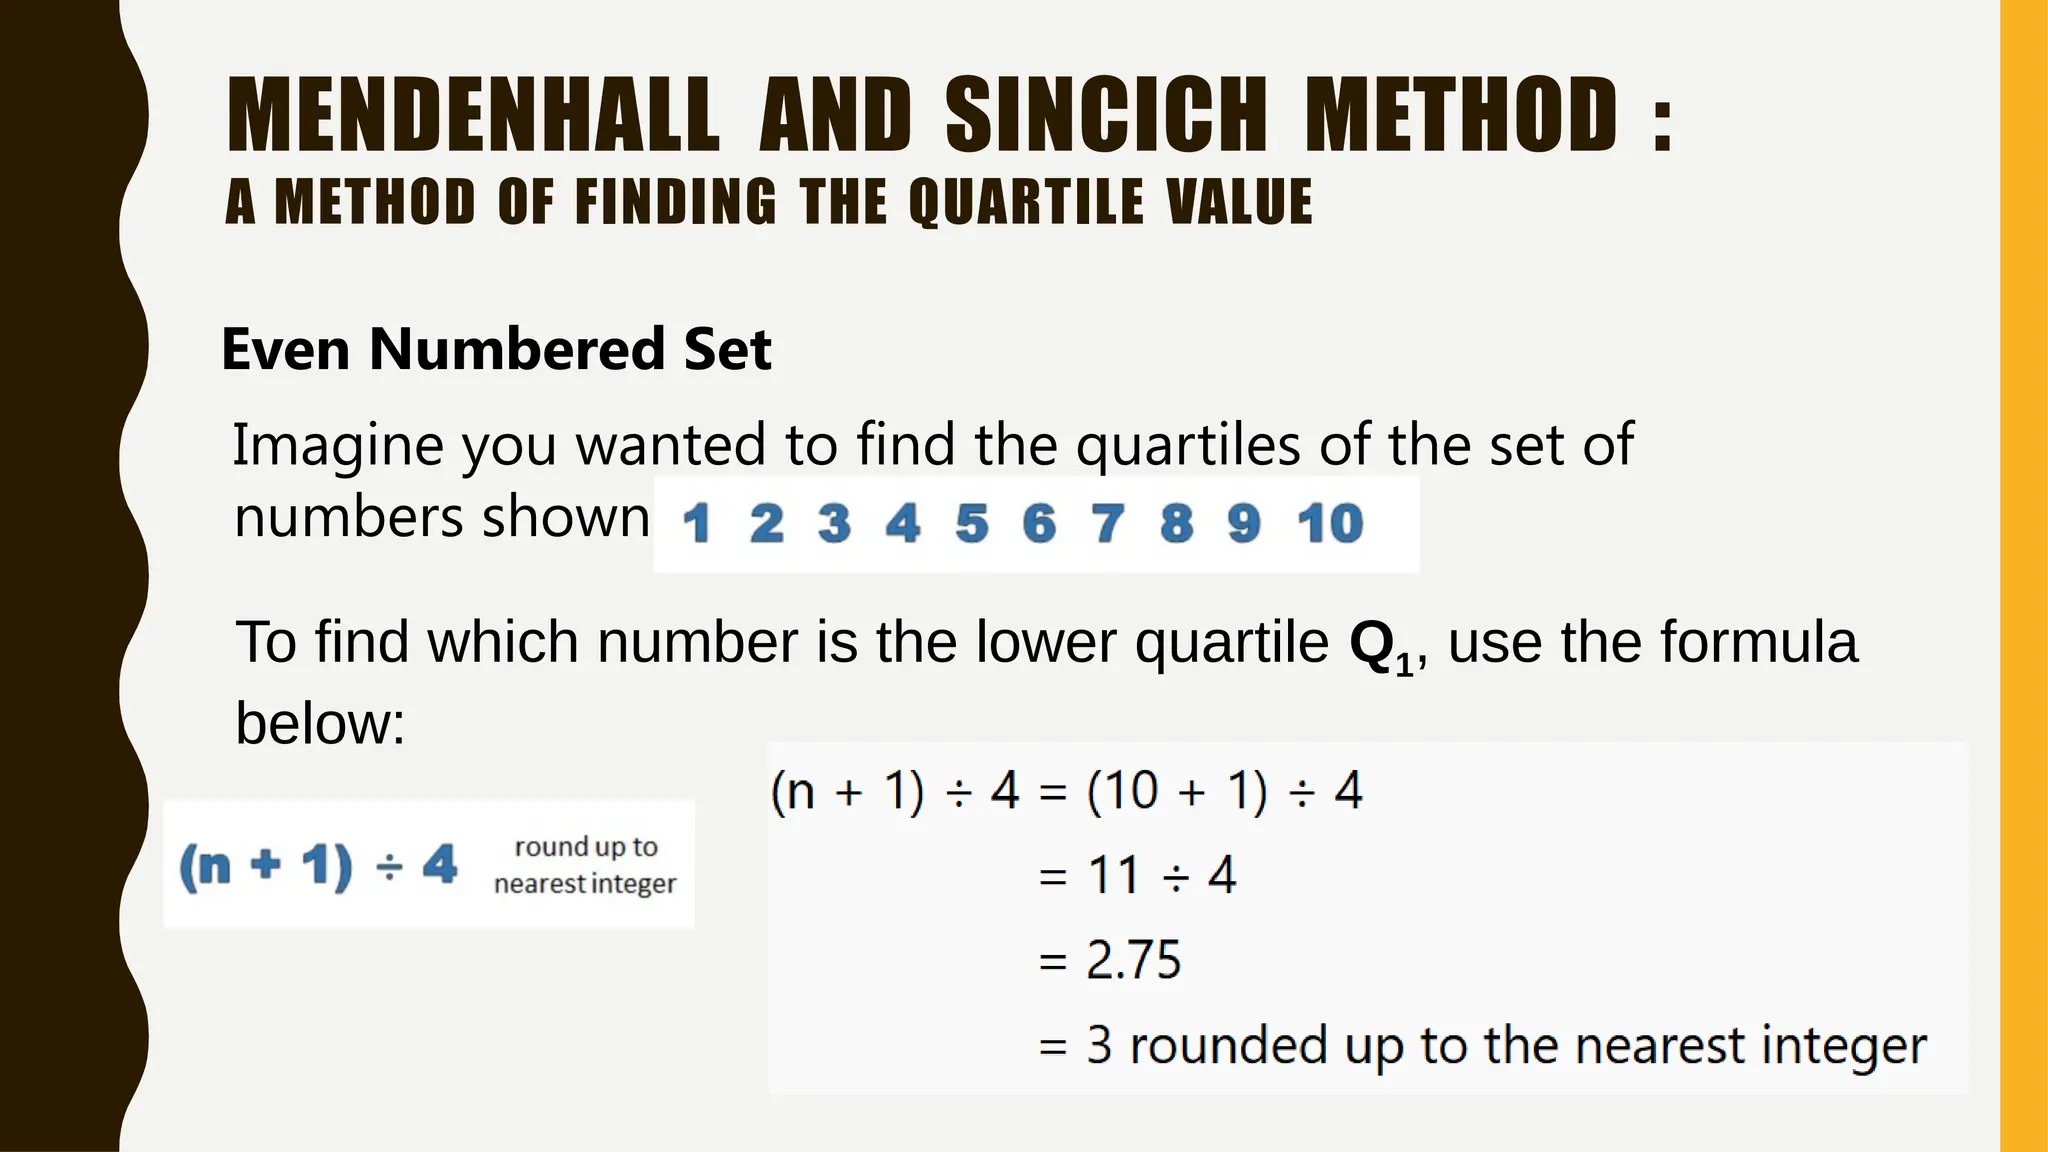
Even Numbered Set
Imagine you wanted to find the quartiles of the set of
numbers shown below:
To find which number is the lower quartile Q1, use the formula
below:
43.
MENDENHALL AND SINCICHMETHOD :
A METHOD OF FINDING THE QUARTILE VALUE
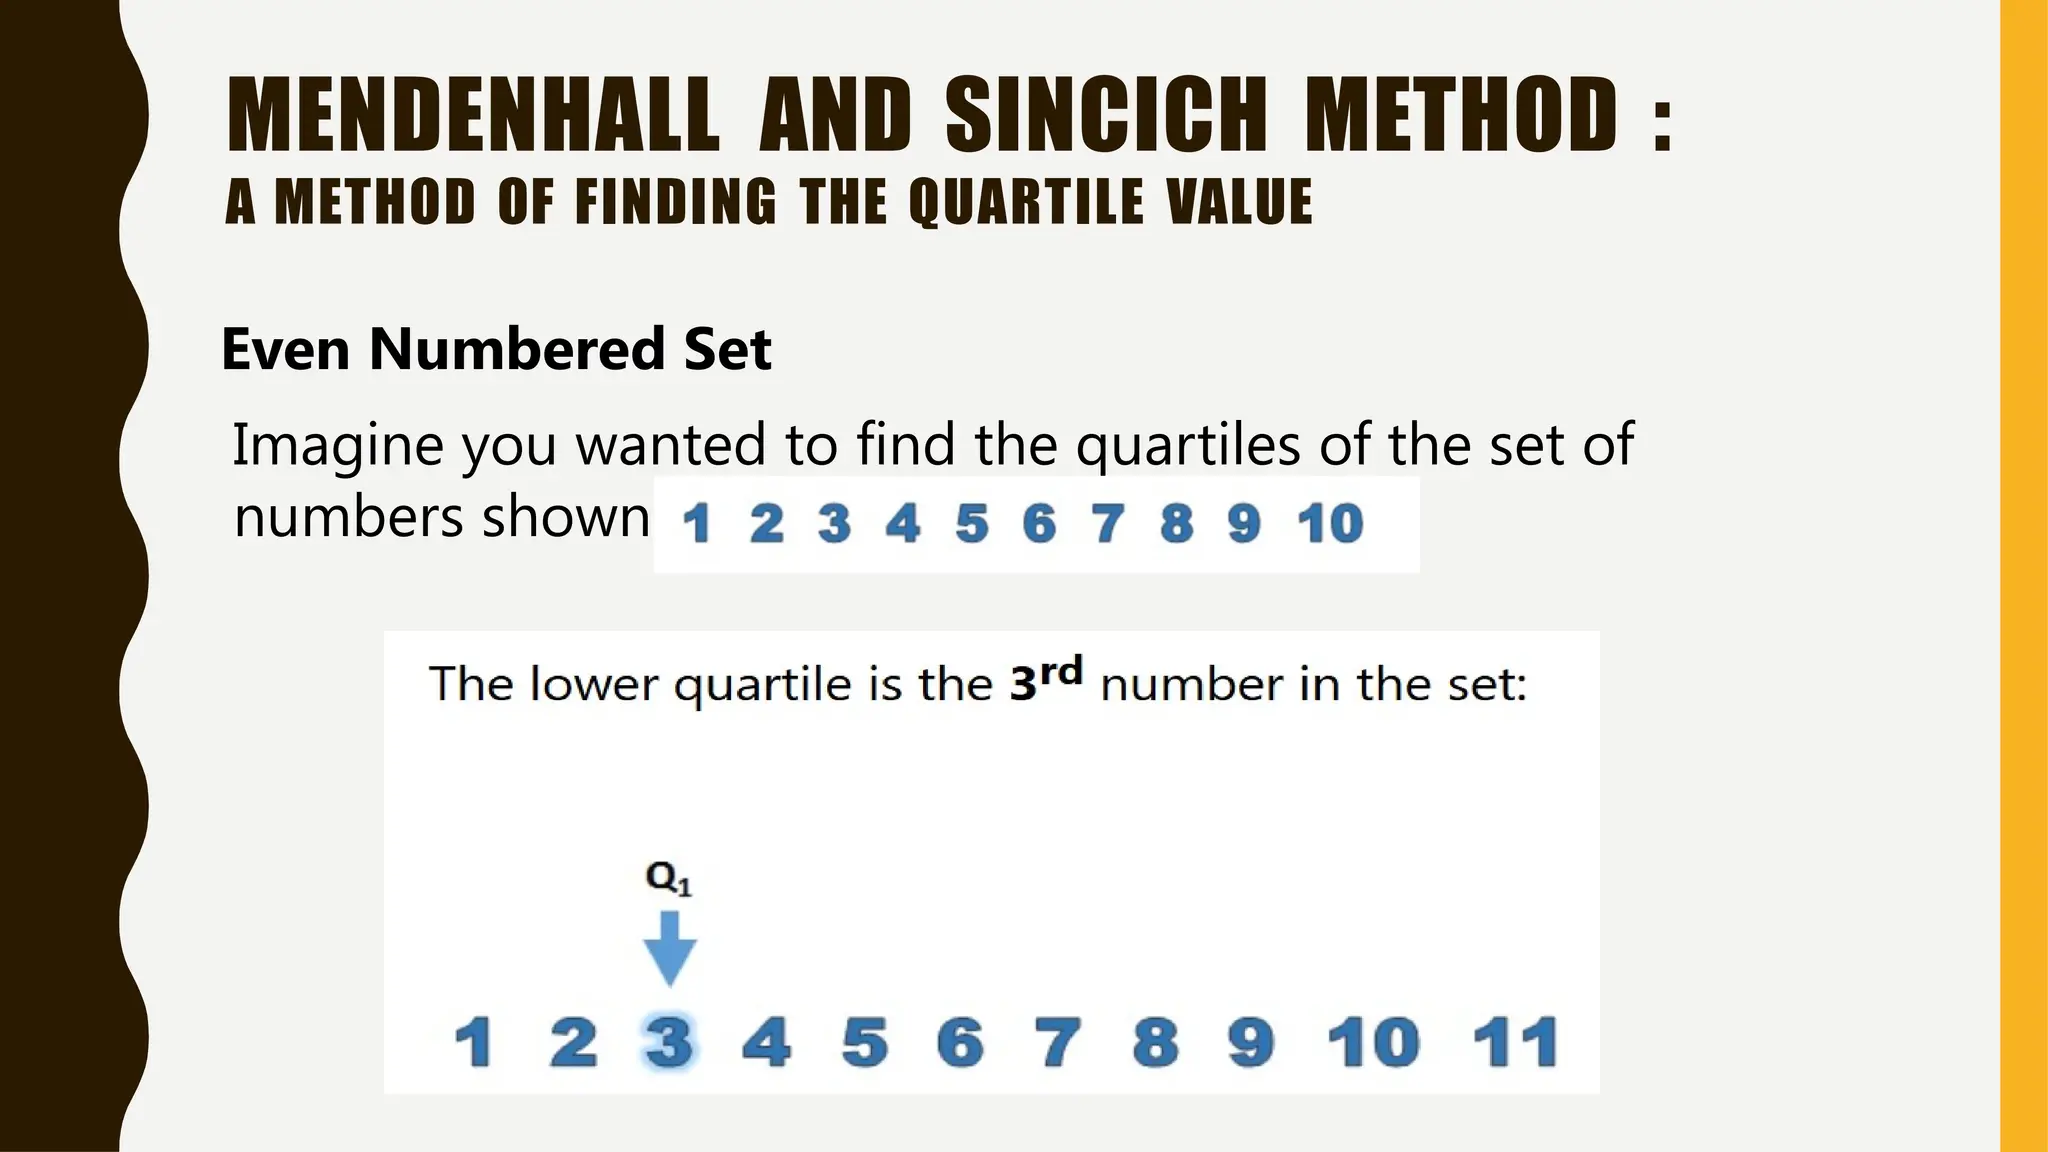
Even Numbered Set
Imagine you wanted to find the quartiles of the set of
numbers shown below:
44.
MENDENHALL AND SINCICHMETHOD :
A METHOD OF FINDING THE QUARTILE VALUE
Even Numbered Set
Imagine you wanted to find the quartiles of the set of
numbers shown below:
To find which number is the upper quartile Q3, use the formula
below:
45.
MENDENHALL AND SINCICHMETHOD :
A METHOD OF FINDING THE QUARTILE VALUE
Even Numbered Set
Imagine you wanted to find the quartiles of the set of
numbers shown below:
46.
QUARTILE
U N GR O U P E D D ATA B Y
L I N E A R
I N T E R P O L AT I O N
47.
Interpolation is anestimation of a
value within two known values in a
sequence of values. Using
interpolation method sometimes (but
not always) produces the same
results.
LINEAR INTERPOLATION
A M ET H O D O F F I N D I N G T H E Q U AR T I L E VAL
UE
48.
LINEAR INTERPOLATION
A METHODOF FINDING THE QUARTILE VALUE
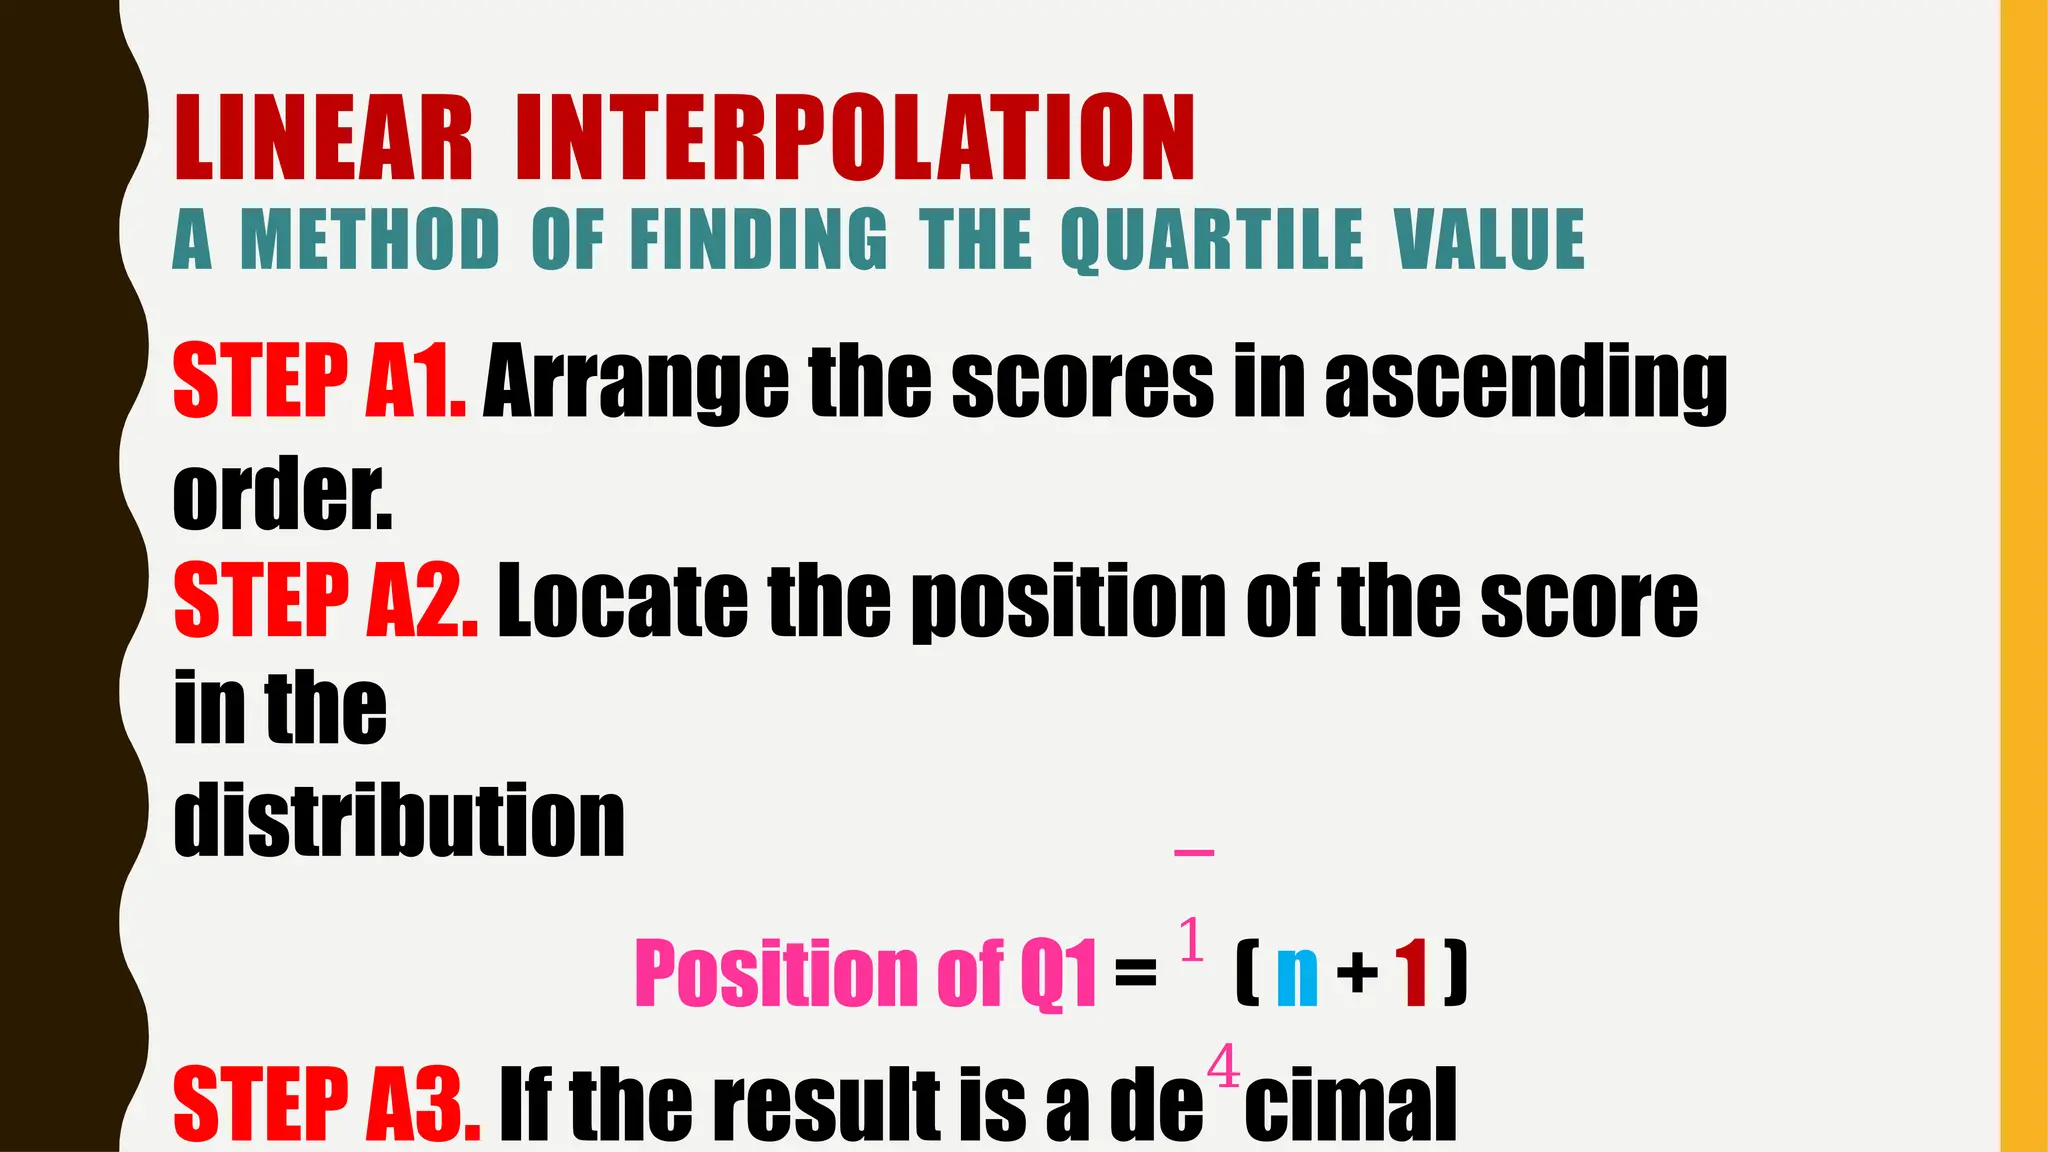
STEP A1. Arrange the scores in ascending
order.
STEP A2. Locate the position of the score
in the
distribution
Position of Q1 =
1
( n + 1 )
STEP A3. If the result is a de
4
cimal
49.
LINEAR INTERPOLATION
A MET H O D O F F I N D I N G T H E Q U AR T I L E VAL
UE
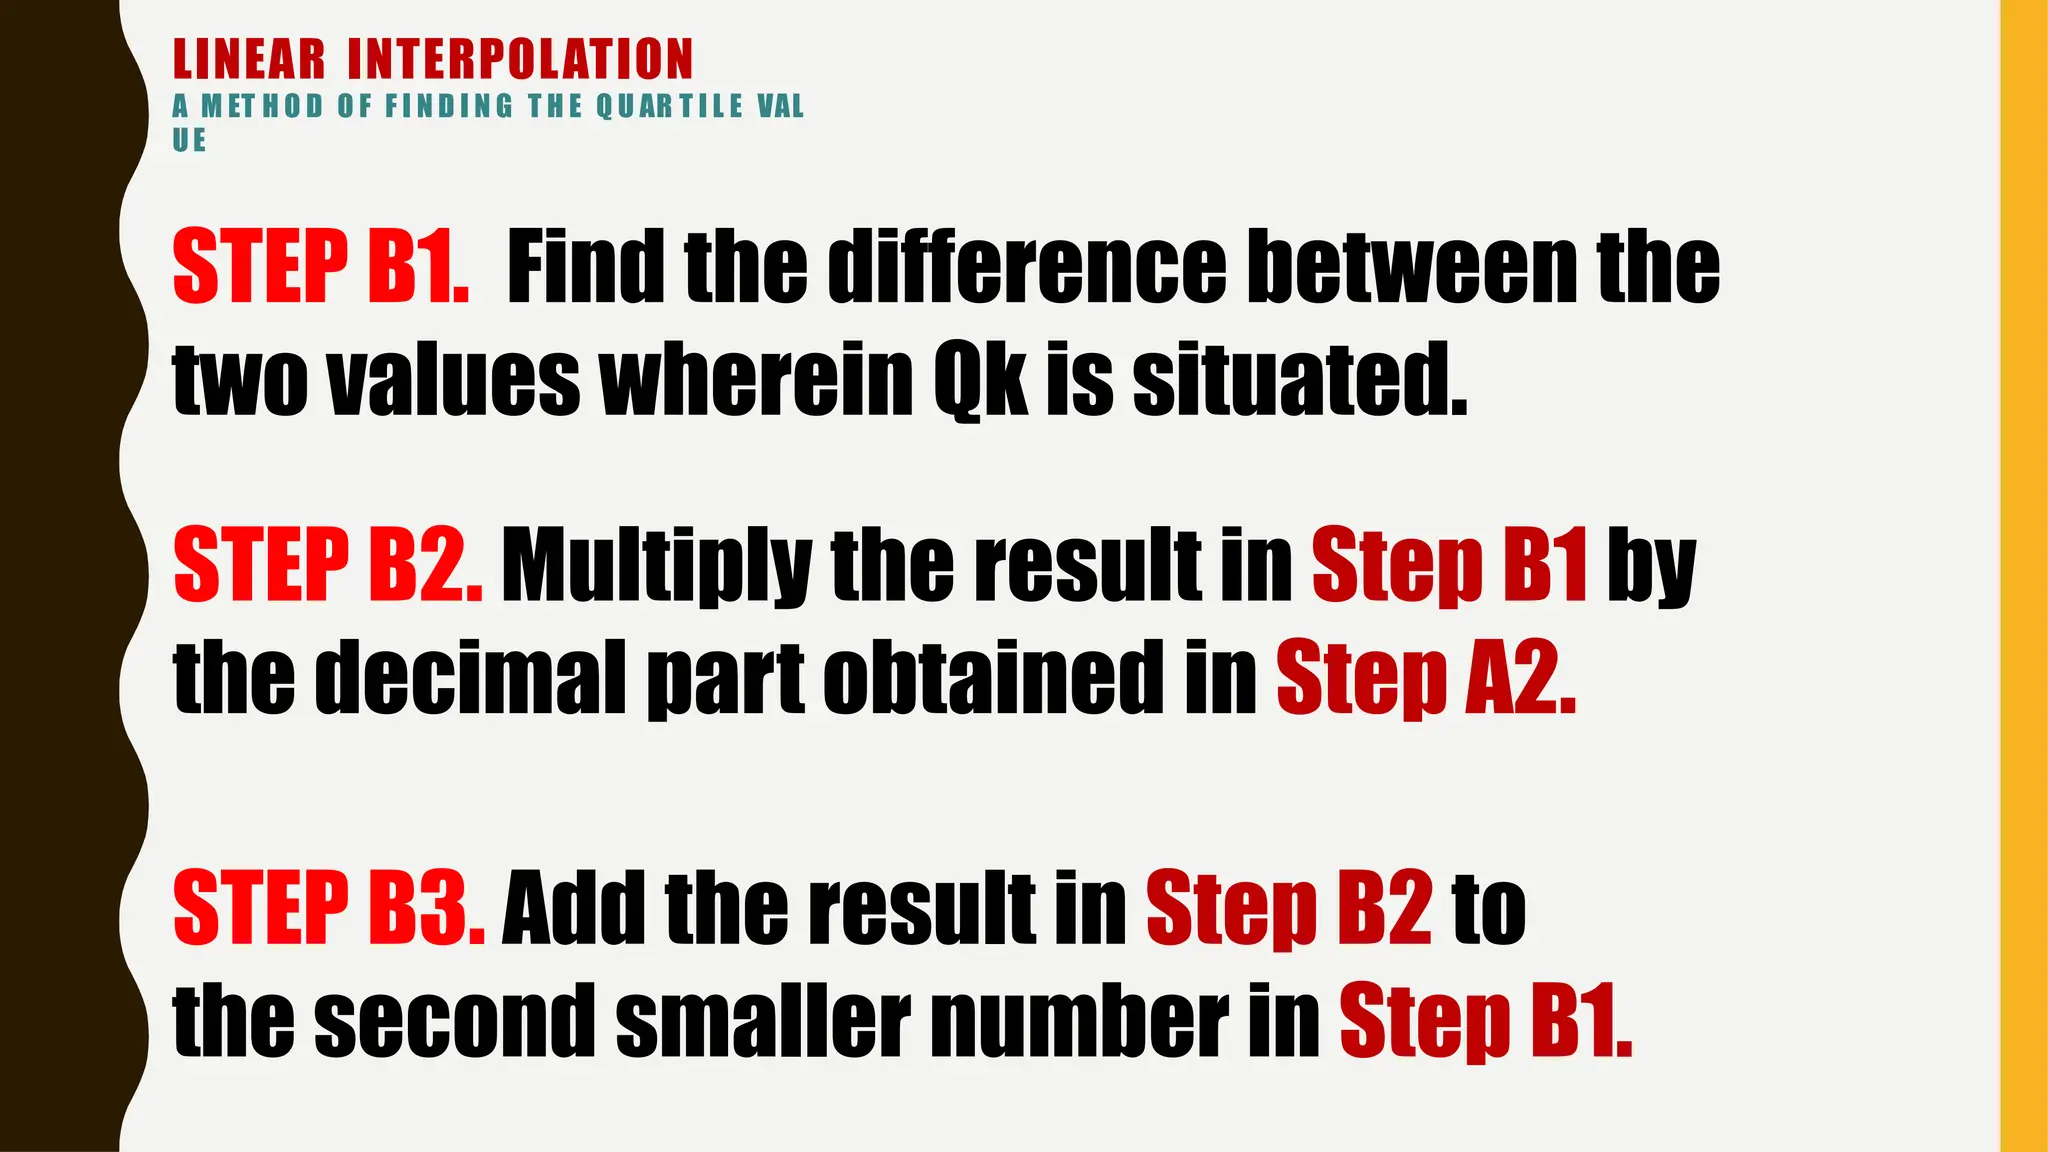
STEP B1. Find the difference between the
two values wherein Qk is situated.
STEP B2. Multiply the result in Step B1 by
the decimal part obtained in Step A2.
STEP B3. Add the result in Step B2 to
the second smaller number in Step B1.
50.
LINEAR INTERPOLATION
A MET H O D O F F I N D I N G T H E Q U AR T I L E VAL
UE
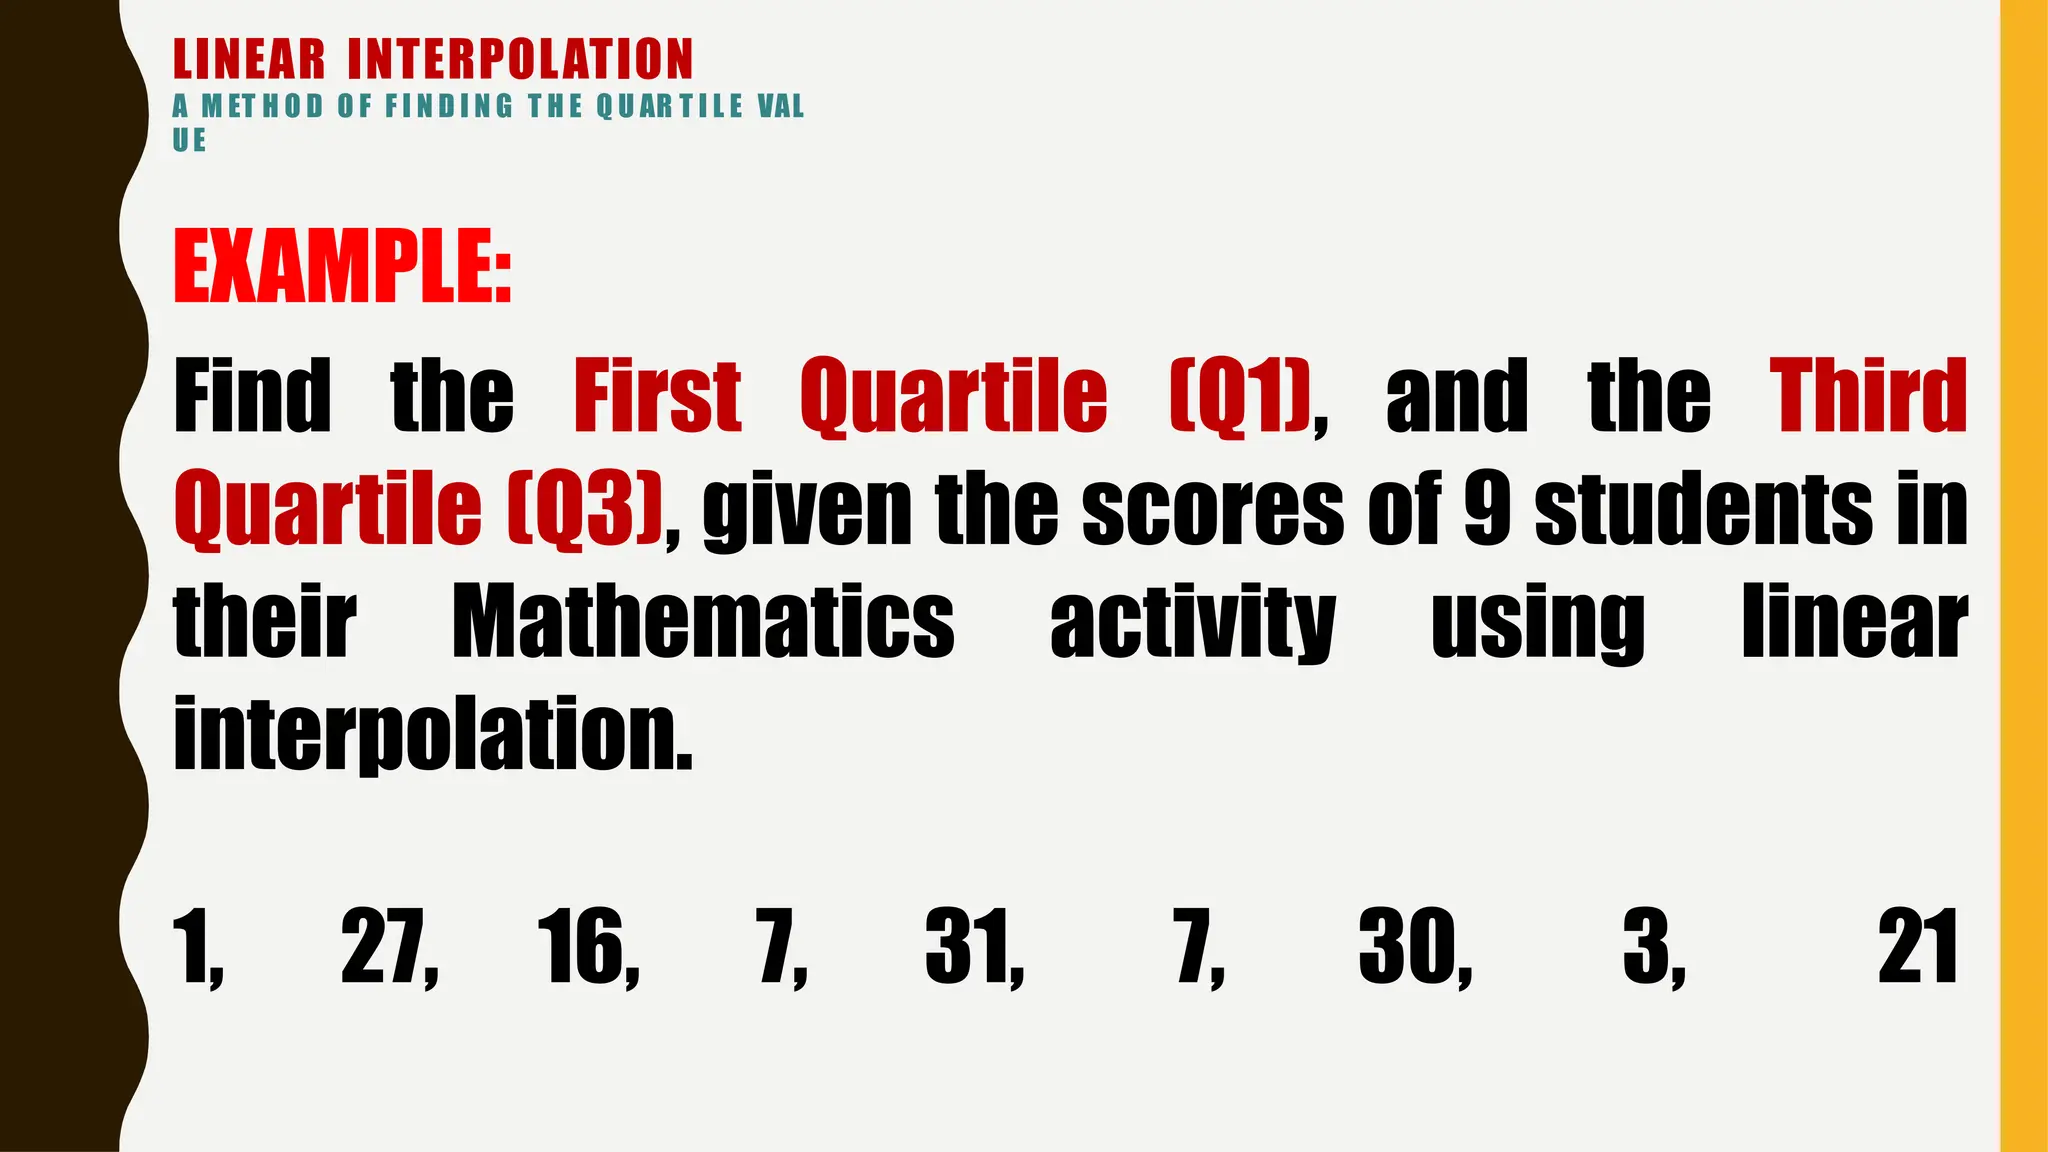
EXAMPLE:
Find the First Quartile (Q1), and the Third
Quartile (Q3), given the scores of 9 students in
their Mathematics activity using linear
interpolation.
1, 27, 16, 7, 31, 7, 30, 3, 21
51.
LINEAR INTERPOLATION
A MET H O D O F F I N D I N G T H E Q U AR T I L E VAL
UE
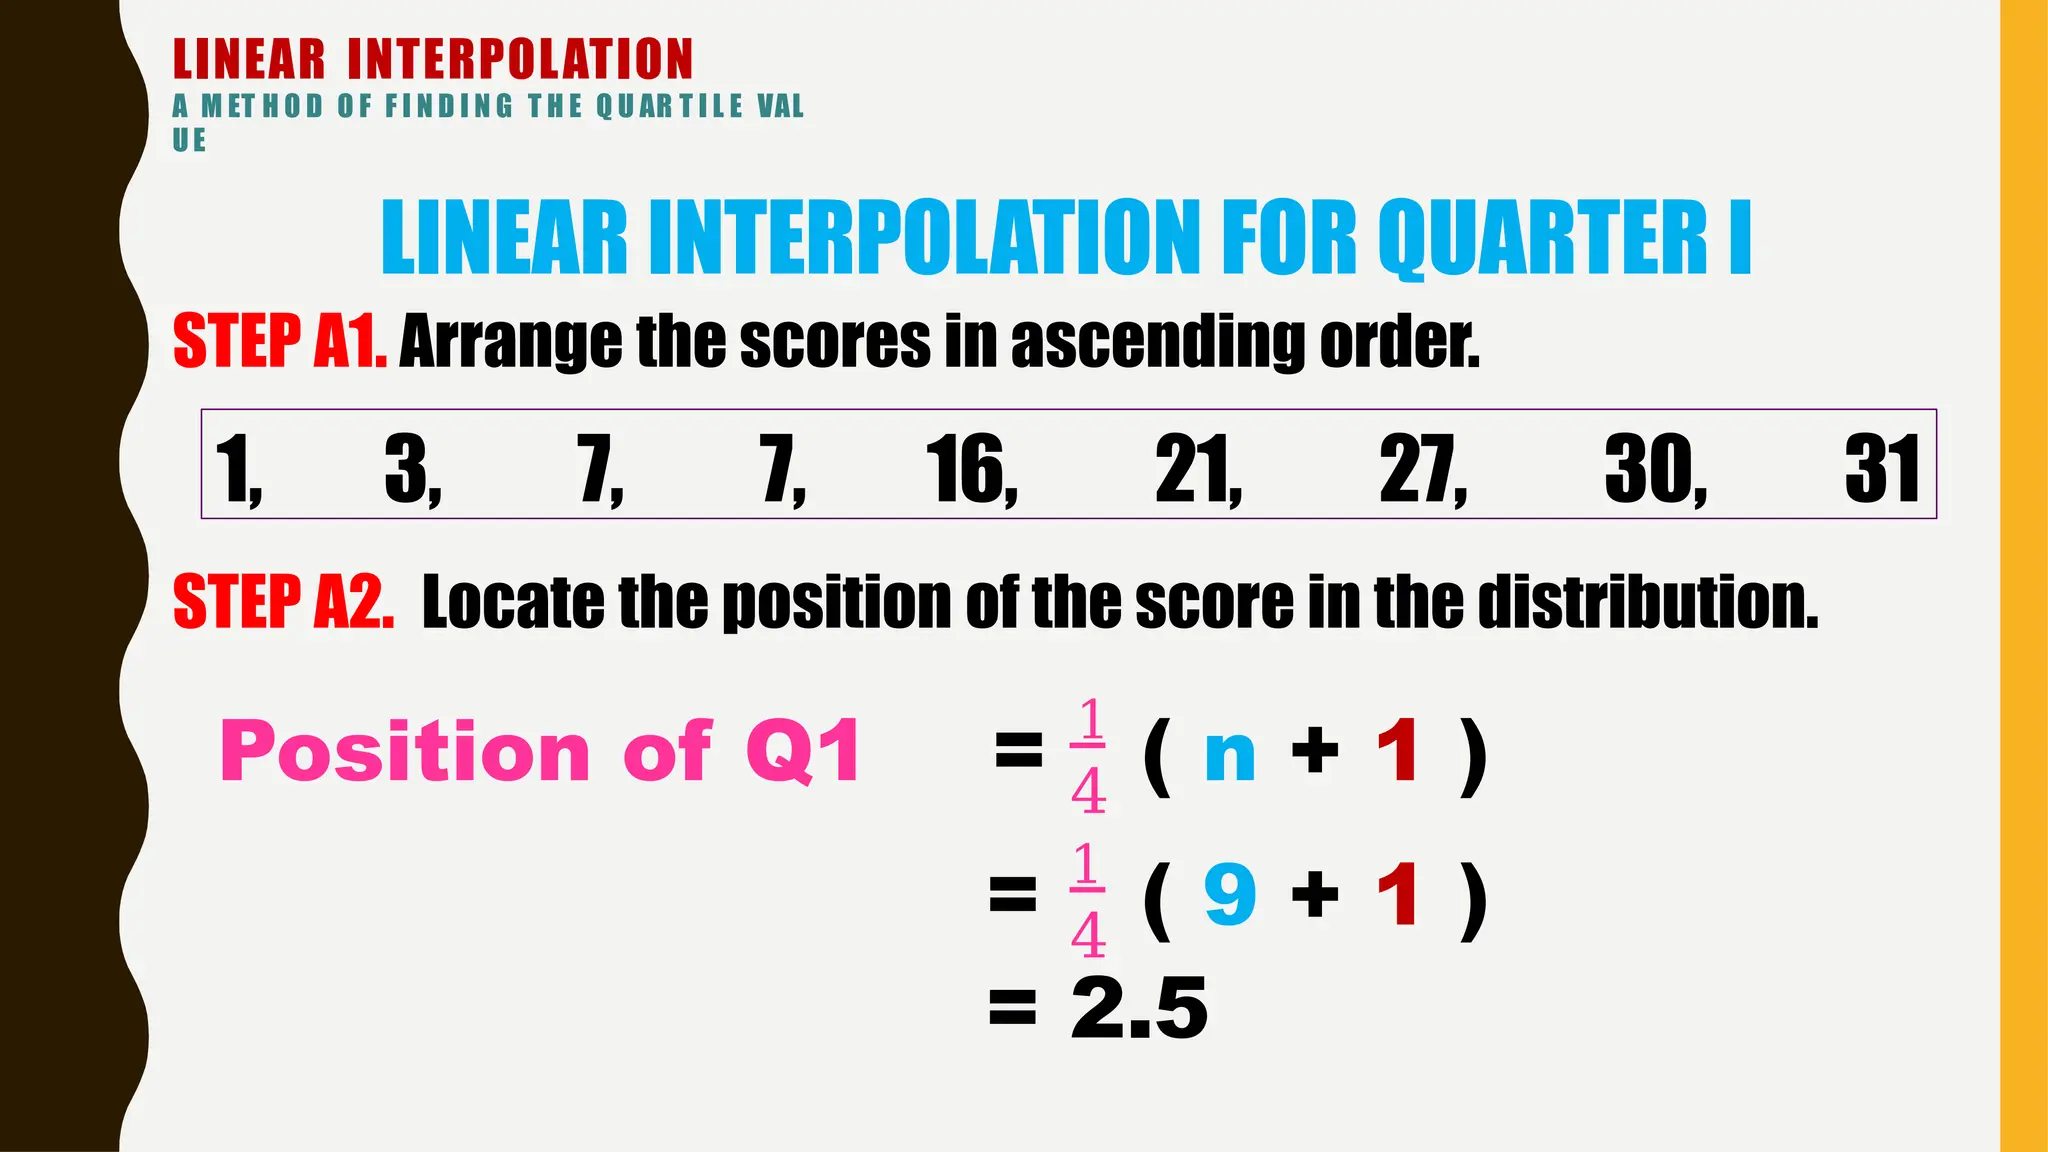
LINEAR INTERPOLATION FOR QUARTER I
1, 3, 7, 7, 16, 21, 27, 30, 31
STEP A1. Arrange the scores in ascending order.
STEP A2. Locate the position of the score in the distribution.
4
Position of Q1 = 1
( n + 1 )
4
= 1
( 9 + 1 )
= 2.5
52.
LINEAR INTERPOLATION
A MET H O D O F F I N D I N G T H E Q U AR T I L E VAL
UE
LINEAR INTERPOLATION FOR QUARTER I
27, 30, 31
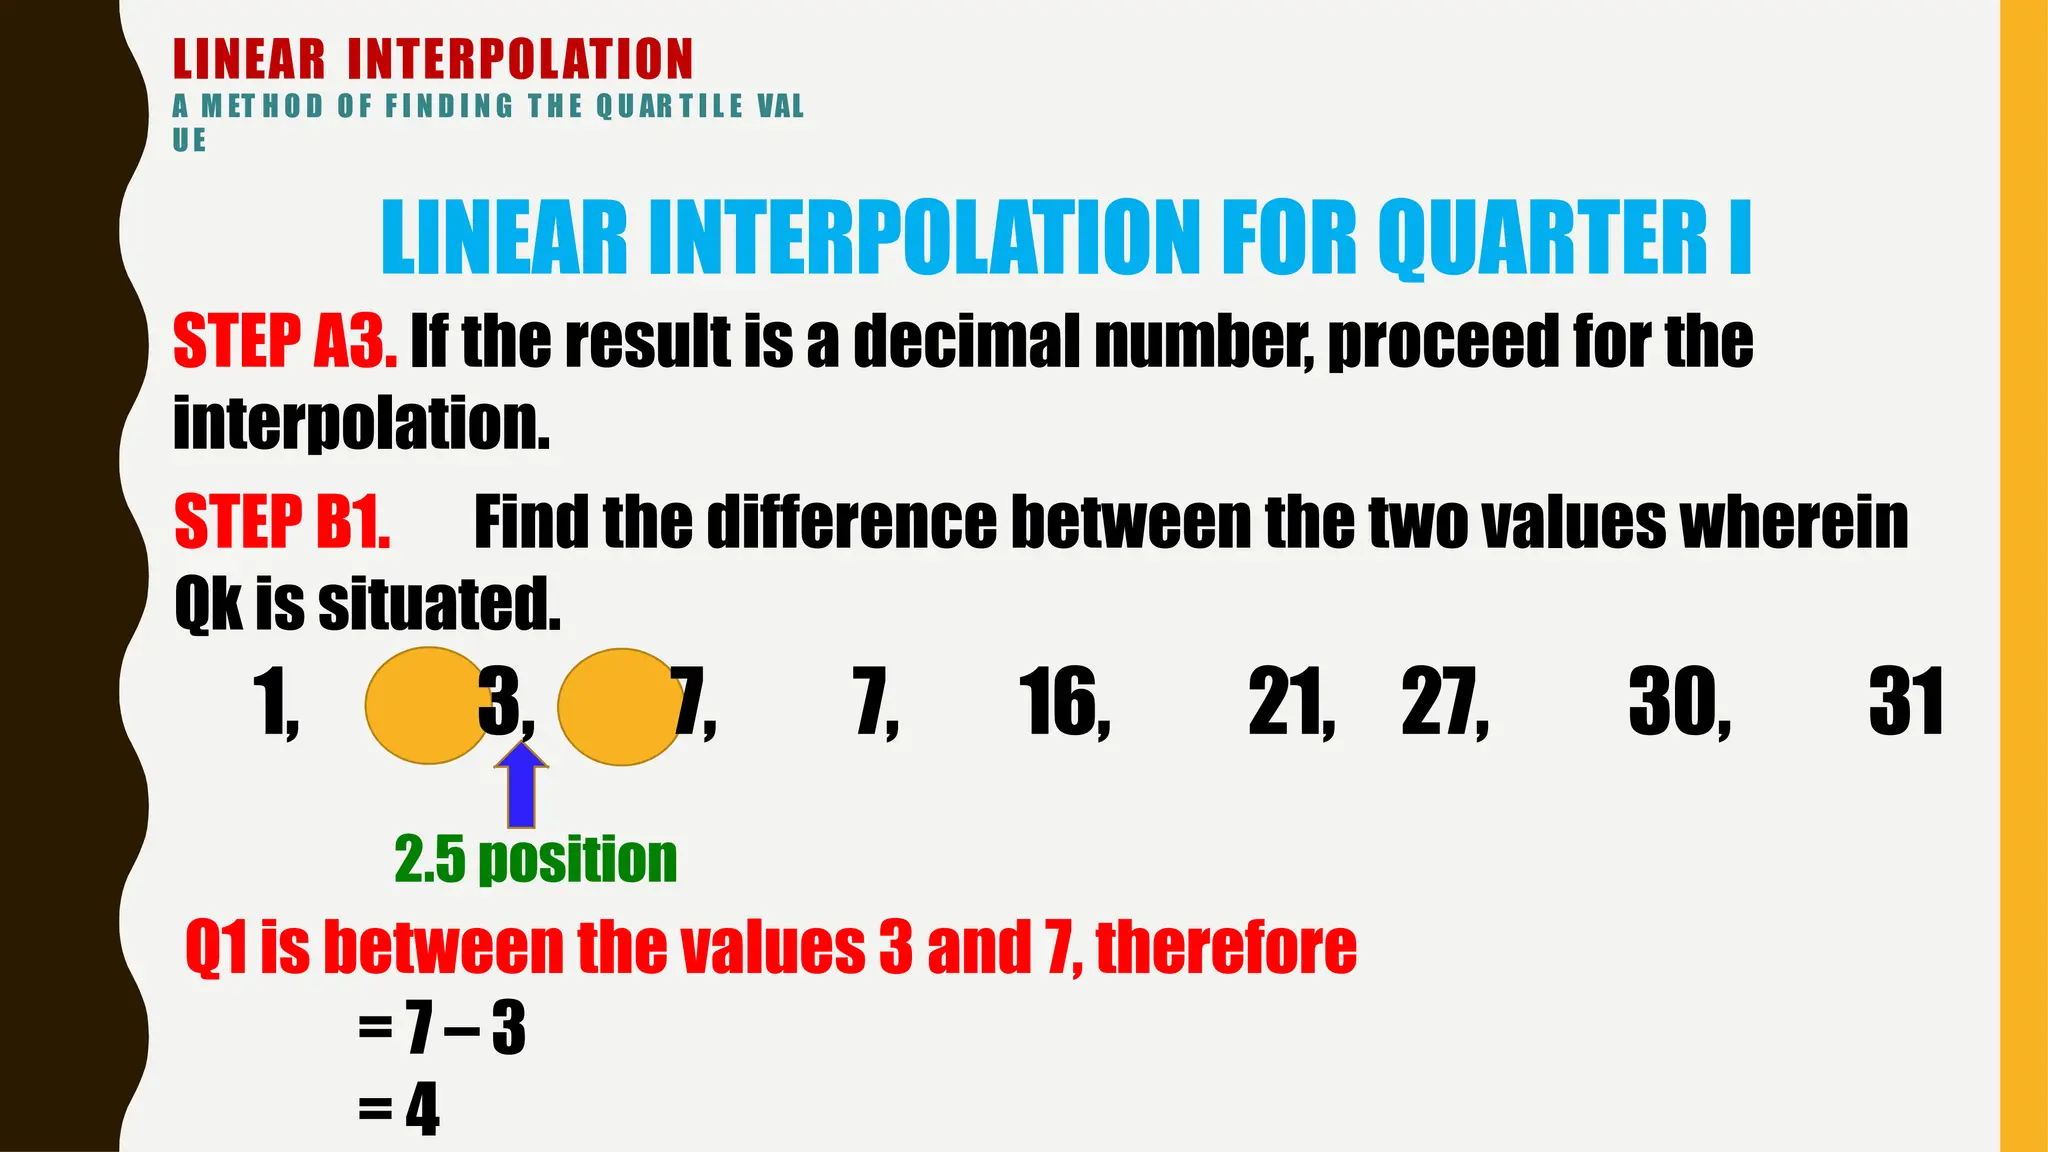
STEP A3. If the result is a decimal number, proceed for the
interpolation.
STEP B1. Find the difference between the two values wherein
Qk is situated.
1, 3, 7, 7, 16, 21,
2.5 position
Q1 is between the values 3 and 7, therefore
= 7 – 3
= 4
53.
LINEAR INTERPOLATION
A MET H O D O F F I N D I N G T H E Q U AR T I L E VAL
UE
LINEAR INTERPOLATION FOR QUARTER I
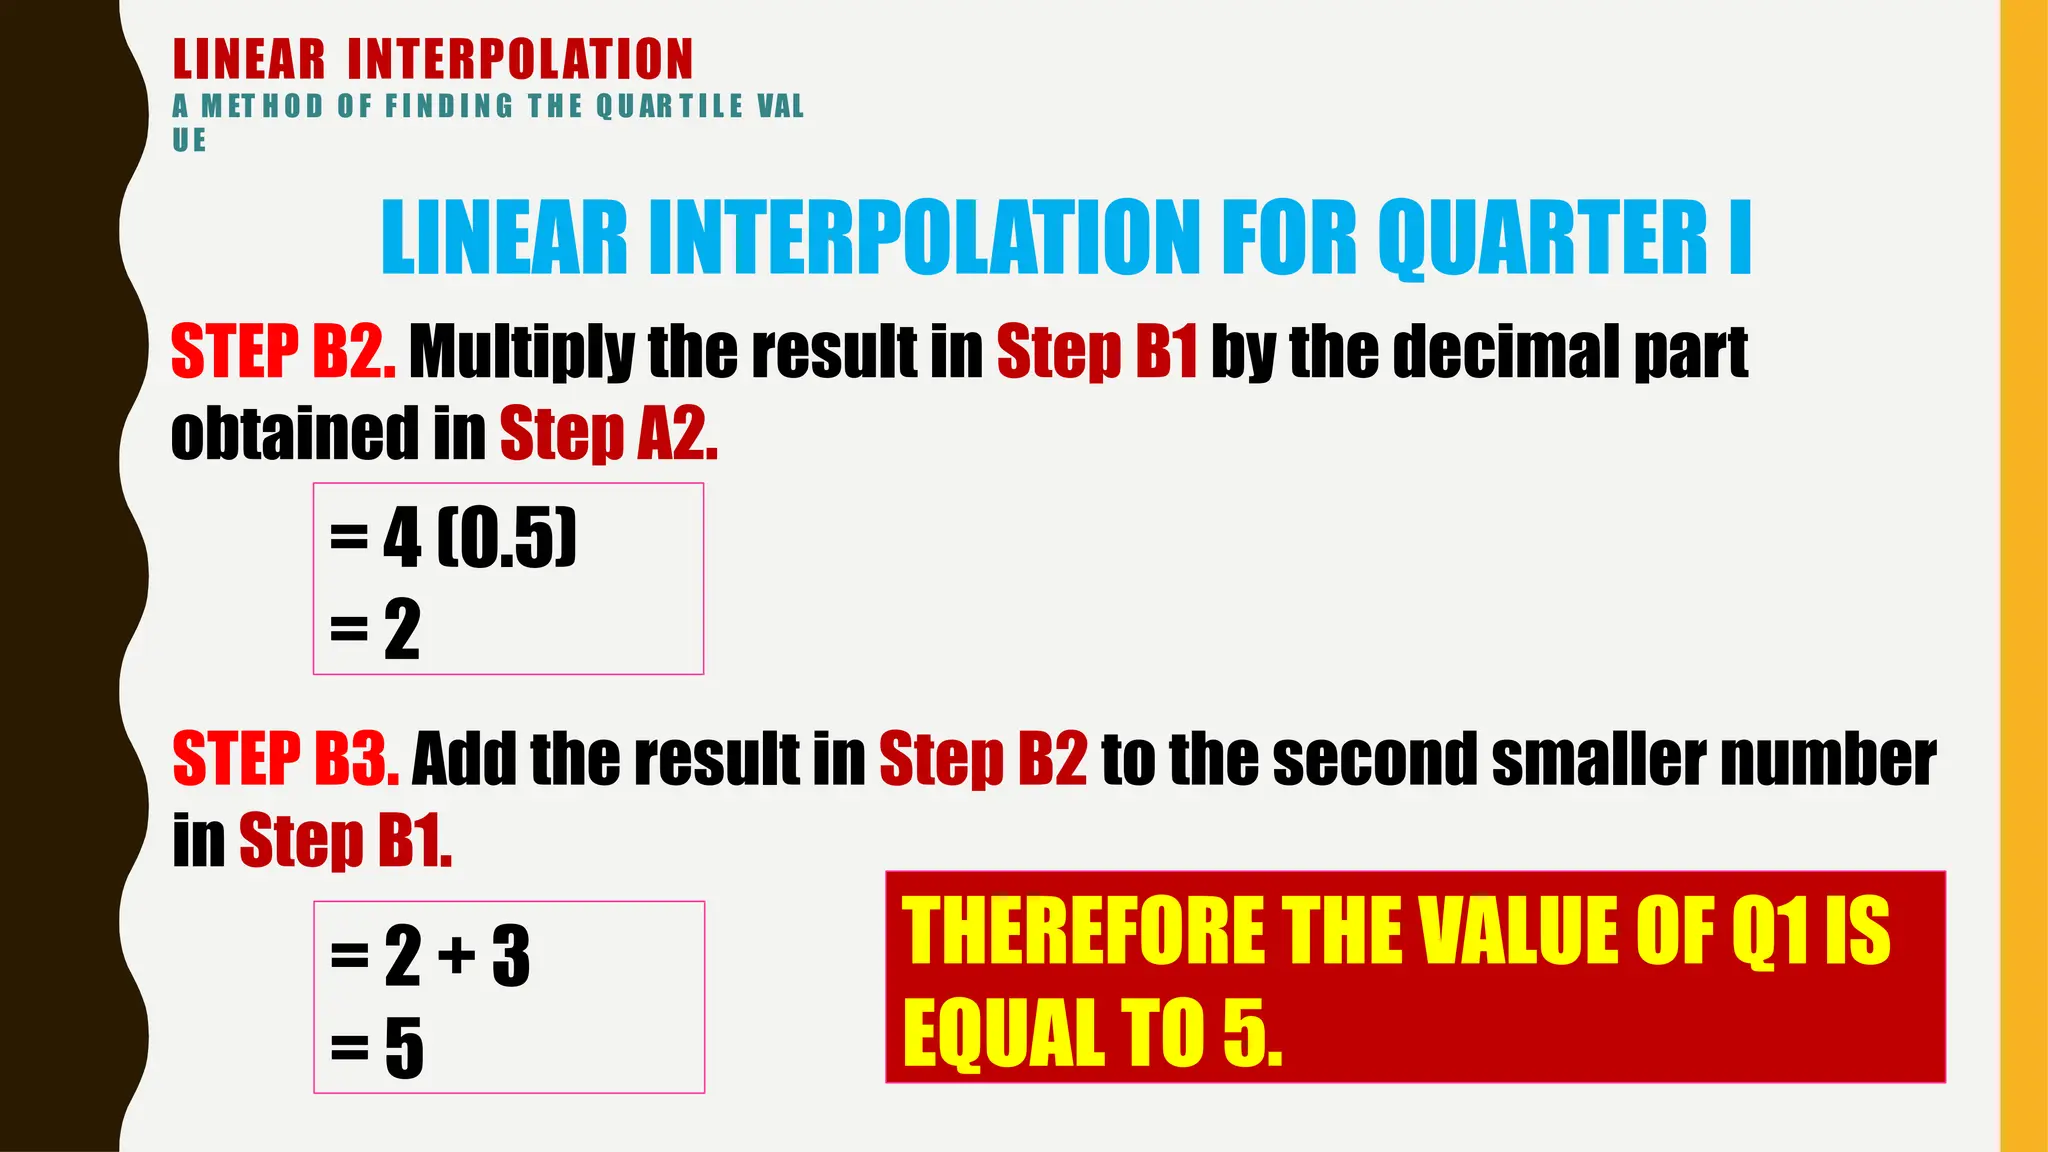
= 4 (0.5)
= 2
STEP B2. Multiply the result in Step B1 by the decimal part
obtained in Step A2.
STEP B3. Add the result in Step B2 to the second smaller number
in Step B1.
= 2 + 3
= 5
THEREFORE THE VALUE OF Q1 IS
EQUAL TO 5.
54.
LINEAR INTERPOLATION
A MET H O D O F F I N D I N G T H E Q U AR T I L E VAL
UE
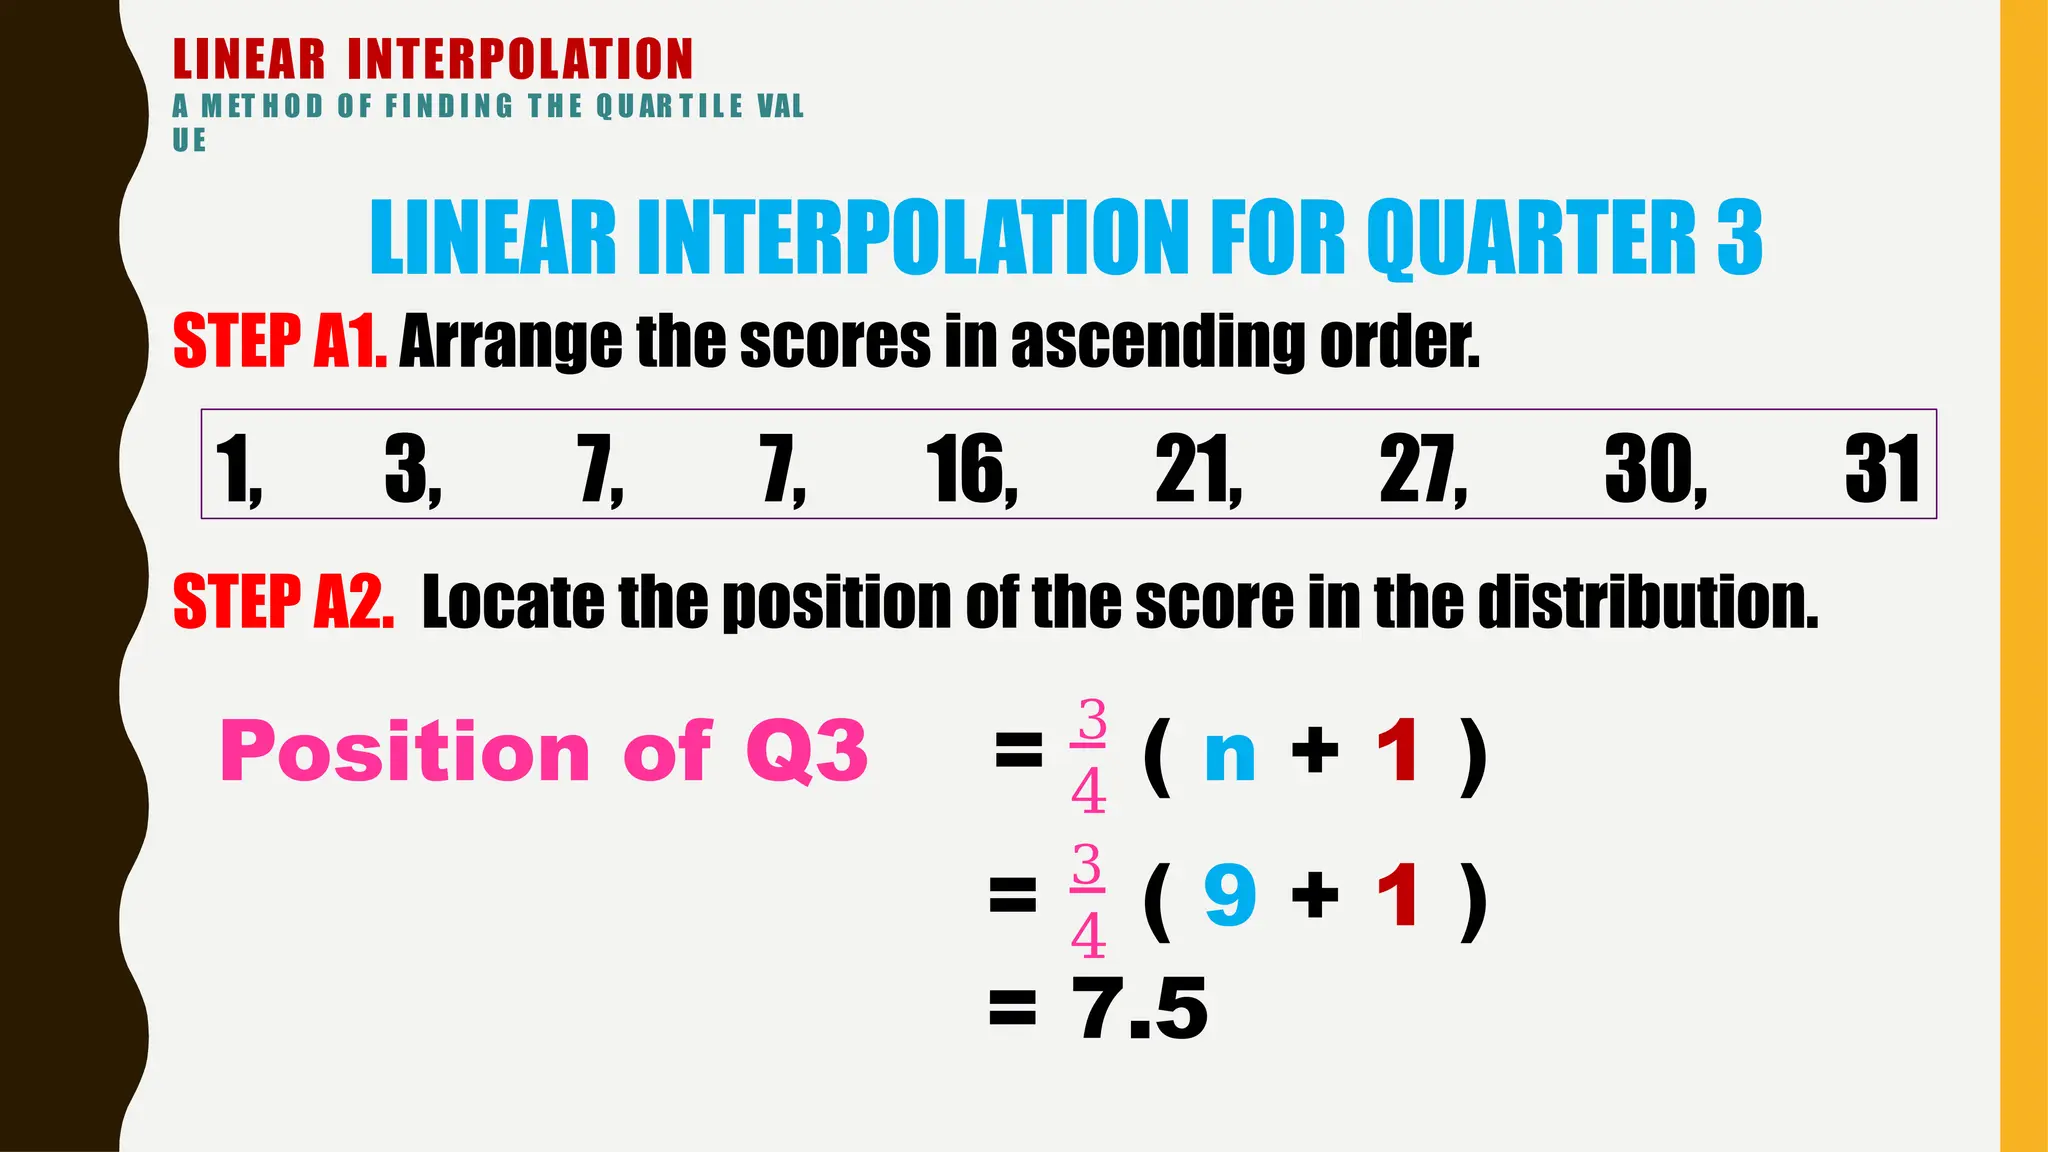
LINEAR INTERPOLATION FOR QUARTER 3
1, 3, 7, 7, 16, 21, 27, 30, 31
STEP A1. Arrange the scores in ascending order.
STEP A2. Locate the position of the score in the distribution.
4
Position of Q3 = 3
( n + 1 )
4
= 3
( 9 + 1 )
= 7.5
55.
LINEAR INTERPOLATION
A MET H O D O F F I N D I N G T H E Q U AR T I L E VAL
UE
LINEAR INTERPOLATION FOR QUARTER 3
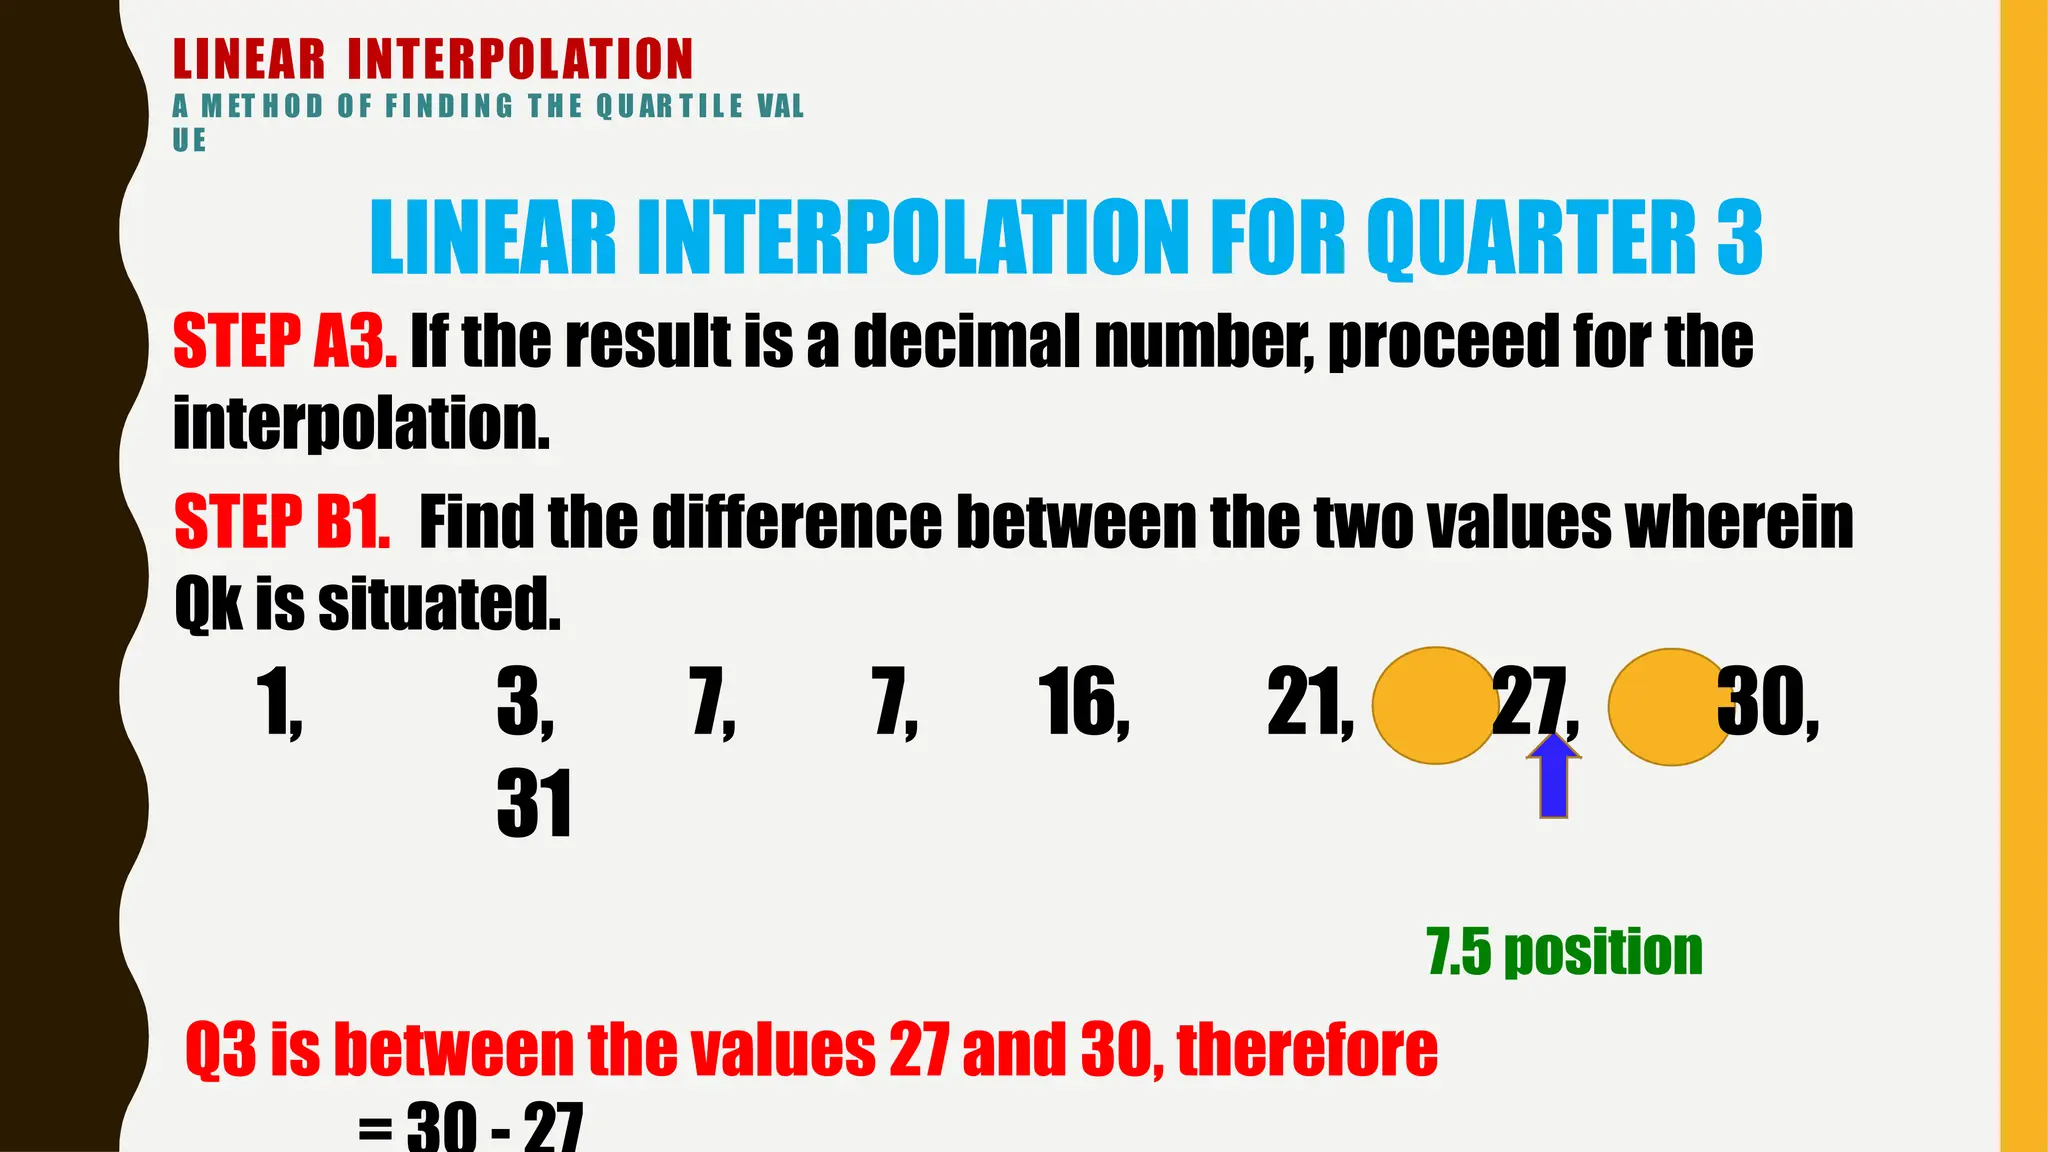
STEP A3. If the result is a decimal number, proceed for the
interpolation.
STEP B1. Find the difference between the two values wherein
Qk is situated.
1, 3, 7, 7, 16, 21, 27, 30,
31
7.5 position
Q3 is between the values 27 and 30, therefore
56.
LINEAR INTERPOLATION
A MET H O D O F F I N D I N G T H E Q U AR T I L E VAL
UE
LINEAR INTERPOLATION FOR QUARTER 3
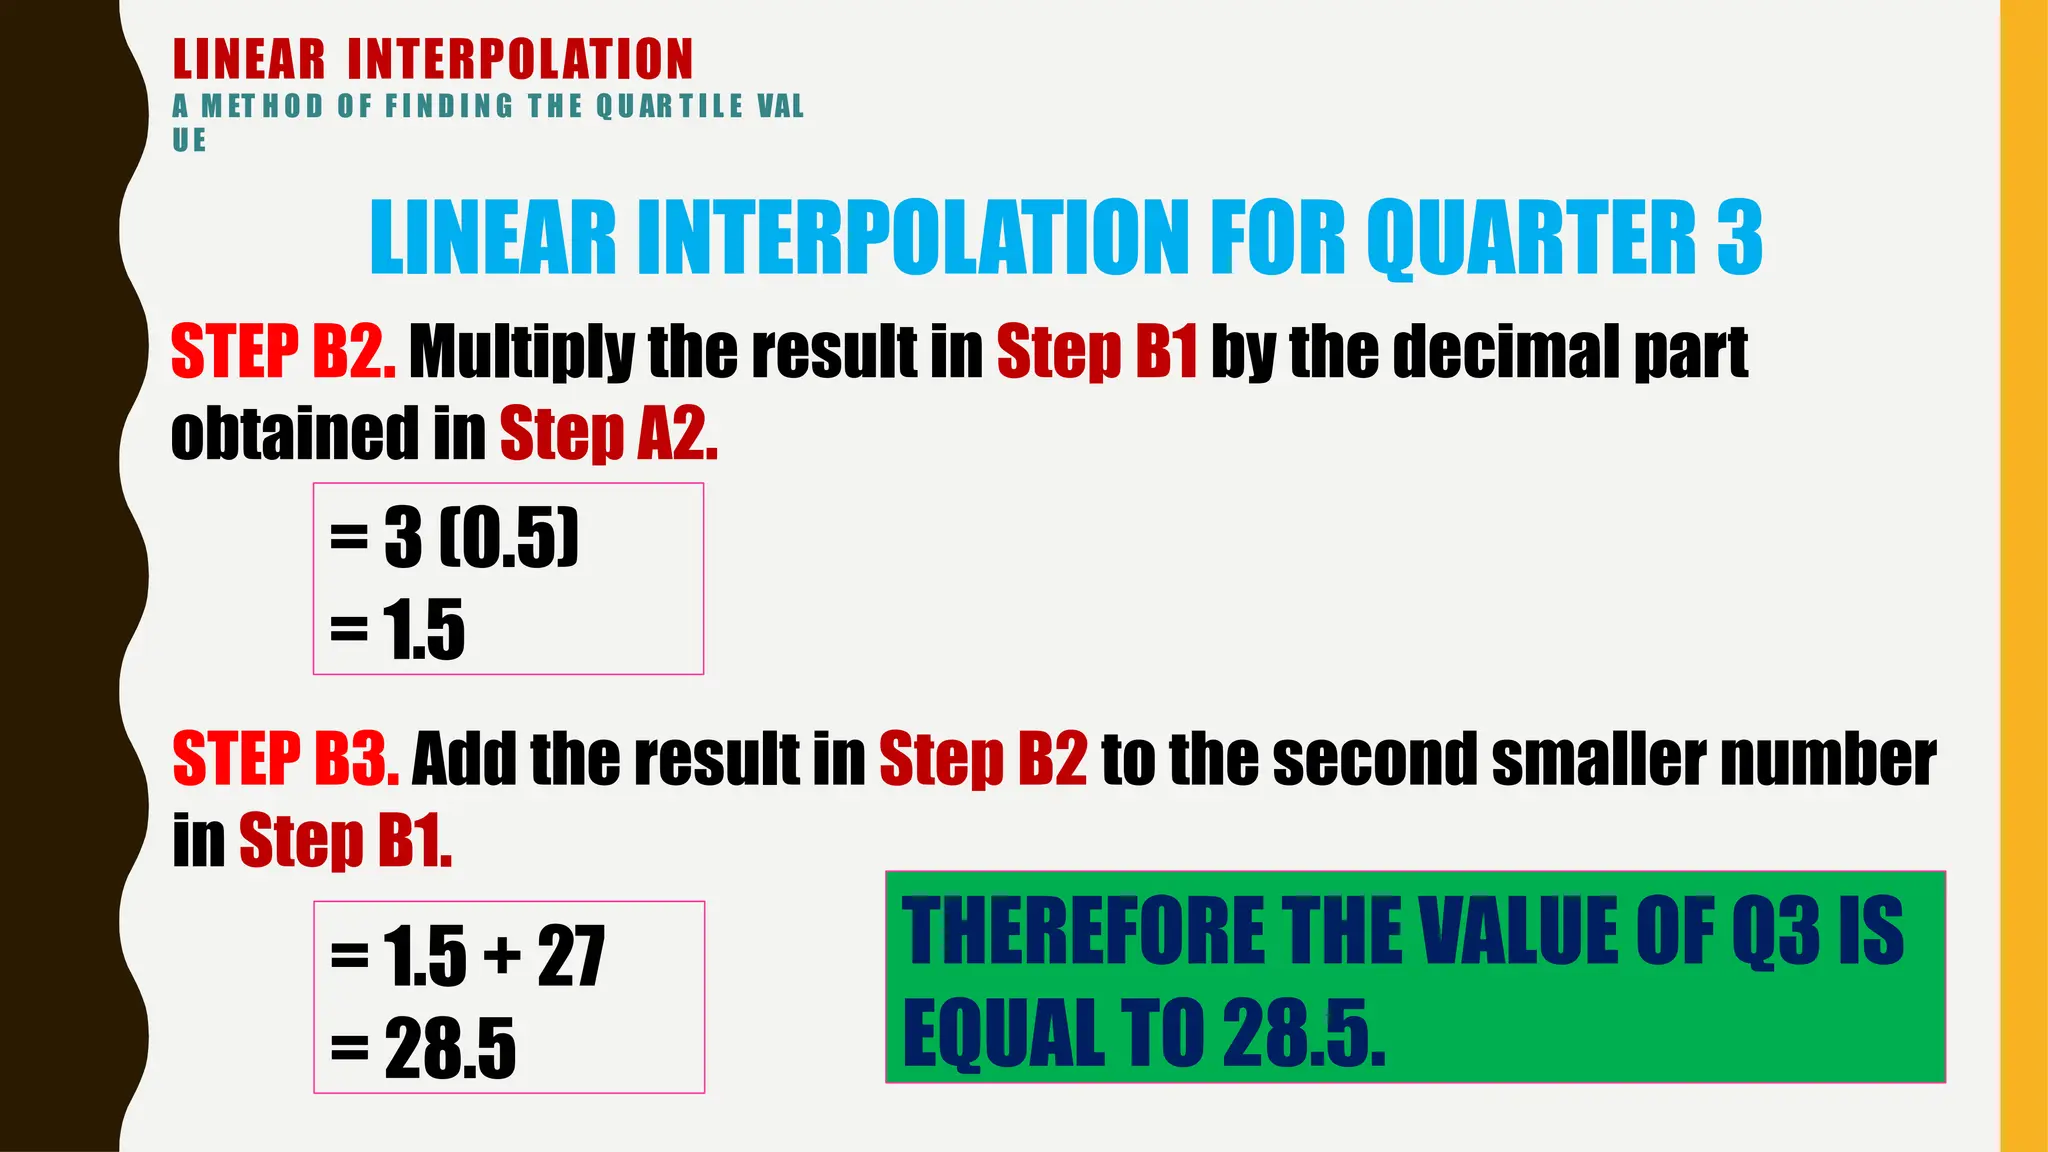
= 3 (0.5)
= 1.5
STEP B2. Multiply the result in Step B1 by the decimal part
obtained in Step A2.
STEP B3. Add the result in Step B2 to the second smaller number
in Step B1.
= 1.5 + 27
= 28.5
THEREFORE THE VALUE OF Q3 IS
EQUAL TO 28.5.
57.
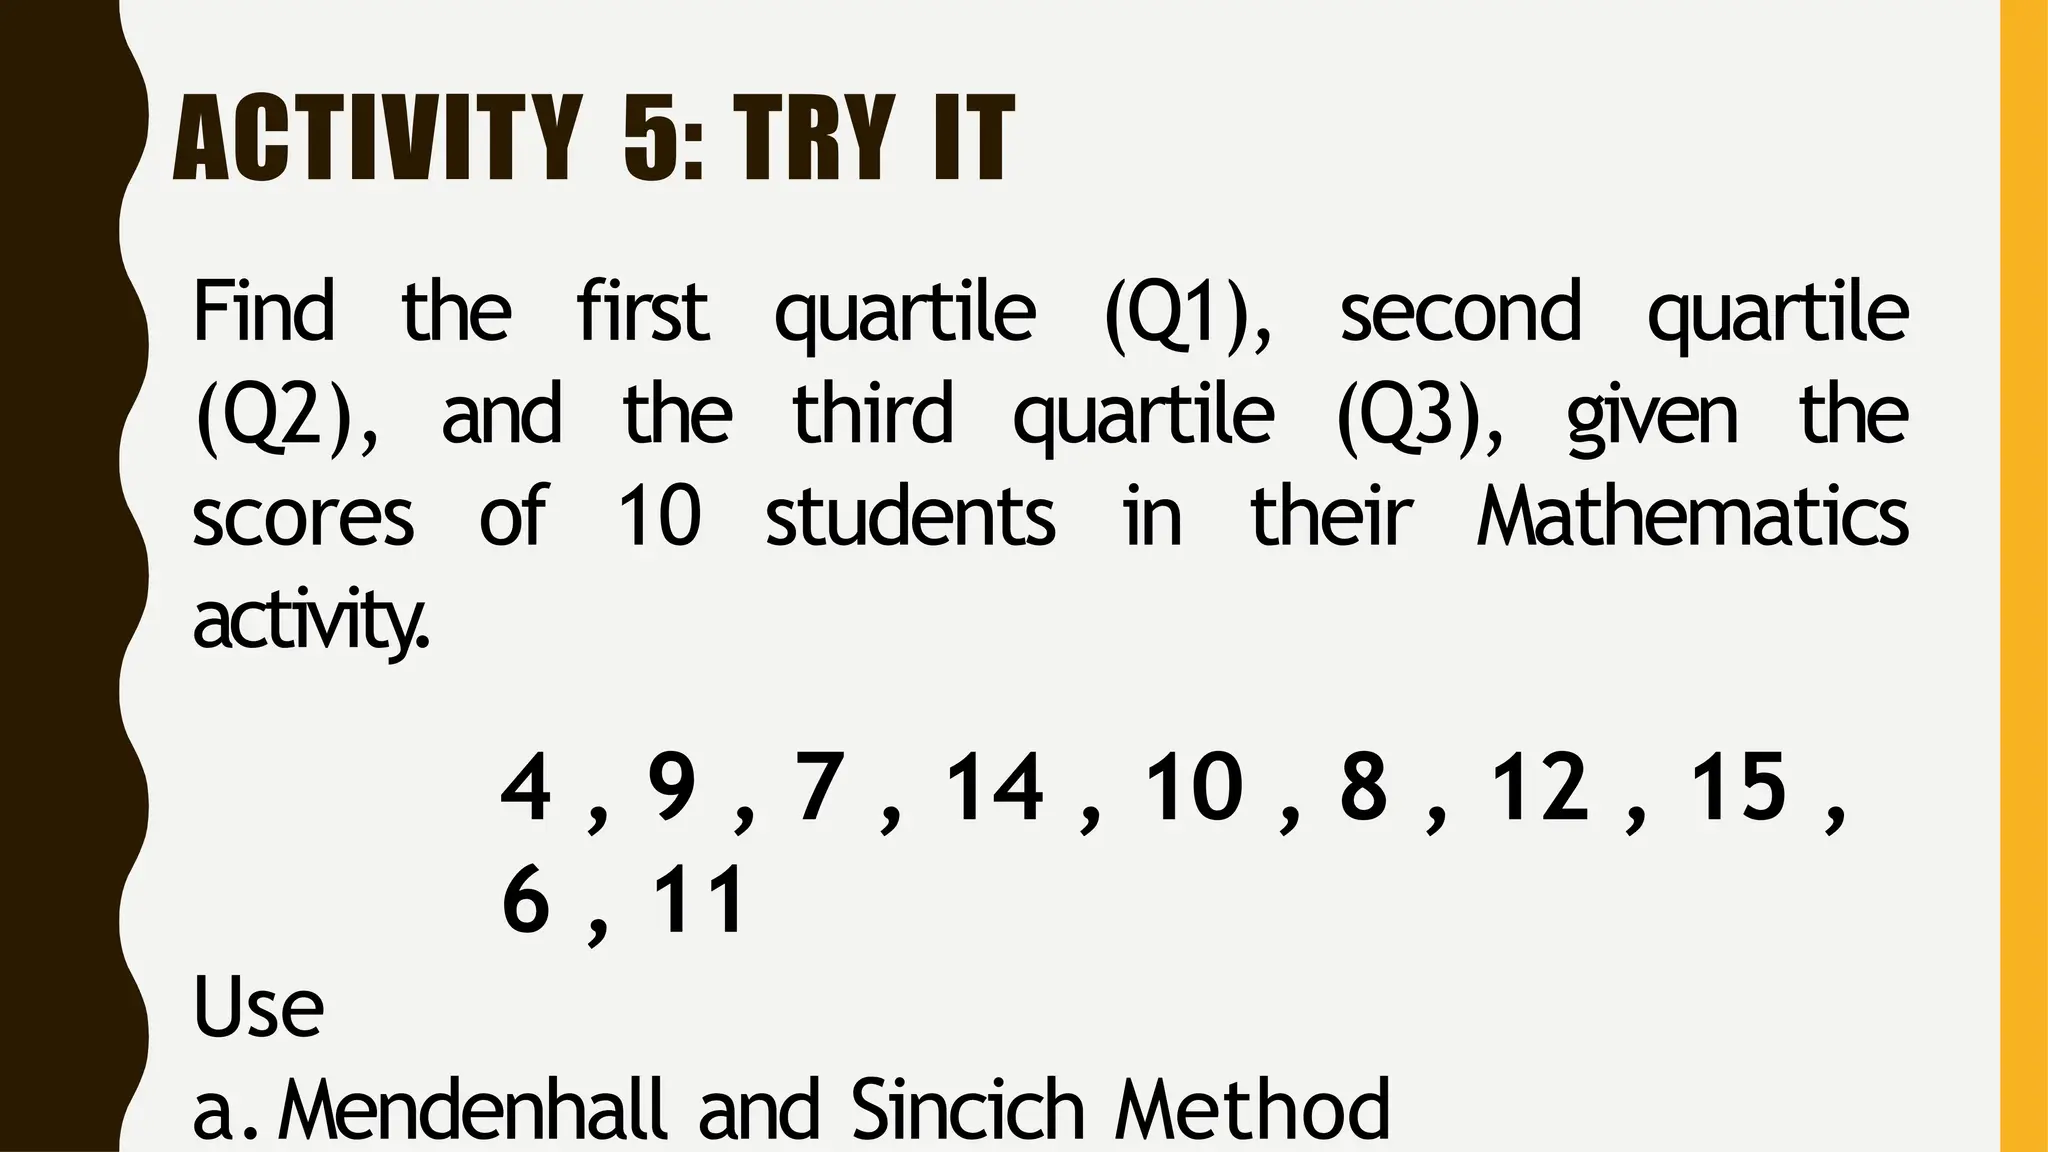
ACTIVITY 5: TRYIT
Find the first quartile (Q1), second quartile
(Q2), and the third quartile (Q3), given the
scores of 10 students in their Mathematics
activity
.
4 , 9 , 7 , 14 , 10 , 8 , 12 , 15 ,
6 , 11
Use
a.Mendenhall and Sincich Method
58.
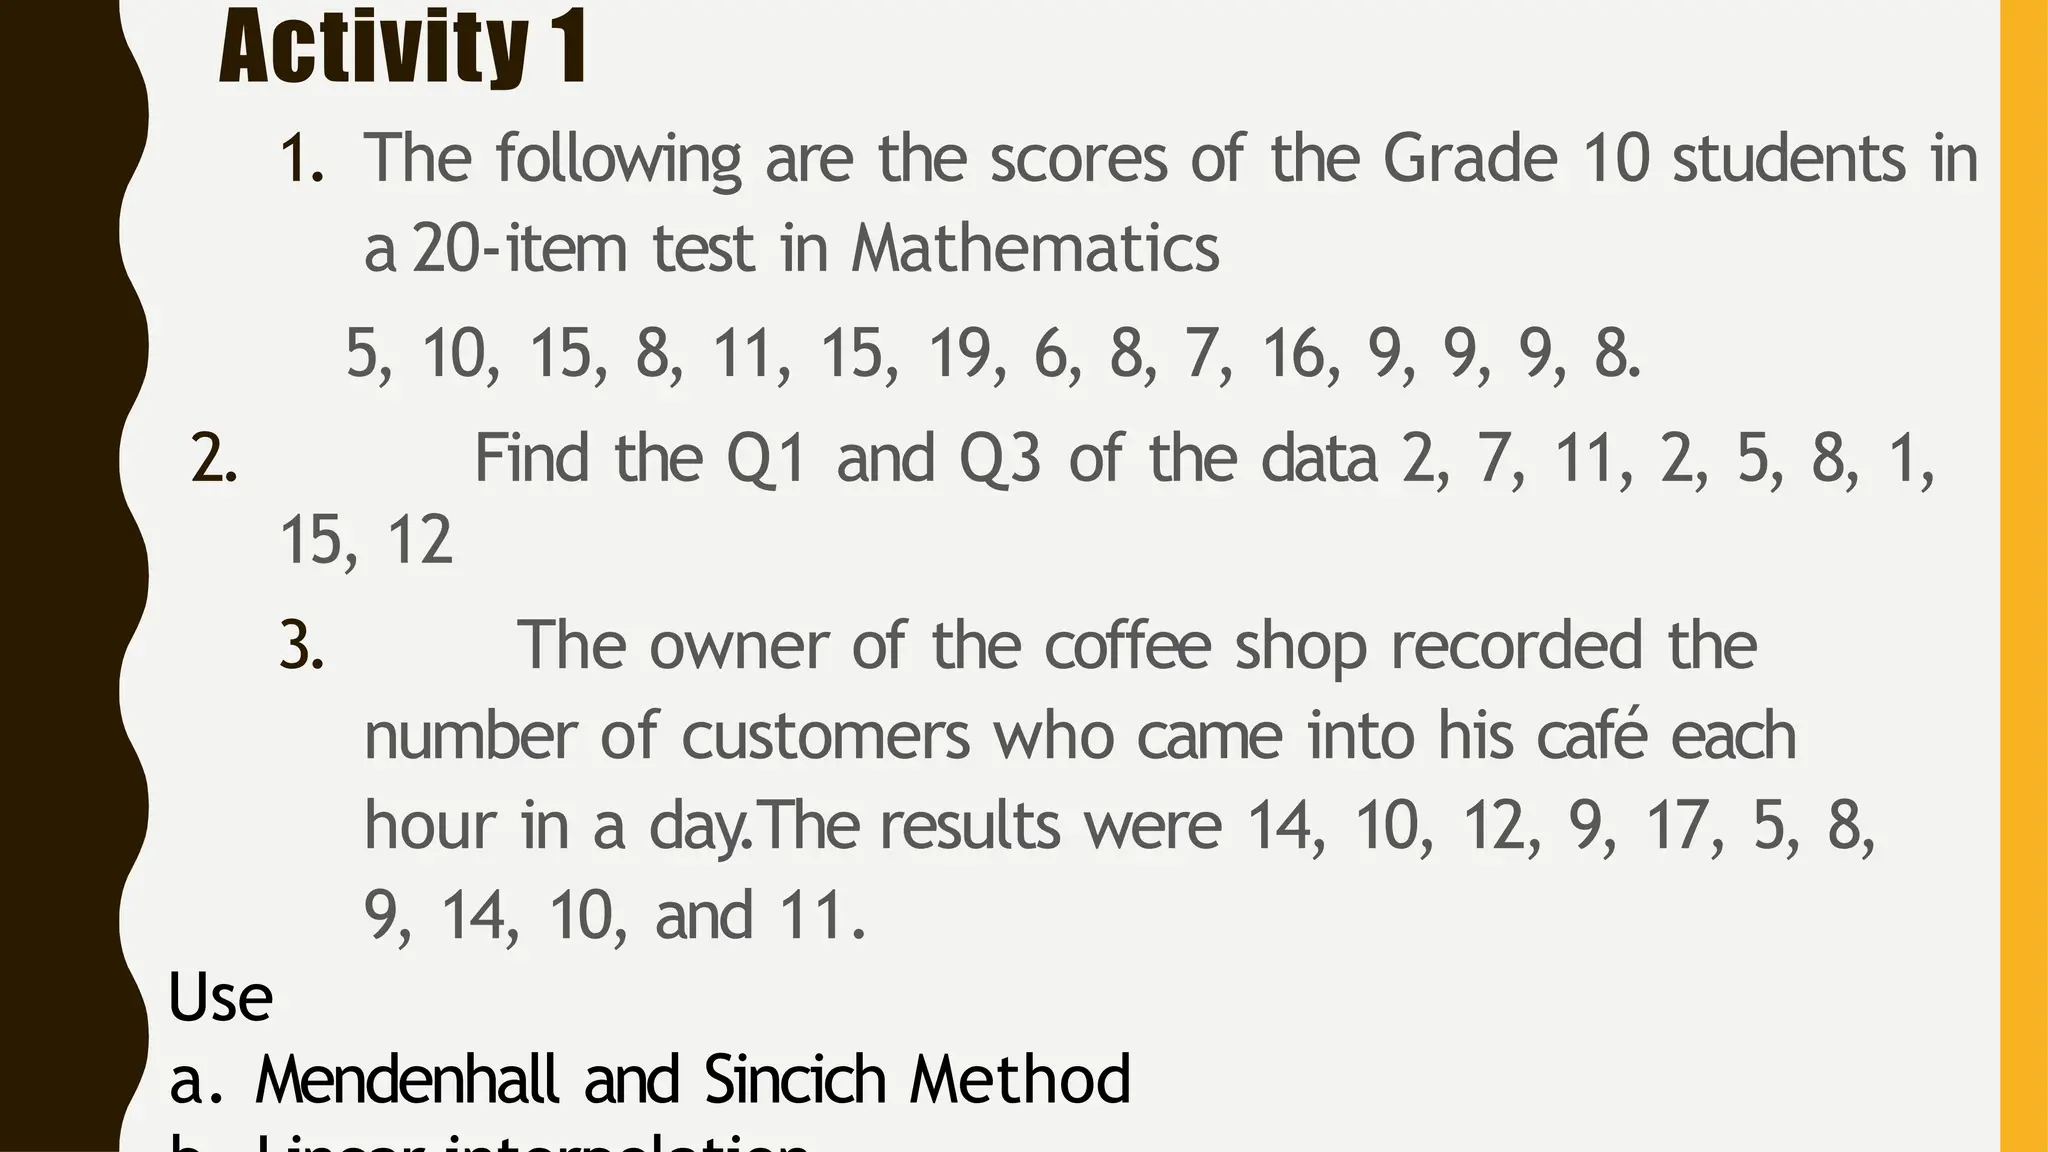
Activity 1
1. Thefollowing are the scores of the Grade 10 students in
a 20-item test in Mathematics
5, 10, 15, 8, 11, 15, 19, 6, 8, 7, 16, 9, 9, 9, 8.
2. Find the Q1 and Q3 of the data 2, 7, 11, 2, 5, 8, 1,
15, 12
3. The owner of the coffee shop recorded the
number of customers who came into his café each
hour in a day.The results were 14, 10, 12, 9, 17, 5, 8,
9, 14, 10, and 11.
Use
a. Mendenhall and Sincich Method