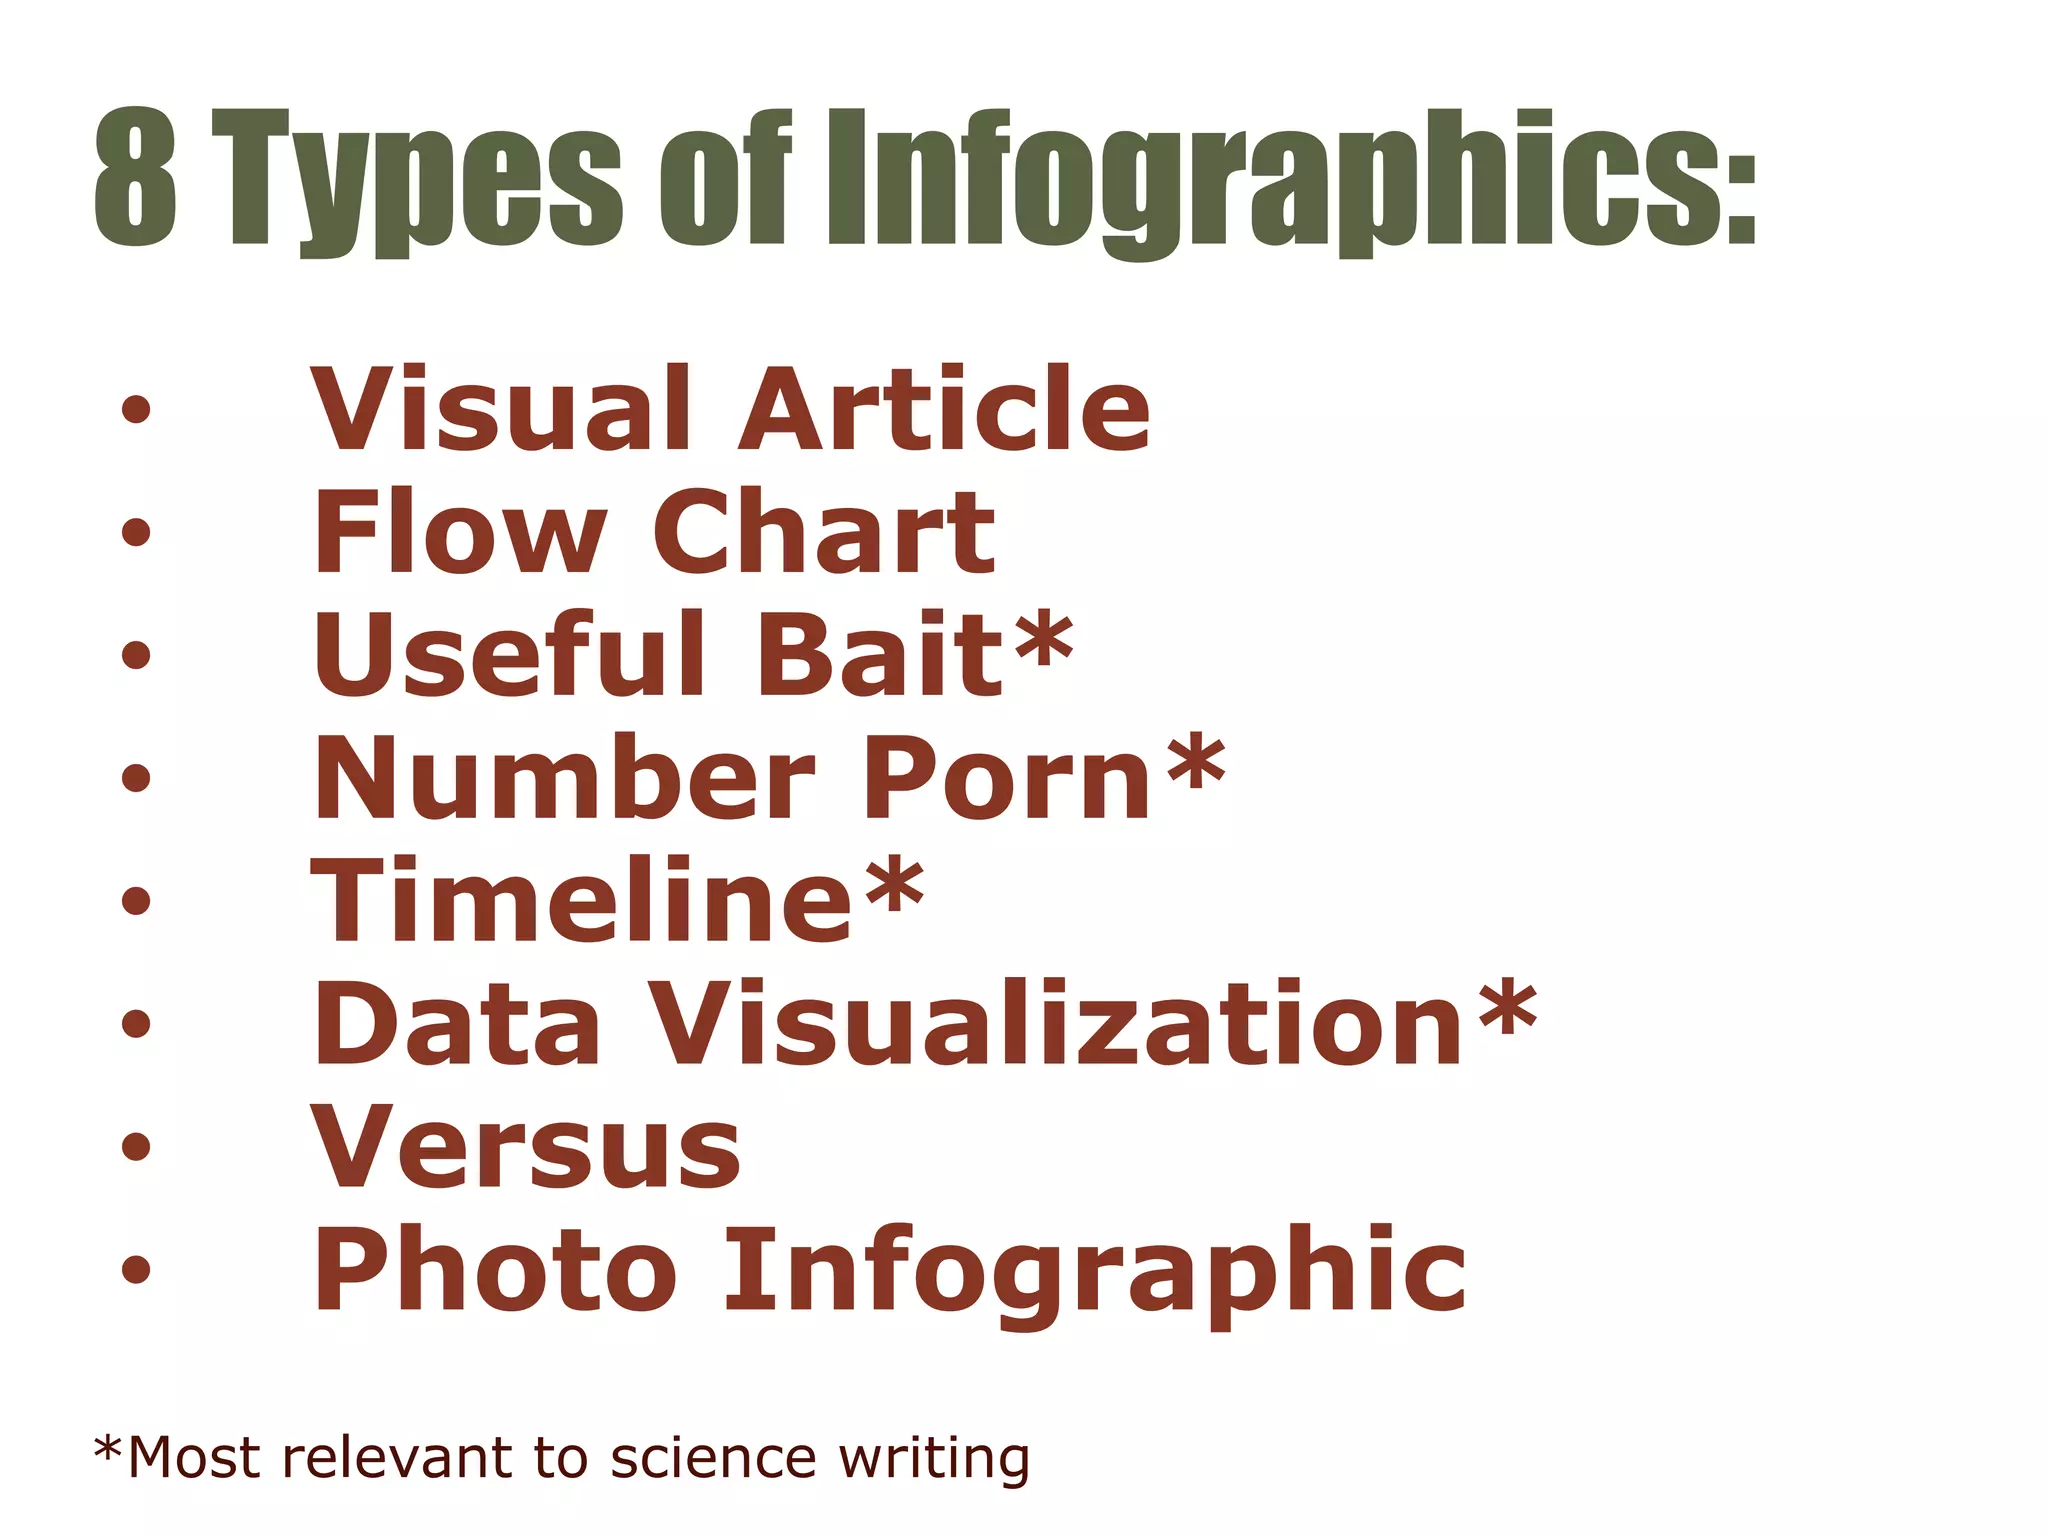
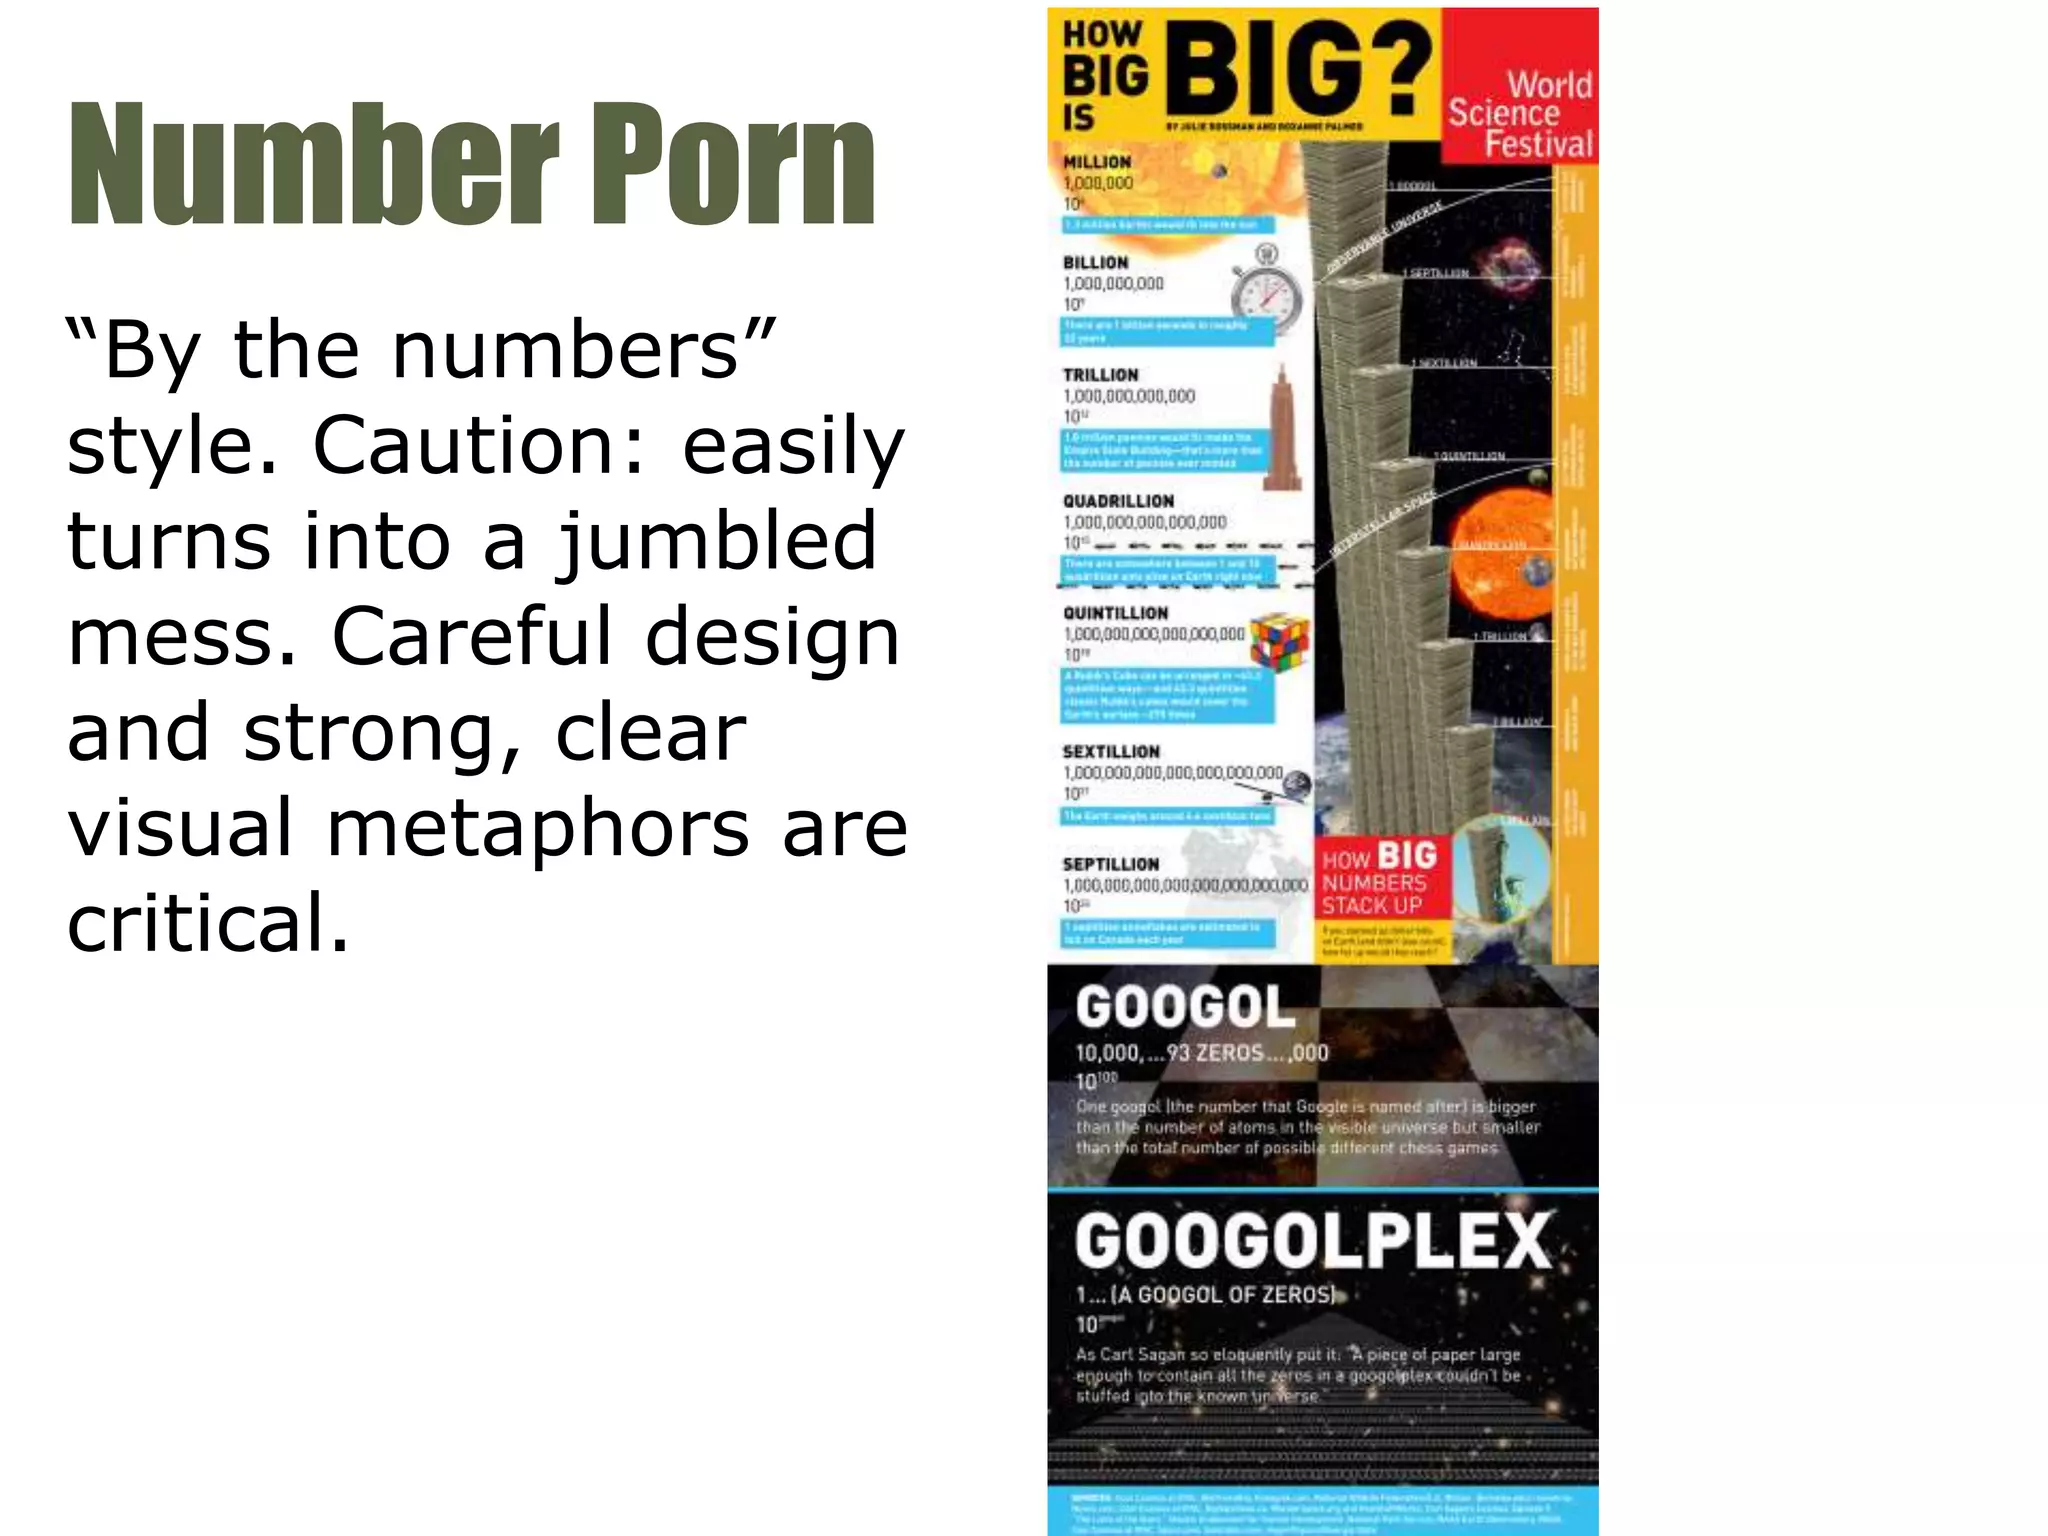
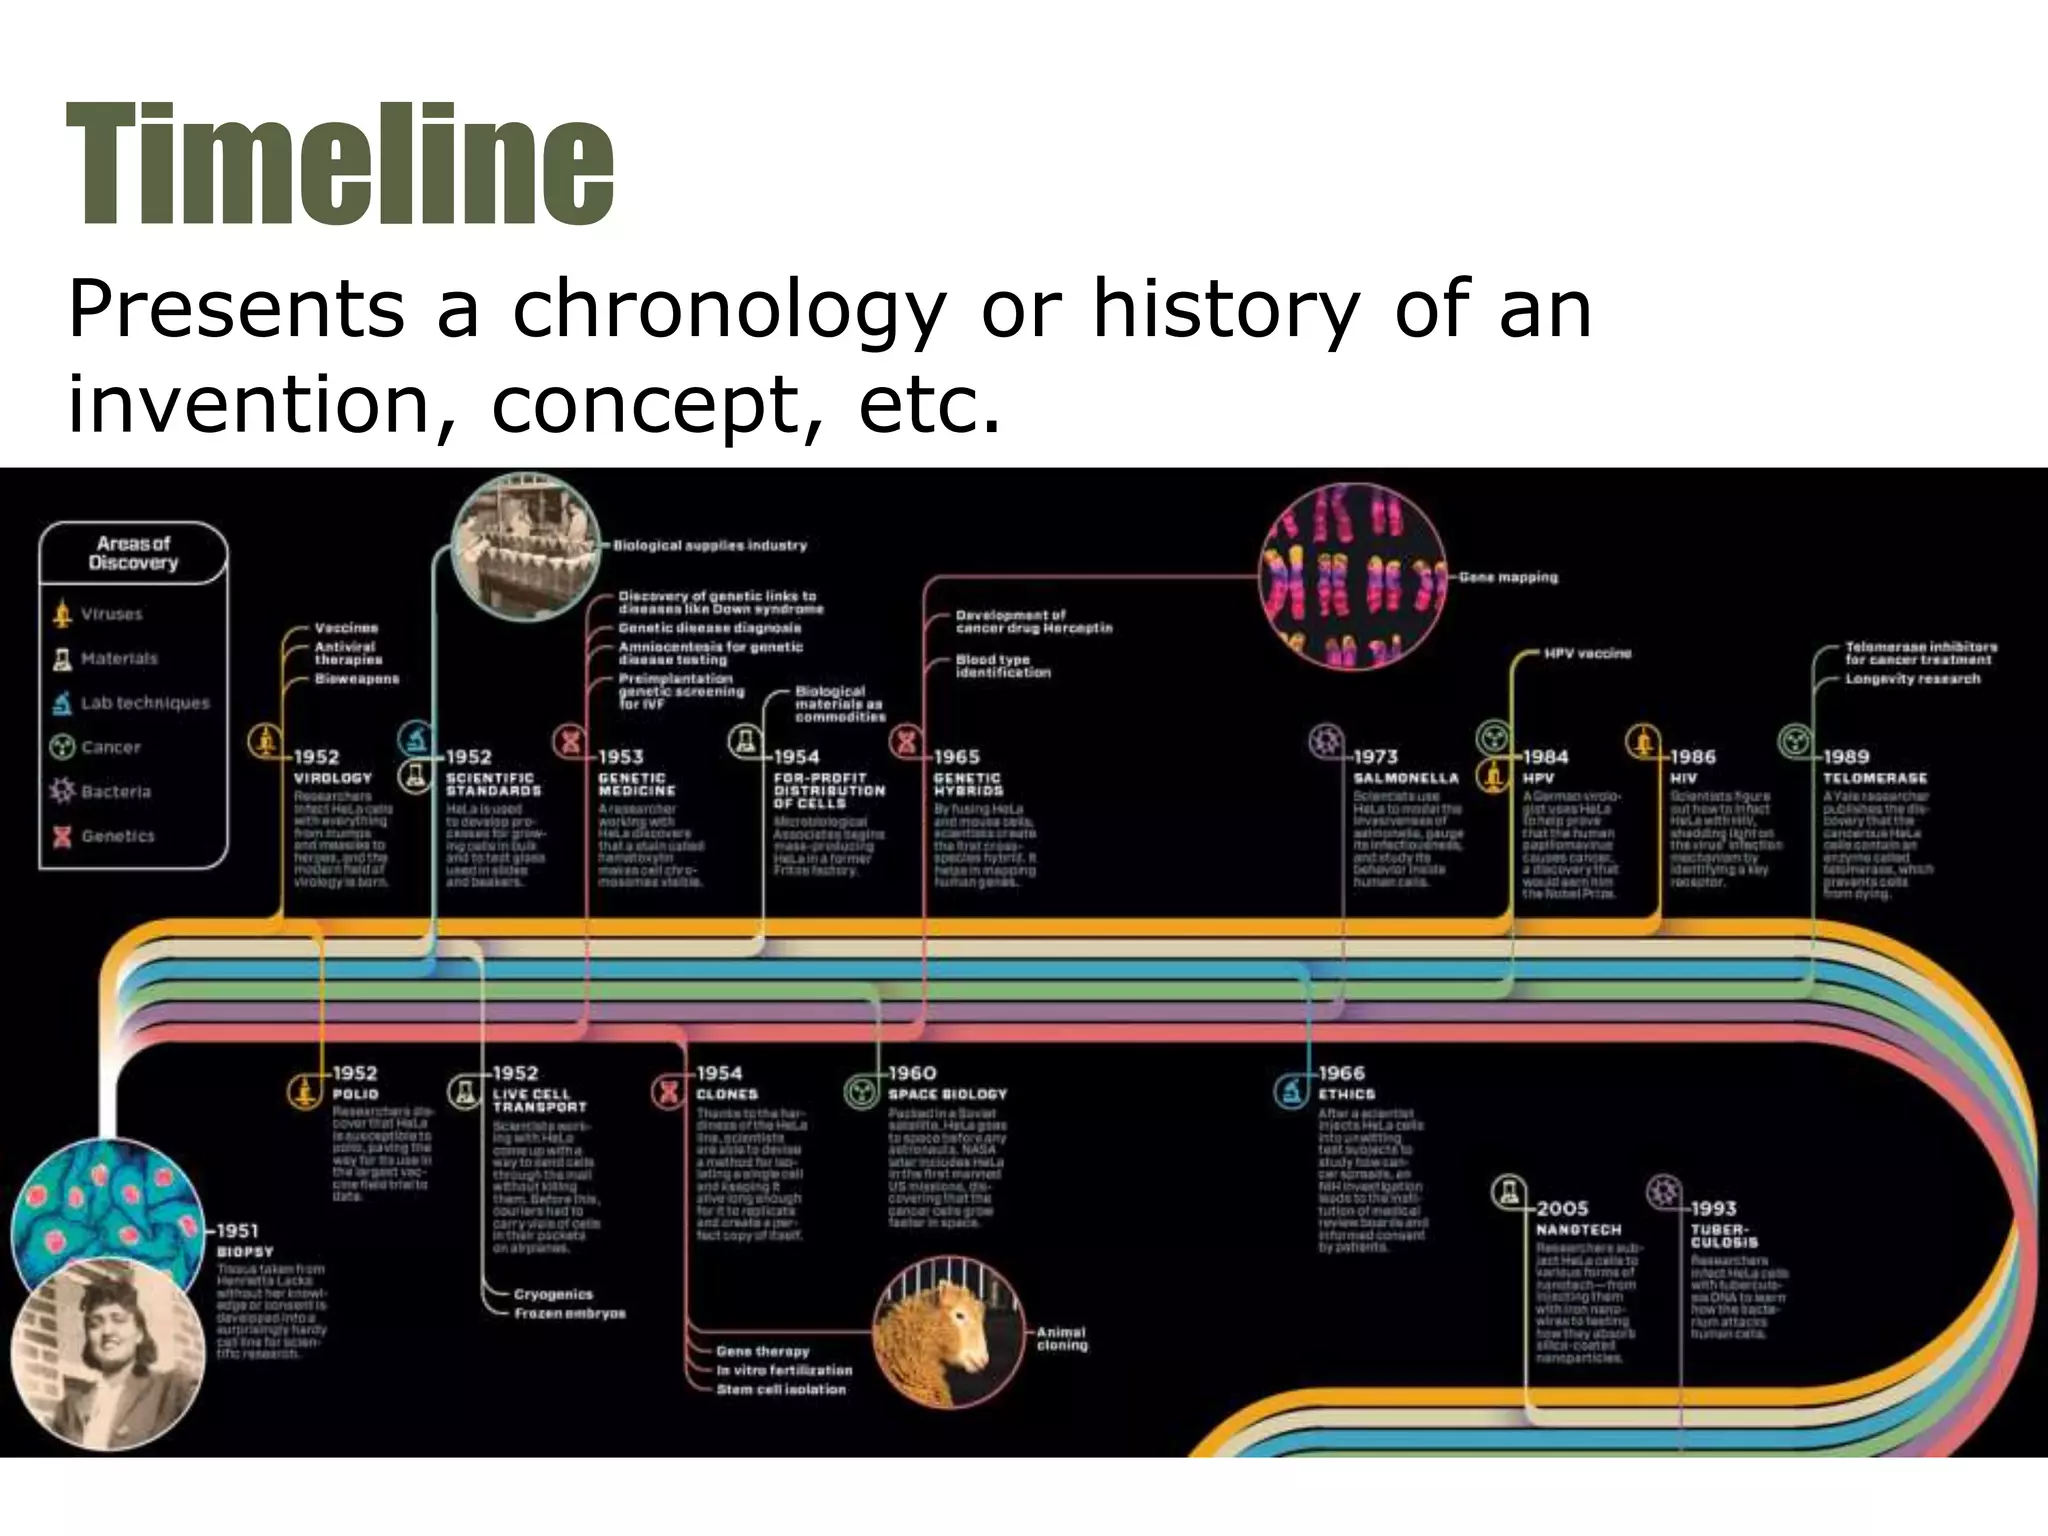
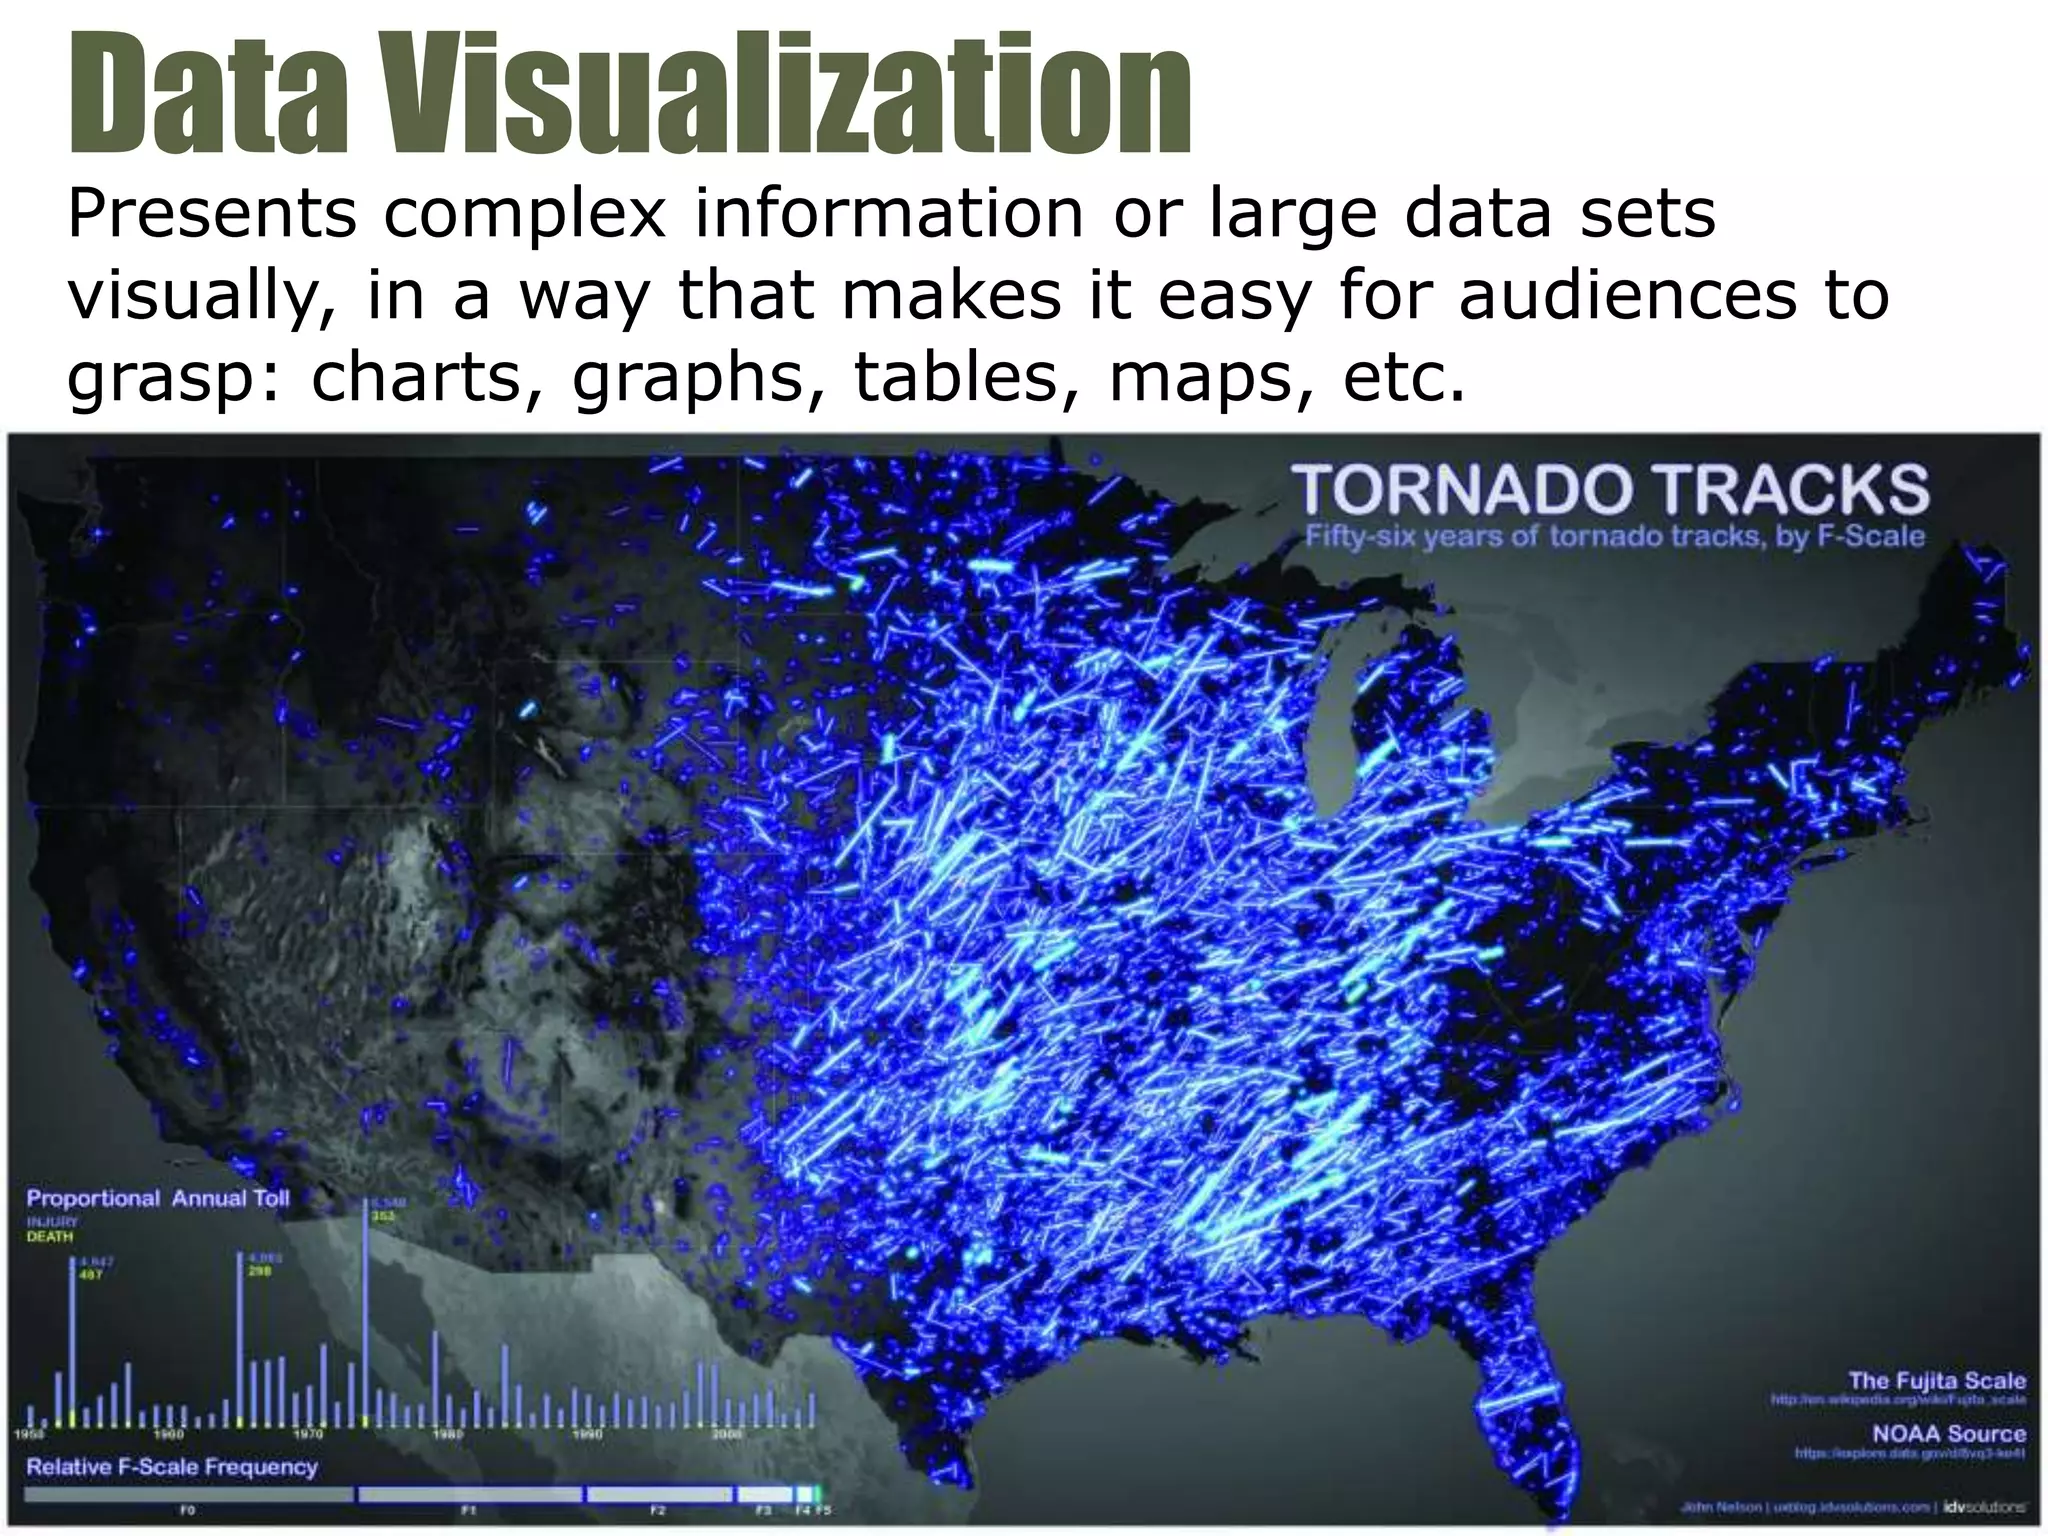
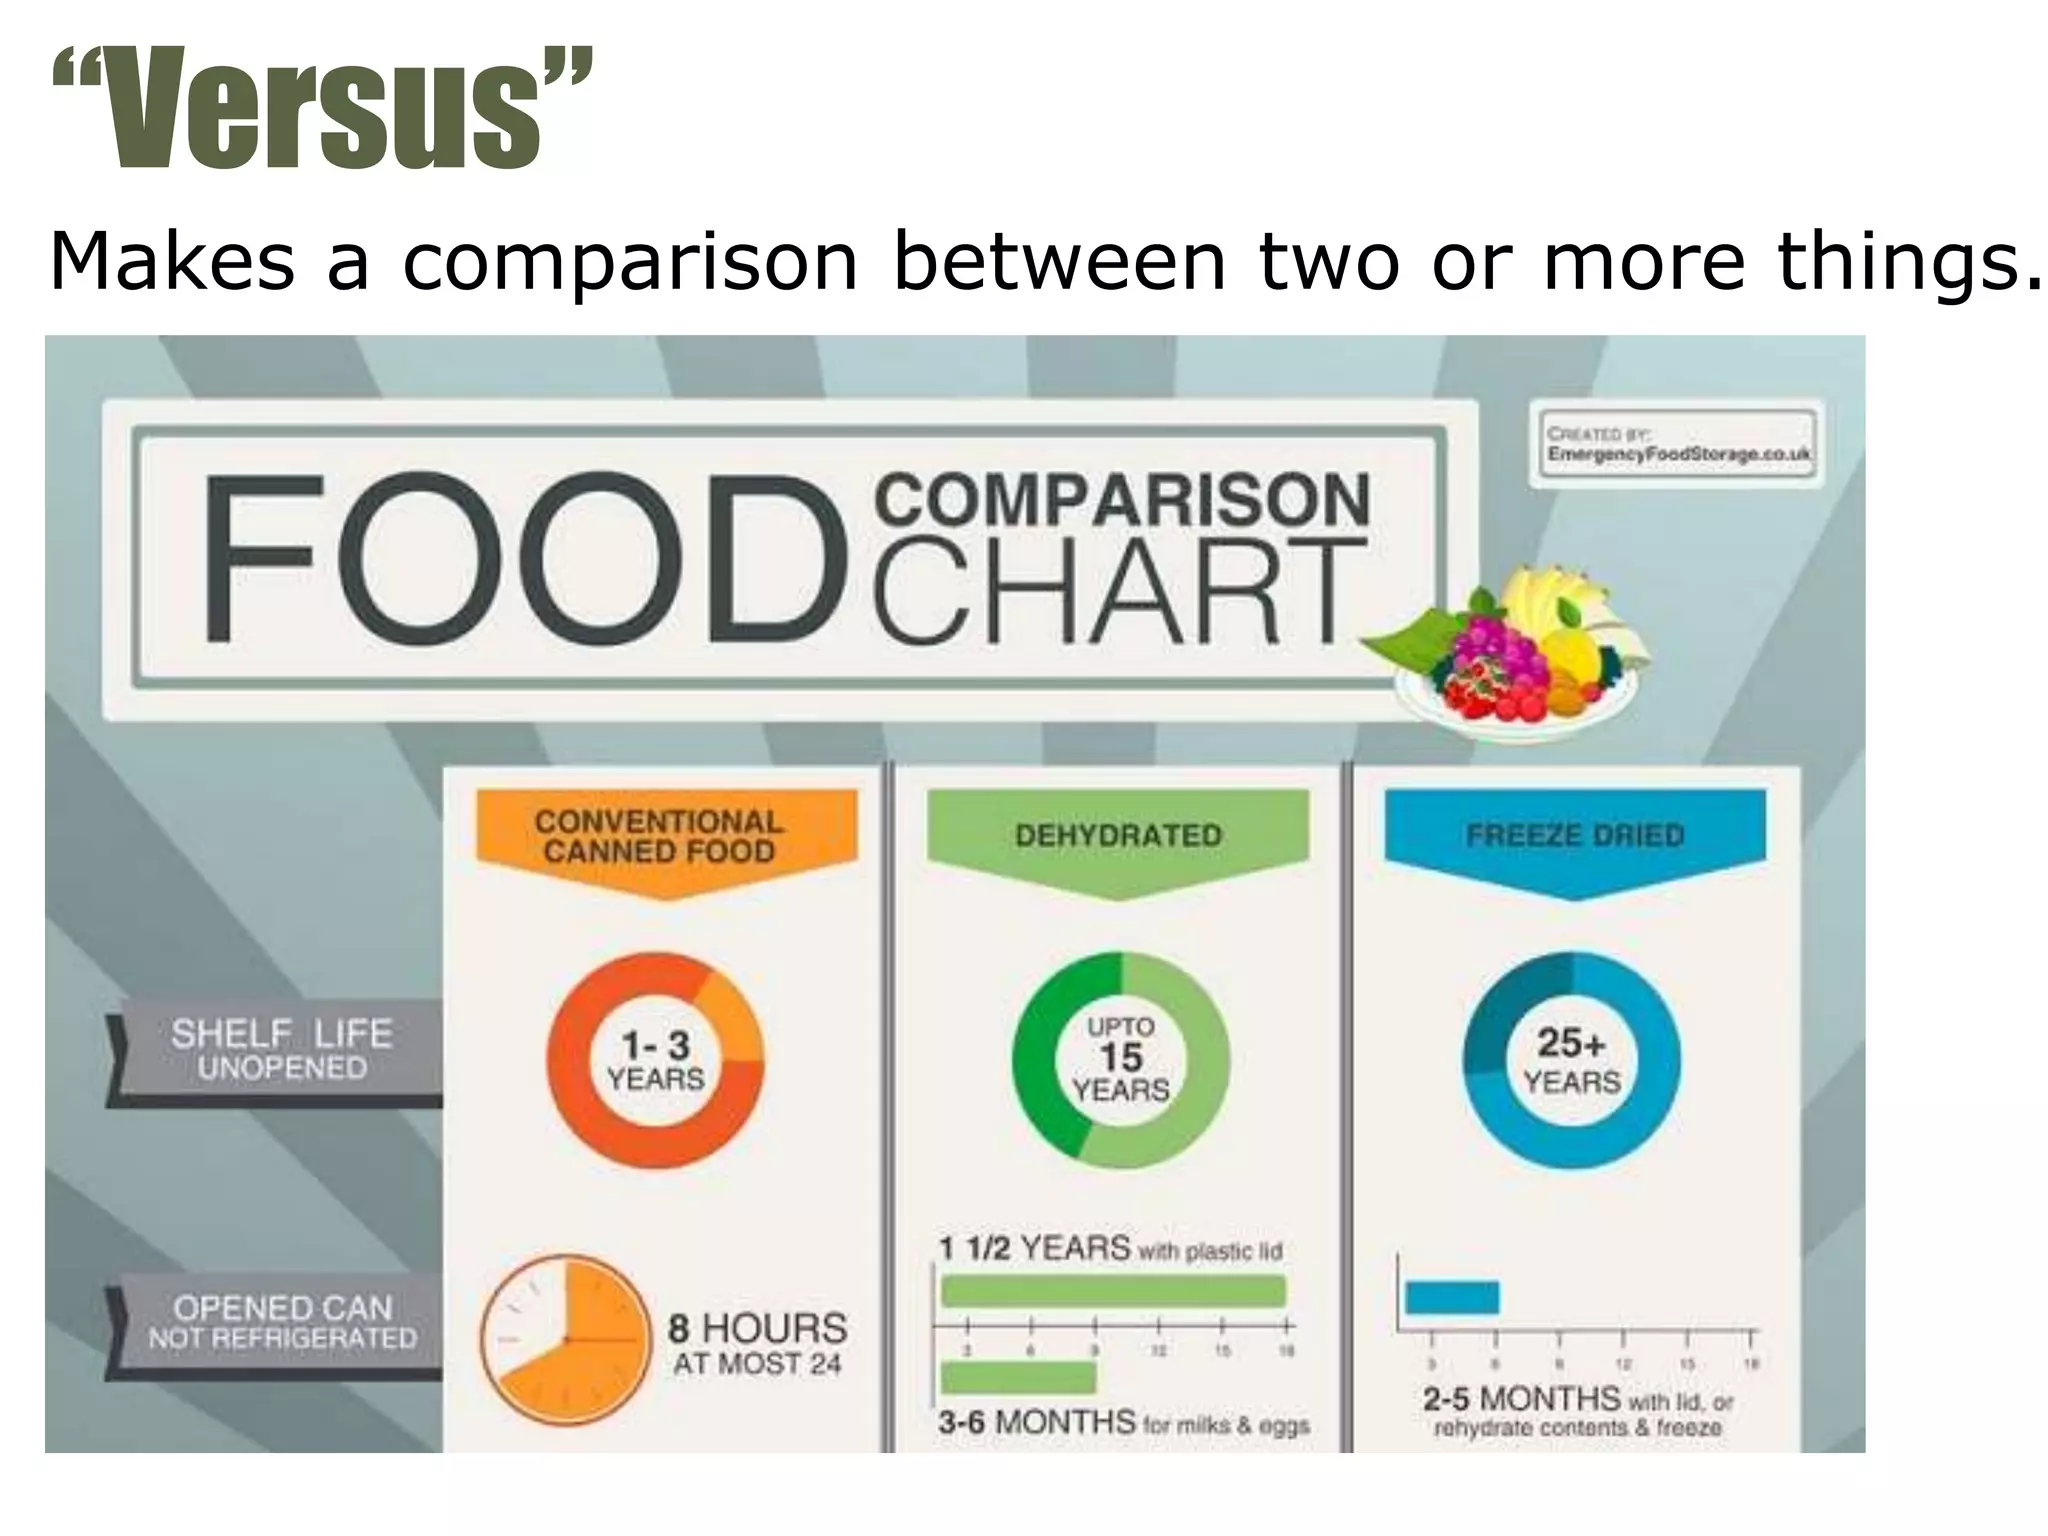
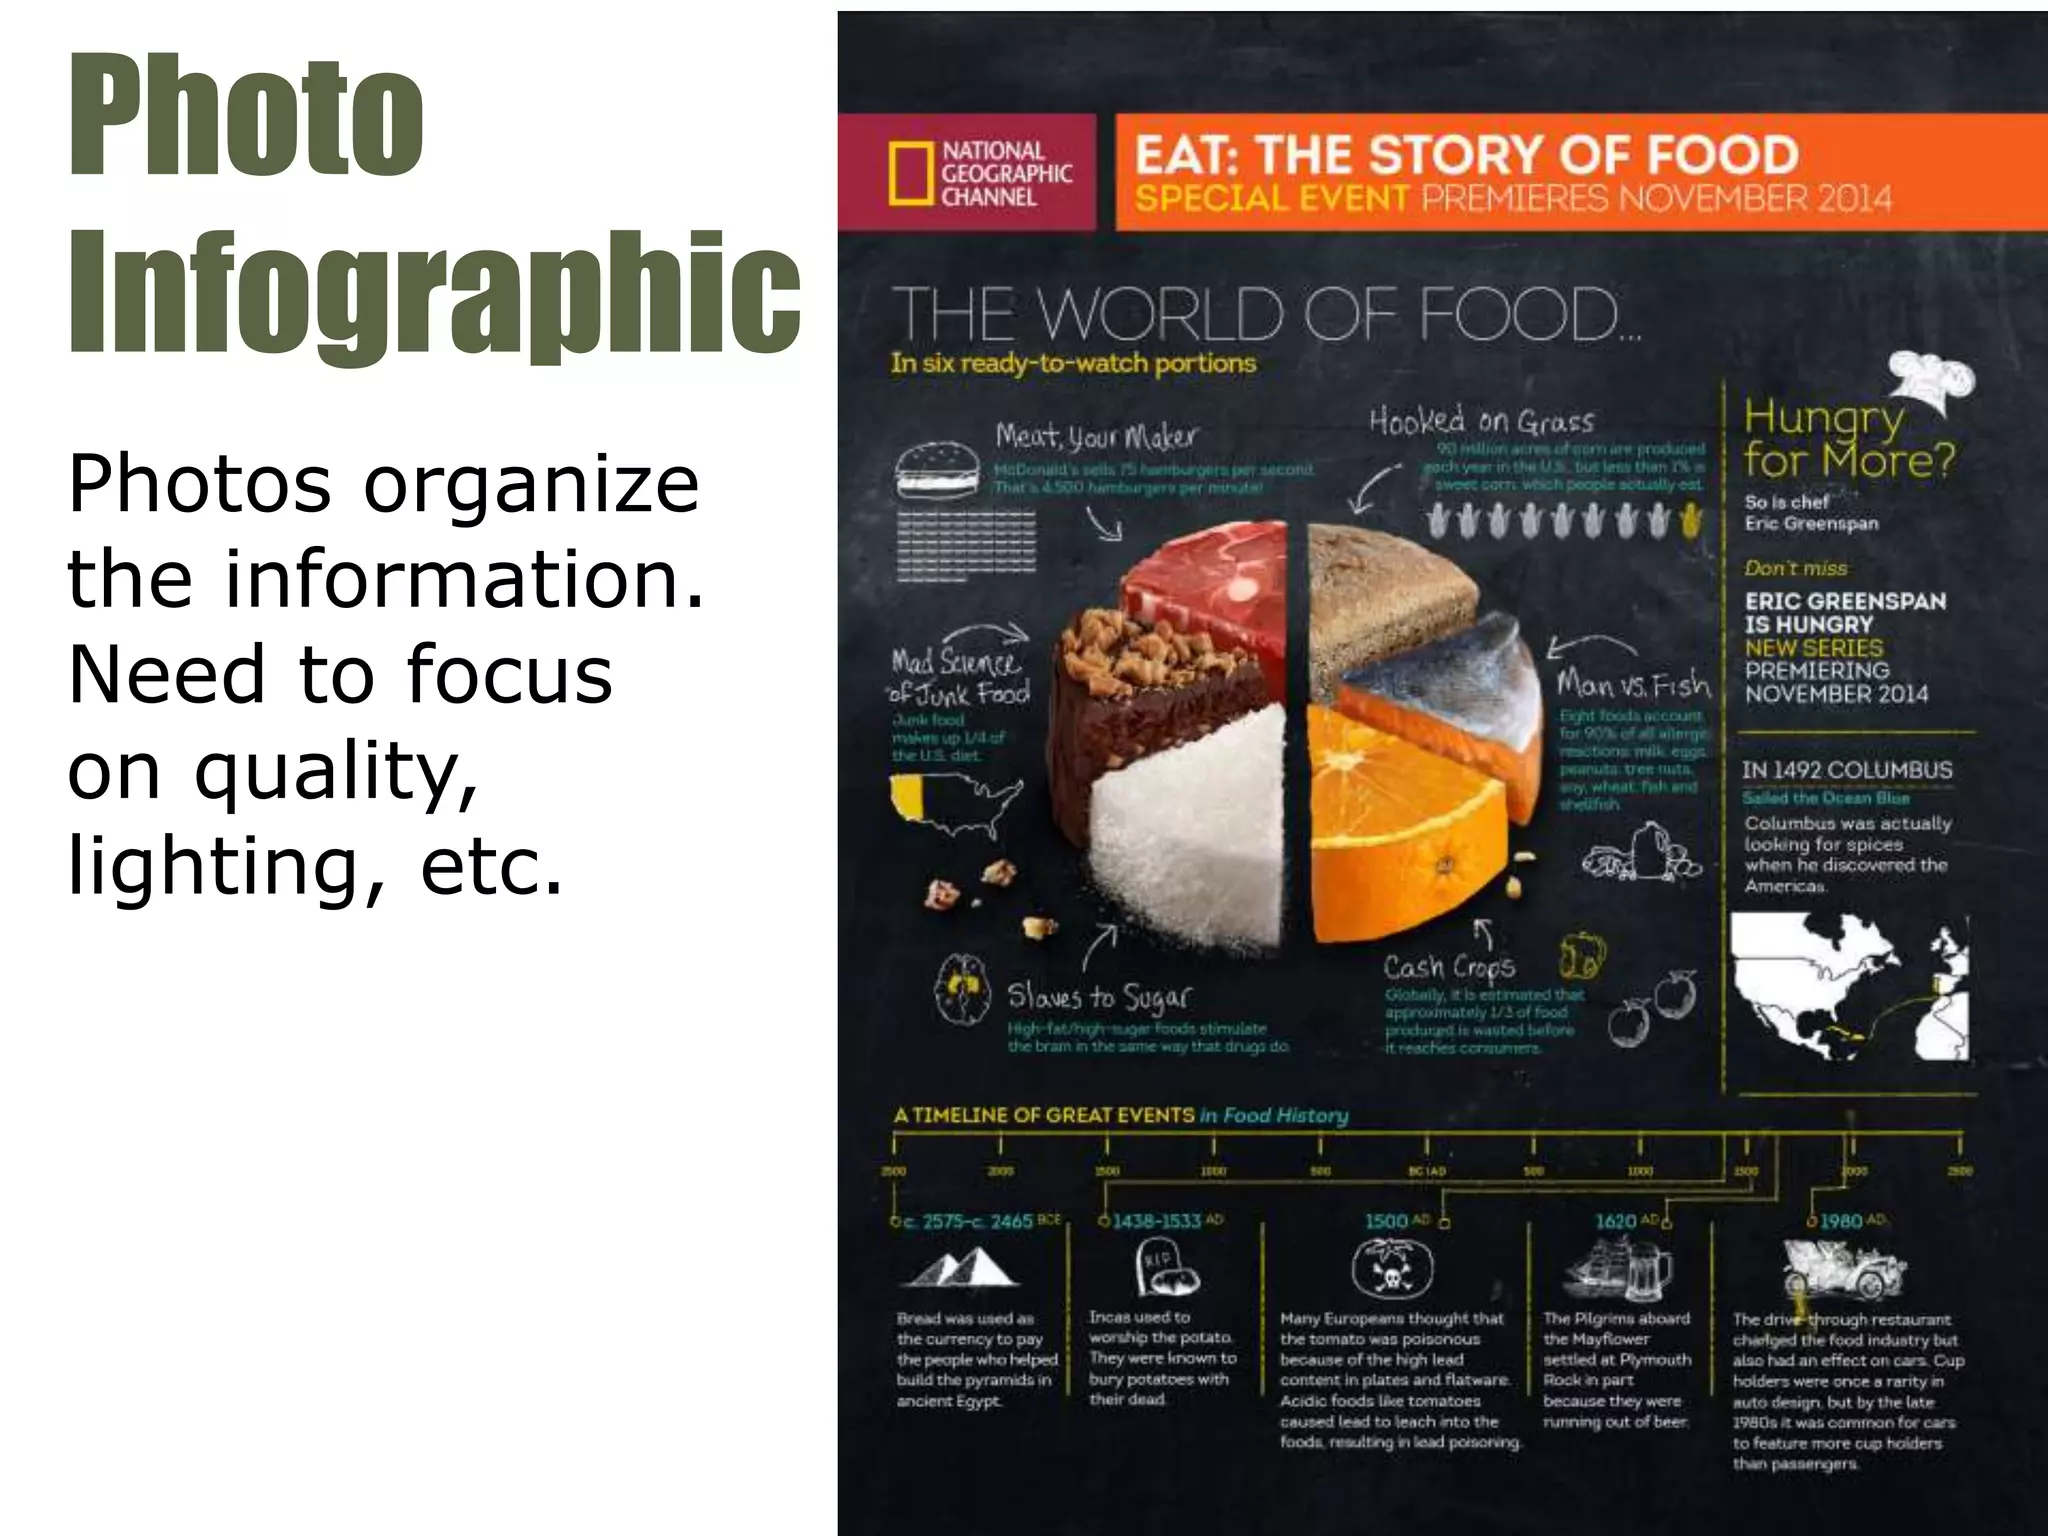
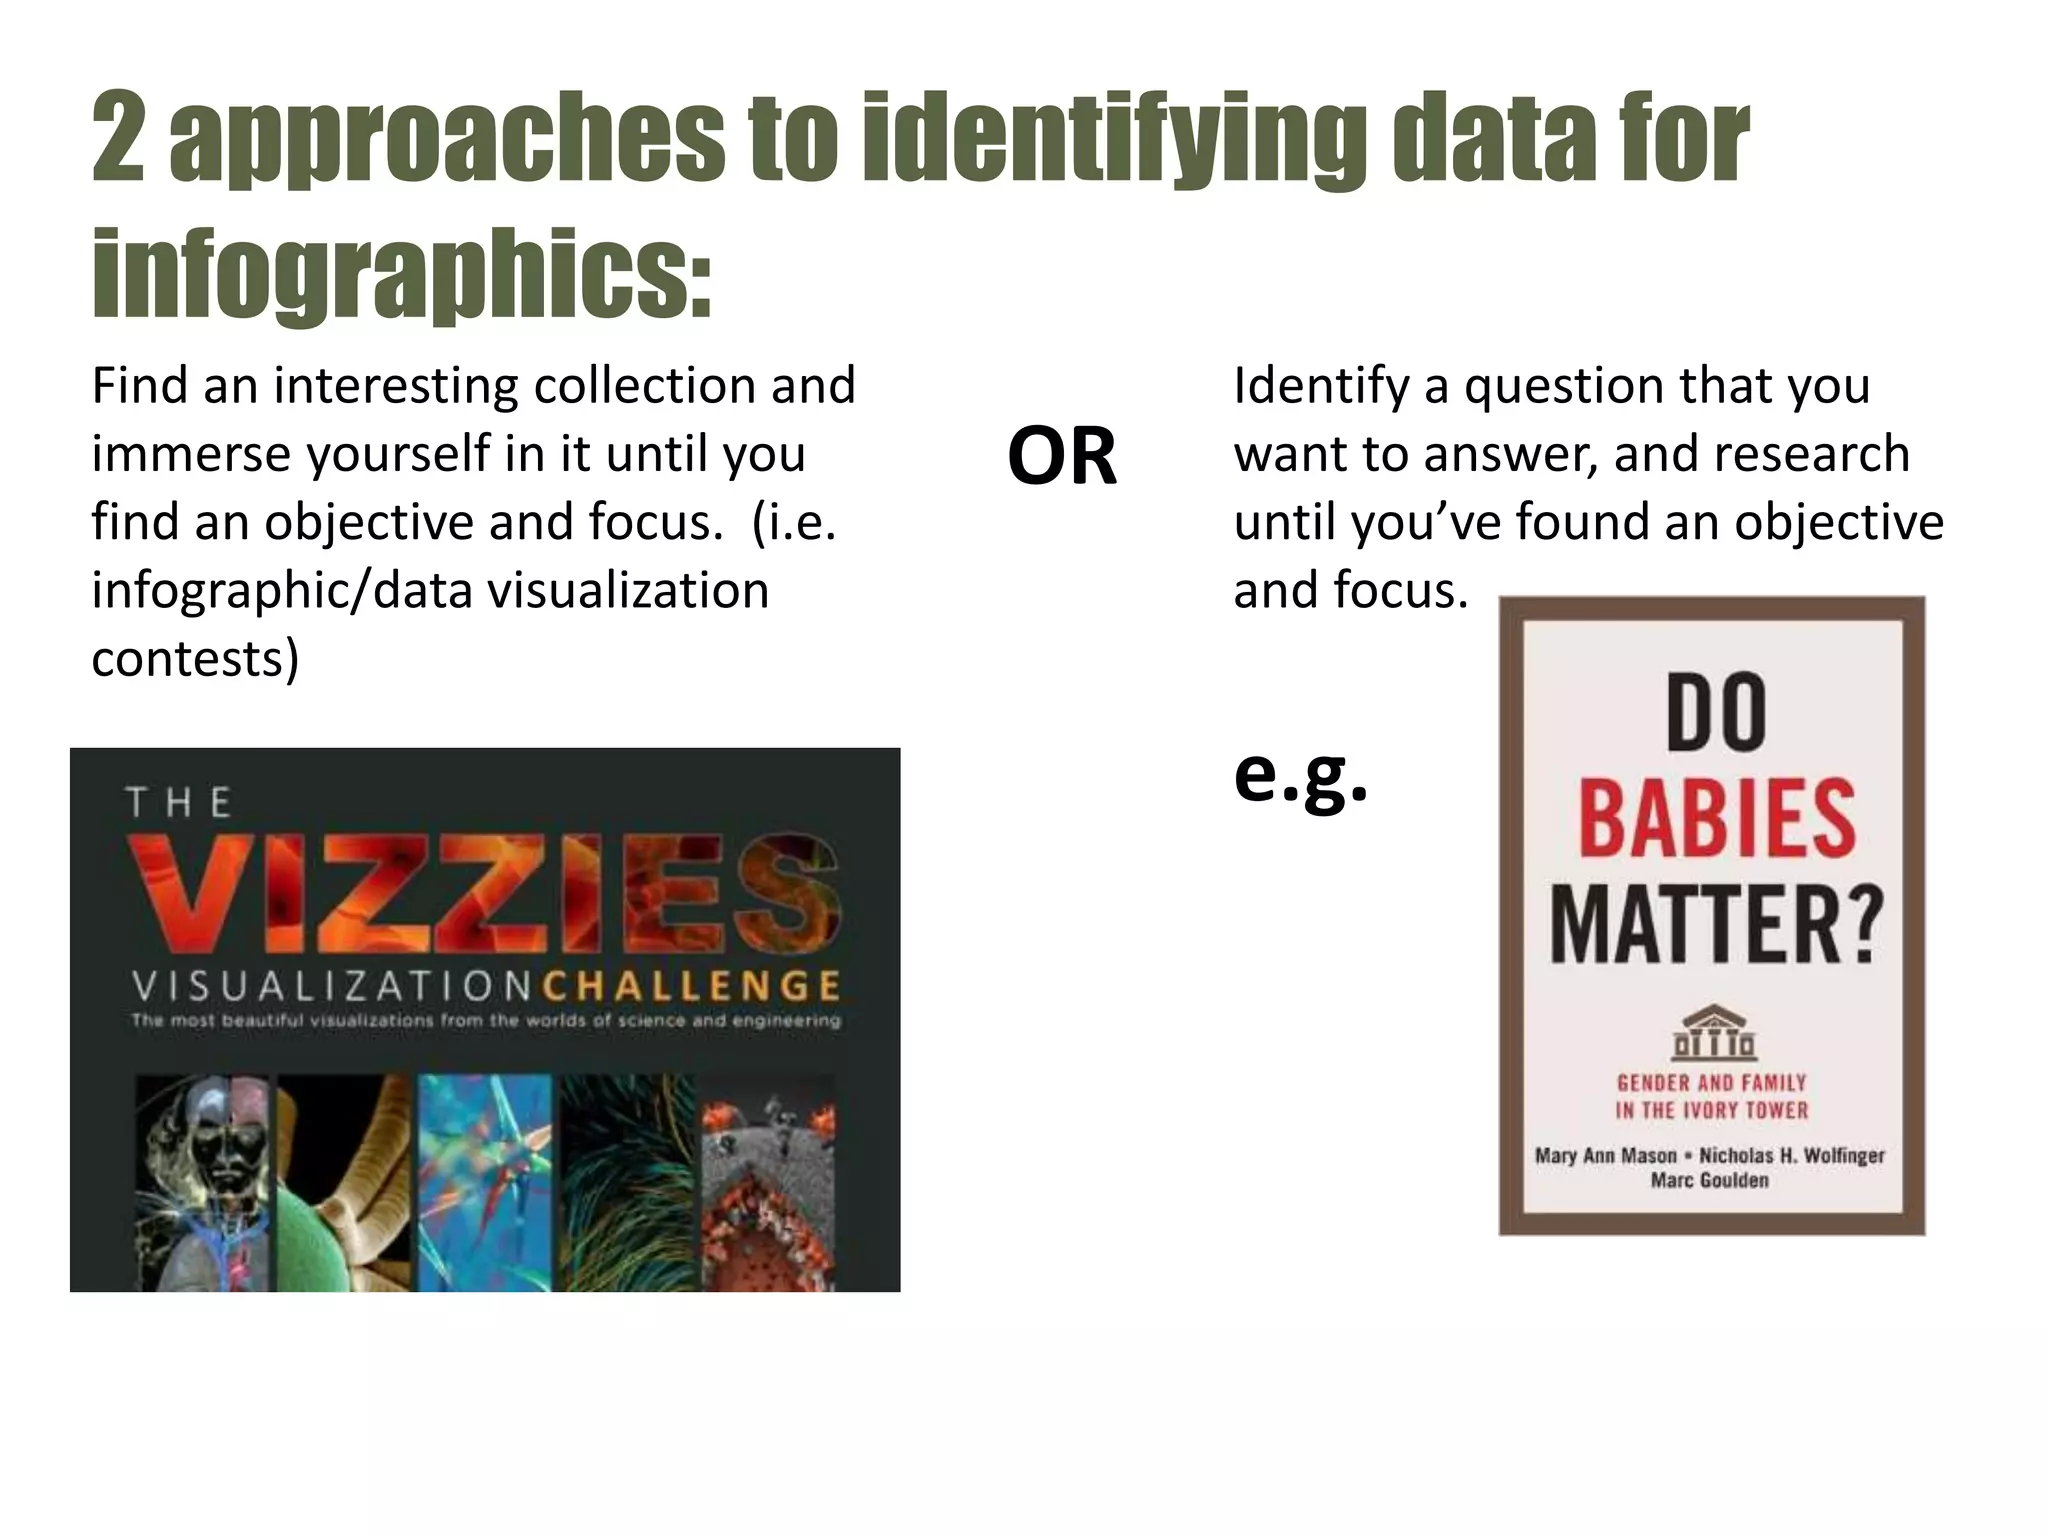
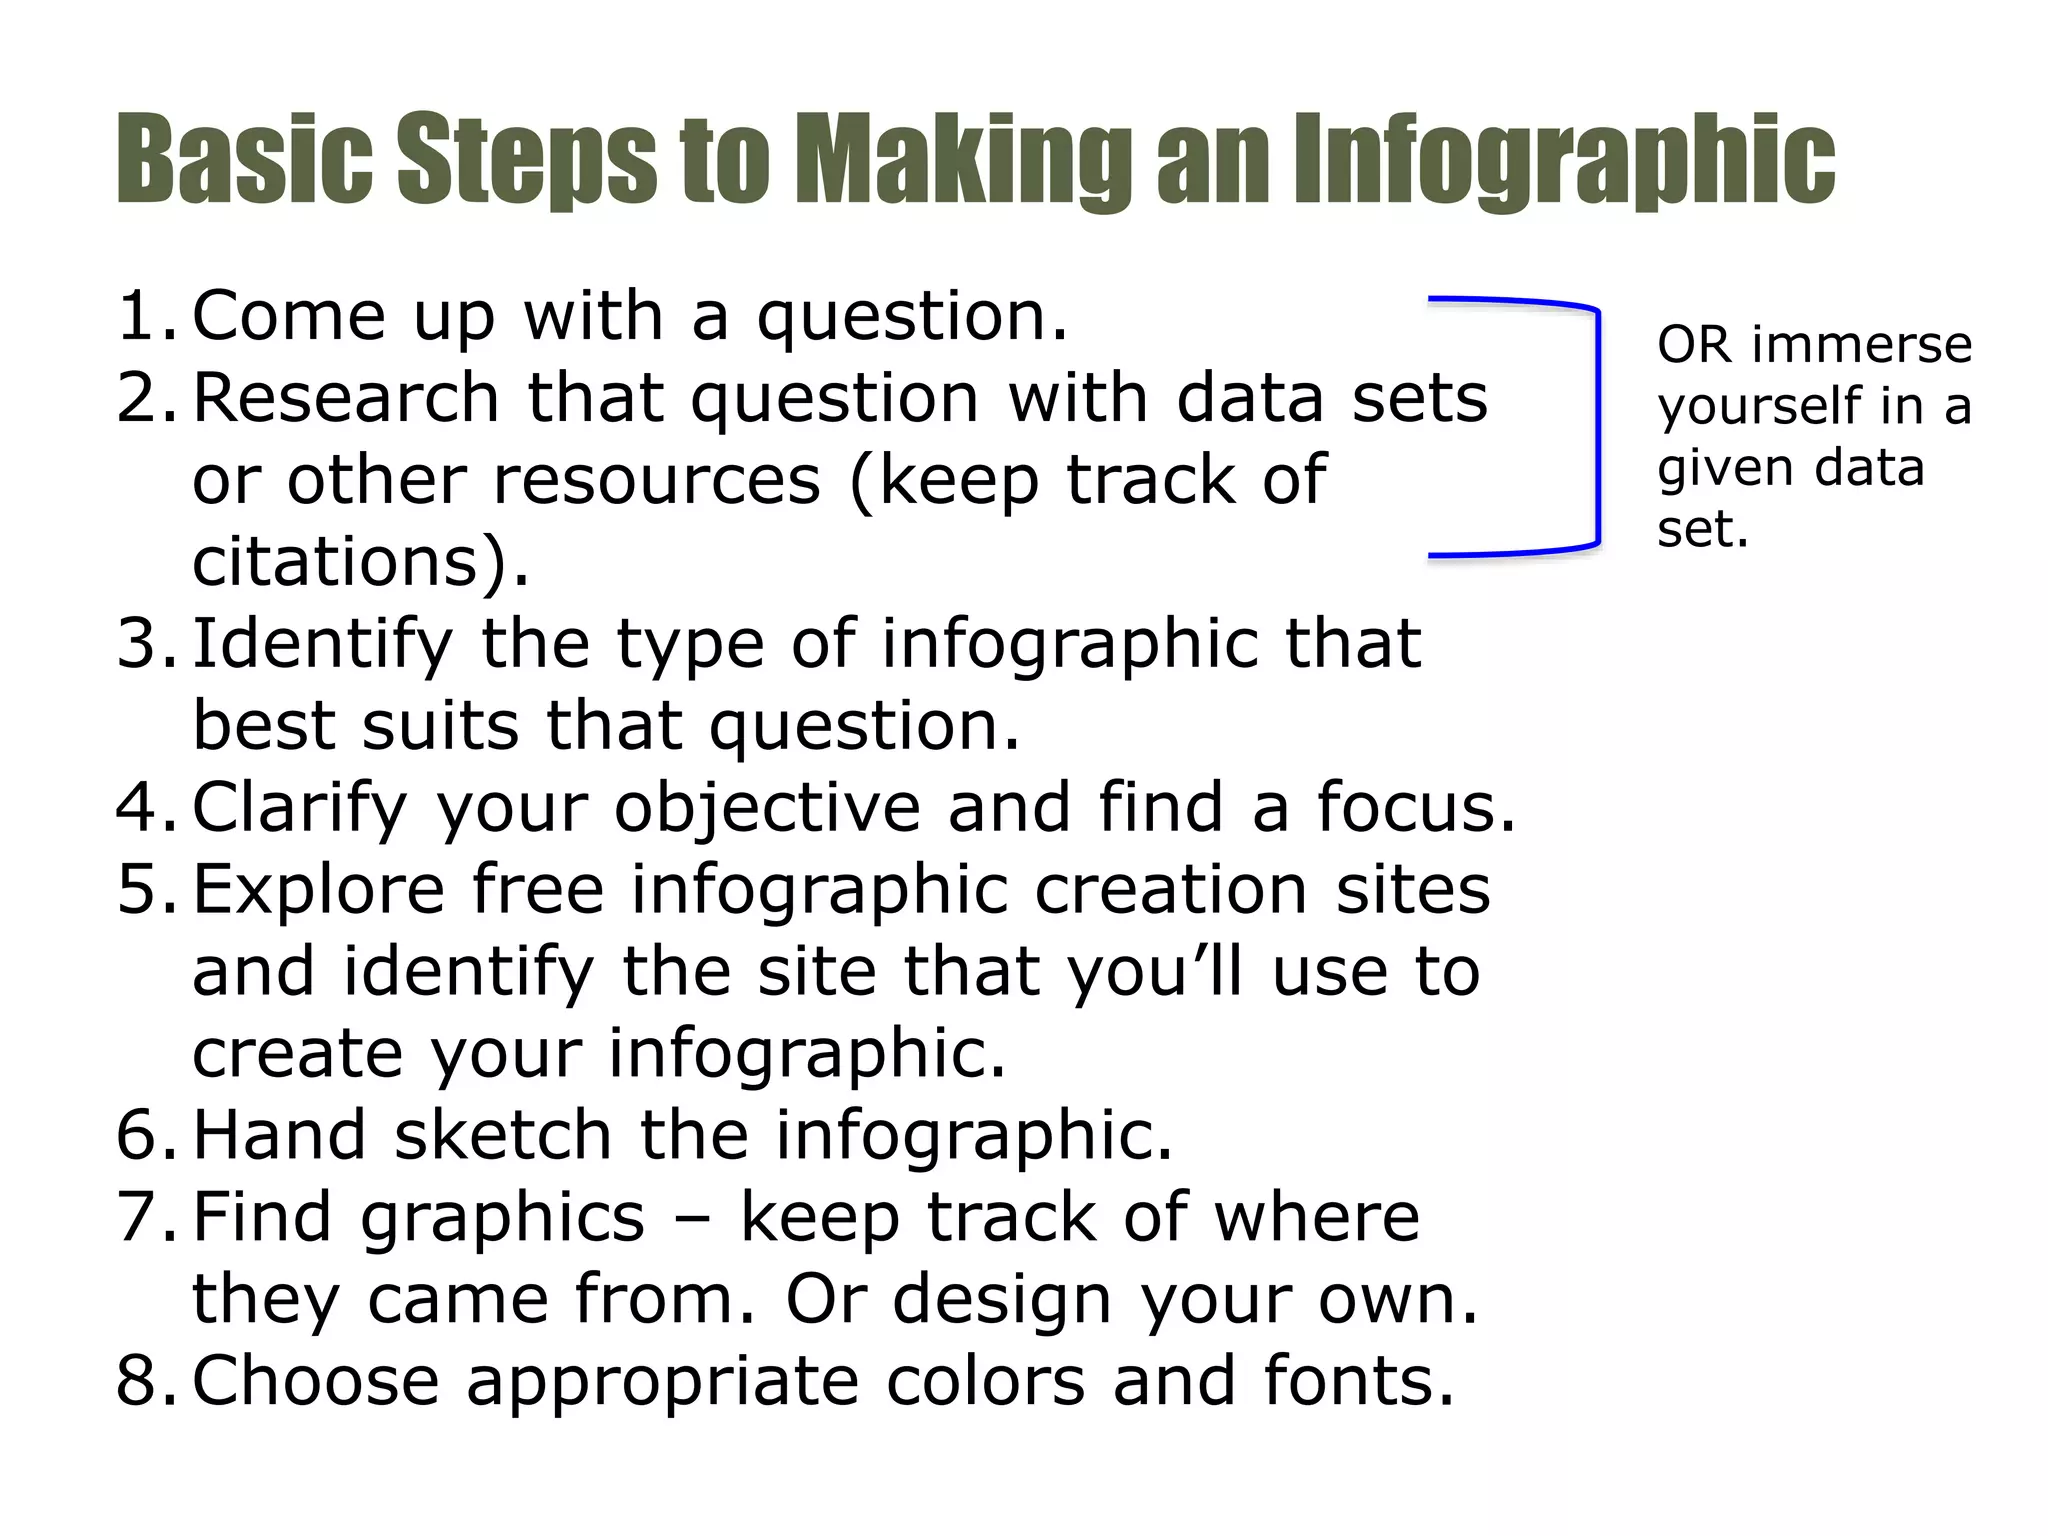
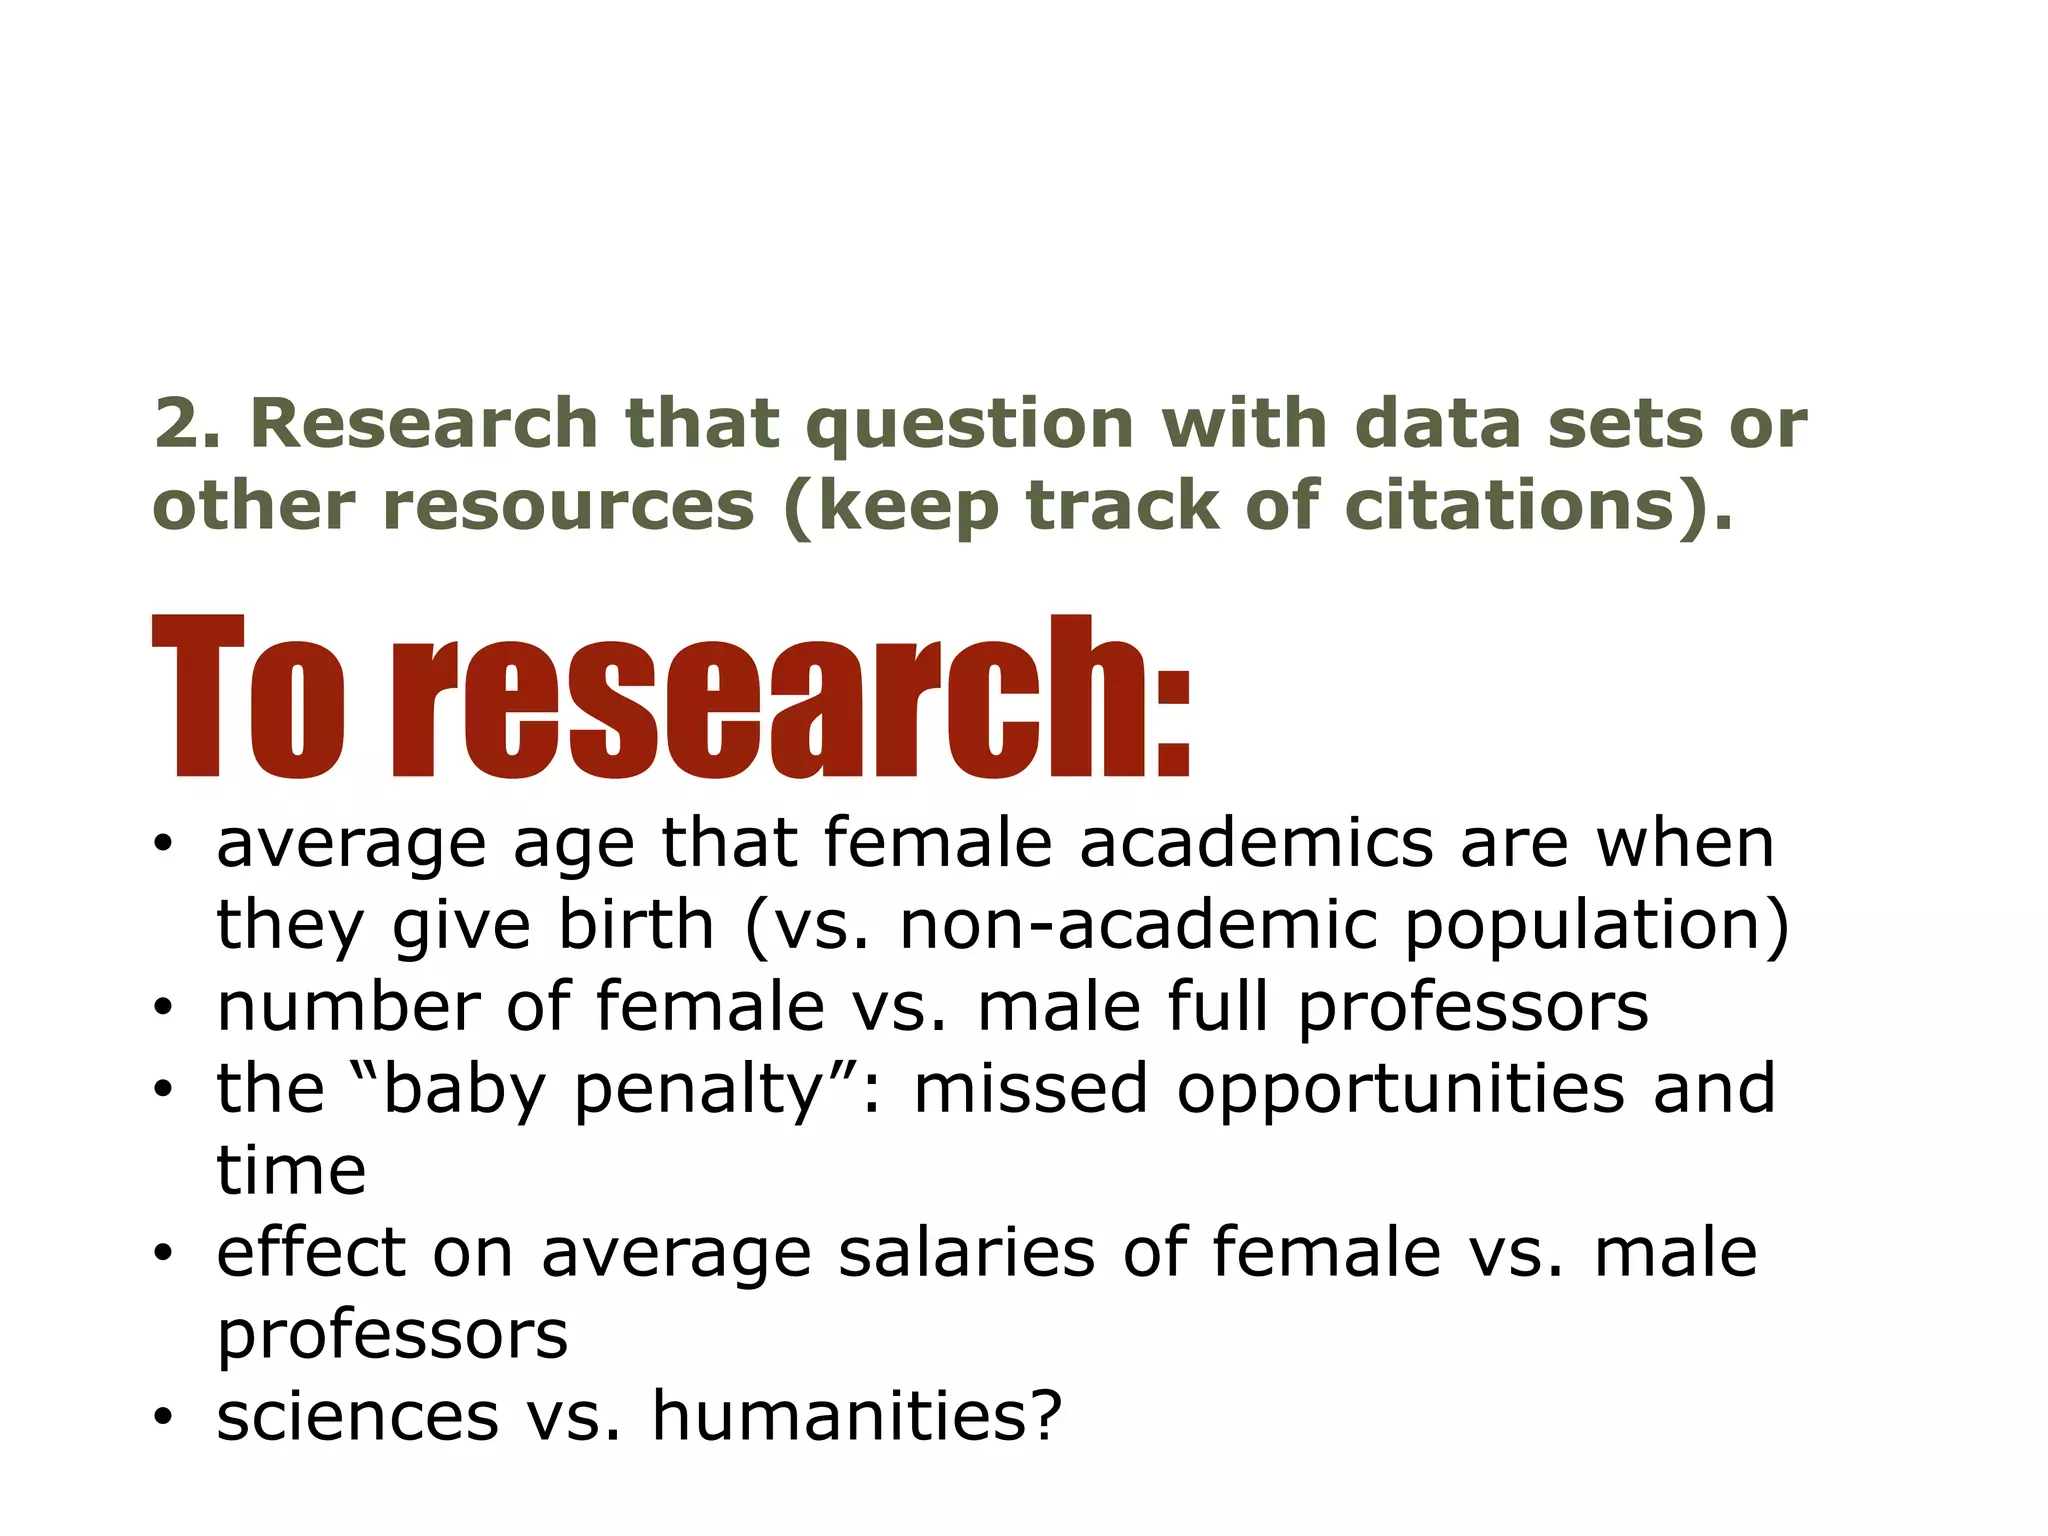
Finding a Format and
Objective for Your
Infographic
8 Types of Infographics:
• Visual Article
• Flow Chart
• Useful Bait*
• Number Porn*
• Timeline*
• Data Visualization*
• Versus
• Photo Infographic
*Most relevant to science writing
Visual Article
Like a listicle:
informative, “facts
about” style. Requires
you to compile
information from
multiple sources.
Flow Chart
Requires a complex question to be answered.
Helps readers make a decision. Often funny.
Useful Bait
Focuses on “how to.” Imagine it hung on a wall
somewhere.
Number Porn
“By the numbers”
style. Caution: easily
turns into a jumbled
mess. Careful design
and strong, clear
visual metaphors are
critical.
Timeline
Presents a chronology or history of an
invention, concept, etc.
Data Visualization
Presents complex information or large data sets
visually, in a way that makes it easy for audiences to
grasp: charts, graphs, tables, maps, etc.
“Versus”
Makes a comparison between two or more things.
Photo
Infographic
Photos organize
the information.
Need to focus
on quality,
lighting, etc.
2 approaches to identifying data for
infographics:
Identify a question that you
want to answer, and research
until you’ve found an objective
and focus.
Find an interesting collection and
immerse yourself in it until you
find an objective and focus. (i.e.
infographic/data visualization
contests)
e.g.
OR
Basic Steps to Making an Infographic
1.Come up with a question.
2.Research that question with data sets
or other resources (keep track of
citations).
3.Identify the type of infographic that
best suits that question.
4.Clarify your objective and find a focus.
5.Explore free infographic creation sites
and identify the site that you’ll use to
create your infographic.
6.Hand sketch the infographic.
7.Find graphics – keep track of where
they came from. Or design your own.
8.Choose appropriate colors and fonts.
OR immerse
yourself in a
given data
set.
Does having children hurt female
academic’s careers?
Q:
1.Come up with a question.
• average age that female academics are when
they give birth (vs. non-academic population)
• number of female vs. male full professors
• the “baby penalty”: missed opportunities and
time
• effect on average salaries of female vs. male
professors
• sciences vs. humanities?
To research:
2. Research that question with data sets or
other resources (keep track of citations).
Objective/focus:
Women in academia are penalized
for having babies.
4. Clarify your objective and find a focus.

Finding a Format and Objective for Your Infographic

  • 1.
    Finding a Formatand Objective for Your Infographic
  • 2.
    8 Types ofInfographics: • Visual Article • Flow Chart • Useful Bait* • Number Porn* • Timeline* • Data Visualization* • Versus • Photo Infographic *Most relevant to science writing
  • 3.
    Visual Article Like alisticle: informative, “facts about” style. Requires you to compile information from multiple sources.
  • 4.
    Flow Chart Requires acomplex question to be answered. Helps readers make a decision. Often funny.
  • 5.
    Useful Bait Focuses on“how to.” Imagine it hung on a wall somewhere.
  • 6.
    Number Porn “By thenumbers” style. Caution: easily turns into a jumbled mess. Careful design and strong, clear visual metaphors are critical.
  • 7.
    Timeline Presents a chronologyor history of an invention, concept, etc.
  • 8.
    Data Visualization Presents complexinformation or large data sets visually, in a way that makes it easy for audiences to grasp: charts, graphs, tables, maps, etc.
  • 9.
    “Versus” Makes a comparisonbetween two or more things.
  • 10.
  • 11.
    2 approaches toidentifying data for infographics: Identify a question that you want to answer, and research until you’ve found an objective and focus. Find an interesting collection and immerse yourself in it until you find an objective and focus. (i.e. infographic/data visualization contests) e.g. OR
  • 12.
    Basic Steps toMaking an Infographic 1.Come up with a question. 2.Research that question with data sets or other resources (keep track of citations). 3.Identify the type of infographic that best suits that question. 4.Clarify your objective and find a focus. 5.Explore free infographic creation sites and identify the site that you’ll use to create your infographic. 6.Hand sketch the infographic. 7.Find graphics – keep track of where they came from. Or design your own. 8.Choose appropriate colors and fonts. OR immerse yourself in a given data set.
  • 13.
    Does having childrenhurt female academic’s careers? Q: 1.Come up with a question.
  • 14.
    • average agethat female academics are when they give birth (vs. non-academic population) • number of female vs. male full professors • the “baby penalty”: missed opportunities and time • effect on average salaries of female vs. male professors • sciences vs. humanities? To research: 2. Research that question with data sets or other resources (keep track of citations).
  • 15.
    Objective/focus: Women in academiaare penalized for having babies. 4. Clarify your objective and find a focus.