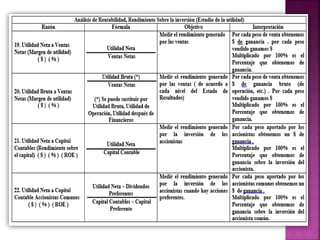
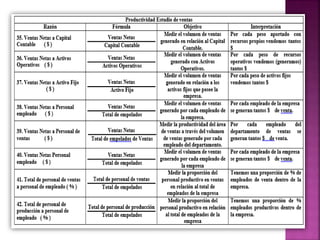
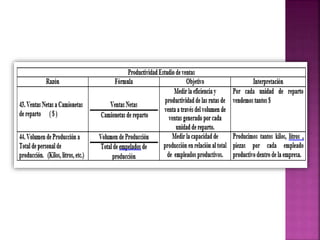
The following is Investopedia's Financial Ratios Tutorial (Eng), made into a PPTx for easy use where internet services are limited. The information only covers the formulas presented, but not the whole process of usage, nor the file the site provides.
Also, it comes with a translated (Spa) chart of the most common financial ratios used in Mexican accounting.
This content is property of the original authors and I claim no ownership over it. Hopefully, it will serve as a tool for promoting knowledge and internationalization.
2. ο This is not your run-off-the-mill PPT: this is a
summary of a very extensive tutorial found
at
http://www.investopedia.com/university/ratio
s/?ad=dirN&qo=investopediaSiteSearch&qsrc=0
&o=40186
So, get ready for very few images and lots of
formulas!
3.
4.
5. ο Current Ratio: The current ratio measures the ability of a
company to cover its short-term liabilities with its current assets.
πΆπ’πππππ‘ π ππ‘ππ =
πΆπ’πππππ‘ π΄π π ππ‘π
πΆπ’πππππ‘ πΏπππππππ‘πππ
ο Quick Ratio: The quick ratio, also known as the acid-test ratio, is
a liquidity ratio that further refines the current ratio by
measuring the level of the most liquid current assets available to
cover current liabilities. The quick ratio is more conservative
than the current ratio because it excludes inventory and other
current assets, which generally are more difficult to turn into
cash. A higher quick ratio means a more liquid current position.
ππ’πππ π ππ‘ππ =
πΆππ β πΈππ’ππ£πππππ‘π + ππππππ‘ππππ ππππ’πππ‘πππ + π΄ππππ’ππ‘π π πππππ£πππππ
πΆπ’πππππ‘ πΏπππππππ‘πππ
6. ο Cash Ratio: The cash ratio is another measurement of a
companyβs liquidity and their ability to meet their short-term
obligations. The formula for the cash ratio, like the current and
the quick ratio, uses current liabilities as the denominator in the
formula.
πΆππ β π ππ‘ππ =
πΆππ β + ππππππ‘ππππ ππππ’πππ‘πππ
πΆπ’πππππ‘ πΏπππππππ‘πππ
ο Cash Conversion Cyle: The cash conversion cycle (CCC) measures
the number of days a company's cash is tied up in the production
and sales process of its operations and the benefit it derives
from payment terms from its creditors. The shorter this cycle,
the more liquid the company's working capital position is. The
CCC is also known as the "cash" or "operating" cycle.
πΆπΆπΆ = π·ππ¦π πΌππ£πππ‘πππ¦ ππ’π‘π π‘ππππππ + π·ππ¦π πππππ ππ’π‘π π‘ππππππ
βπ·ππ¦π πππ¦ππππ ππ’π‘π π‘ππππππ
7. Notes on CCC Formula:
οΌ Days inventory outstanding (DIO) is a measurement of how long
it takes to convert the companyβs outstanding inventory into
cash. This metric is calculated by dividing the companyβs average
inventory by its cost of sales per day.
οΌ Days sales outstanding (DSO) is calculated by dividing the
average accounts receivable figure by the net sales per day
figure. DSO provides an estimate of how long it takes the
company to collect on sales that go into the companyβs accounts
receivable.
οΌ Days payables outstanding (DPO) is calculated by dividing the
companyβs average accounts payable figure by its cost of sales
per day. DPO provides an estimate of how long it takes the
company to pay its suppliers.
8.
9.
10. ο Profit Margin Analysis
In the income statement, there are four levels of profit or profit
margins - gross profit, operating profit, pretax profit and net profit.
The term "margin" can apply to the absolute number for a given
profit level and/or the number as a percentage of net
sales/revenues. Profit margin analysis uses the percentage
calculation to provide a comprehensive measure of a company's
profitability on a historical basis (3-5 years) and in comparison to
peer companies and industry benchmarks.
Basically, it is the amount of profit (at the gross, operating, pretax
or net income level) generated by the company as a percent of the
sales generated. The objective of margin analysis is to detect
consistency or positive/negative trends in a company's earnings.
Positive profit margin analysis translates into positive investment
quality. To a large degree, it is the quality, and growth, of a
company's earnings that drive its stock price.
18. Before discussing the various financial debt ratios, we need to clear up the
terminology used with "debt" as this concept relates to financial statement
presentations. In addition, the debt-related topics of "funded debt" and
credit ratings are discussed below.
There are two types of liabilities - operational and debt. The former
includes balance sheet accounts, such as accounts payable, accrued
expenses, taxes payable, pension obligations, etc. The latter includes notes
payable and other short-term borrowings, the current portion of long-term
borrowings, and long-term borrowings. Often times, in investment
literature, "debt" is used synonymously with total liabilities. In other
instances, it only refers to a company's indebtedness.
The debt ratios that are explained herein are those that are most commonly
used. However, what companies, financial analysts and investment research
services use as components to calculate these ratios is far from
standardized. In the definition paragraph for each ratio, no matter how the
ratio is titled, we will clearly indicate what type of debt is being used in our
measurements.
Getting the Terms Straight
In general, debt analysis can be broken down into three categories, or
interpretations: liberal, moderate and conservative. Since we will use this
language in our commentary paragraphs, it's worthwhile explaining how
these interpretations of debt apply.
19. οΆ Liberal - This approach tends to minimize the amount of debt. It
includes only long-term debt as it is recorded in the balance
sheet under non-current liabilities.
οΆ Moderate - This approach includes current borrowings (notes
payable) and the current portion of long-term debt, which
appear in the balance sheet's current liabilities; and, of course,
the long-term debt recorded in non-current liabilities previously
mentioned. In addition, redeemable preferred stock, because of
its debt-like quality, is considered to be debt. Lastly, as general
rule, two-thirds (roughly one-third goes to interest expense) of
the outstanding balance of operating leases, which do not appear
in the balance sheet, are considered debt principal. The relevant
figure will be found in the notes to financial statements and
identified as "future minimum lease payments required under
operating leases that have initial or remaining non-cancel-able
lease terms in excess of one year."
οΆ Conservative - This approach includes all the items used in the
moderate interpretation of debt, as well as such non-current
operational liabilities such as deferred taxes, pension liabilities
and other post-retirement employee benefits.
20. Note: New accounting standards, which are currently under active
consideration in the U.S. by the Financial Accounting Standards
Board (FASB) and internationally by the International Accounting
Standards Board (IASB), will eventually put the debt principal of
operating leases and unfunded pension liabilities in the balance
sheet as debt liabilities. Formal "Discussion Papers" on these issues
are planned by FASB and IASB in 2008, with adoption of the changes
following the discussion phase expected in 2009.
Investors may want to look to the middle ground when deciding
what to include in a company's debt position. With the exception of
unfunded pension liabilities, a company's non-current operational
liabilities represent obligations that will be around, at one level or
another, forever - at least until the company ceases to be a going
concern and is liquidated.
Also, unlike debt, there are no fixed payments or interest expenses
associated with non-current operational liabilities. In other words,
it is more meaningful for investors to view a company's
indebtedness and obligations through the company as a going
concern, and therefore, to use the moderate approach to defining
debt in their leverage calculations.
21. So-called "funded debt" is a term that is seldom used in financial
reporting. Technically, funded debt refers to that portion of a
company's debt comprised, generally, of long-term, fixed maturity,
contractual borrowings. No matter how problematic a company's
financial condition, holders of these obligations, typically bonds,
cannot demand payment as long as the company pays the interest
on its funded debt. In contrast, long-term bank debt is usually
subject to acceleration clauses and/or restrictive covenants that
allow a lender to call its loan, i.e., demand its immediate payment.
From an investor's perspective, the greater the percentage of
funded debt in the company's total debt, the better.
Lastly, credit ratings are formal risk evaluations by credit agencies -
Moody's, Standard & Poor's, Duff & Phelps, and Fitch - of a
company's ability to repay principal and interest on its debt
obligations, principally bonds and commercial paper. Obviously,
investors in both bonds and stocks follow these ratings rather
closely as indicators of a company's investment quality. If the
company's credit ratings are not mentioned in their financial
reporting, it's easy to obtain them from the company's investor
relations department.
37. ο Cash Flow Coverage Ratios
What on
Earth is a
Capital
Expenditure
(CAPEX)???
38. Cash Flow Coverage Ratios: CAPEX breakdown
The difference between capital expenditures and revenue expenditures
is essentially the same as the difference between capital expenditures
and operating expenses.
Capital expenditures represent major investments of capital that a
company makes to maintain or, more often, to expand its business and
generate additional profits. Capital expenses are for the acquisition
of long-term assets, such as facilities or manufacturing equipment.
Because such assets provide income-generating value for a company for a
period of years, companies are not allowed to deduct the full cost of the
asset in the year the expense is incurred; they must recover the cost
through year-by-year depreciation over the useful life of the asset.
Companies often use debt financing or equity financing to cover the
substantial costs involved in acquiring major assets for expanding their
business.
39. Cash Flow Coverage Ratios: CAPEX breakdown
Revenue expenses are shorter-term expenses required to meet the
ongoing operational costs of running a business, and thus are essentially
the same as operating expenses. Unlike capital expenditures, revenue
expenses can be fully tax-deducted in the same year the expenses occur.
In relation to the major asset purchases that qualify as capital
expenditures, revenue expenditures include the ordinary repair and
maintenance costs that are necessary to keep the asset in working order
without substantially improving or extending the useful life of the asset.
Revenue expenses related to existing assets include repairs and regular
maintenance as well as repainting and renewal expenses. Revenue
expenditures can be considered to be recurring expenses in contrast to
the one-off nature of most capital expenditures.
The purpose of capital expenditures is commonly to expand a company's
ability to generate earnings, whereas revenue expenditures are more
commonly for the purpose of maintaining a company's ability to operate.
Capital expenditures appear as an asset on a company's balance sheet;
revenue expenses are listed with liabilities.
43. Per Share Data
Before discussing valuation ratios, it's worthwhile to briefly review some concepts
that are integral to the interpretation and calculation of the most commonly
used per share indicators.
Per-share data can involve any number of items in a company's financial position.
In corporate financial reporting - such as the annual report, Forms 10-K and 10-
Q (annual and quarterly reports, respectively, to the SEC) - most per-share data
can be found in these statements, including earnings and dividends.
Additional per-share items (which are often reported by investment research
services) also include sales (revenue), earnings growth and cash flow. To calculate
sales, earnings and cash flow per share, a weighted average of the number of
shares outstanding is used. For book value per share, the fiscal yearend number of
shares is used. Investors can rely on companies and investment research services
to report earnings per share on this basis.
In the case of earnings per share, a distinction is made
between basic and diluted income per share. In the case of the latter, companies
with outstanding warrants, stock options, and convertible preferred shares and
bonds would report diluted earnings per share in addition to their basic earnings
per share.
44. Per Share Data
The concept behind this treatment is that if converted to common shares, all
these convertible securities would increase a company's shares outstanding.
While it is unlikely for any or all of these items to be exchanged for common
stock in their entirety at the same time, conservative accounting conventions
dictate that this potential dilution (an increase in a company's shares
outstanding) be reported. Therefore, earnings per share come in two varieties -
basic and diluted (also referred to as fully diluted).
An investor should carefully consider the diluted share amount if it differs
significantly from the basic share amount. A company's share price could suffer if
a large number of the option holders of its convertible securities decide to switch
to stock.
For example, let's say that XYZ Corp. currently has one million shares
outstanding, one million in convertible options outstanding (assumes each option
gives the right to buy one share), and the company's earnings per share are $3. If
all the options were exercised (converted), there would be two million shares
outstanding. In this extreme example, XYZ's earnings per share would drop from
$3 to $1.50 and its share place would plummet.
While it is not very common, when companies sell off and/or shut down a
component of their operations, their earnings per share (both basic and diluted)
will be reported with an additional qualification, which is presented as being
based on continuing and discontinued operations.
45. Per Share Data
The absolute dollar amounts for earnings, sales, cash flow and book value
are worthwhile for investors to review on a year-to-year basis. However, in
order for this data to be used in calculating investment valuations, these
dollar amounts must be converted to a per-share basis and compared to a
stock's current price. It is this comparison that gives rise to the common use
of the expression "multiple" when referring to the relationship of a
company's stock price (per share) to its per-share metrics of earnings, sales,
cash flow and book value. These so-called valuation ratios provide investors
with an estimation, albeit a simplistic one, of whether a stock price is too
high, reasonable, or a bargain as an investment opportunity.
Lastly, it is very important to once again to remind investors that while
some financial ratios have general rules (or a broad application), in most
instances it is a prudent practice to look at a company's historical
performance and use peer company/industry comparisons to put any given
company's ratio in perspective. This is particularly true of investment
valuation ratios. This paragraph, therefore, should be considered as an
integral part of the discussion of each of the following ratios.