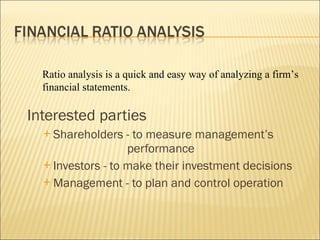
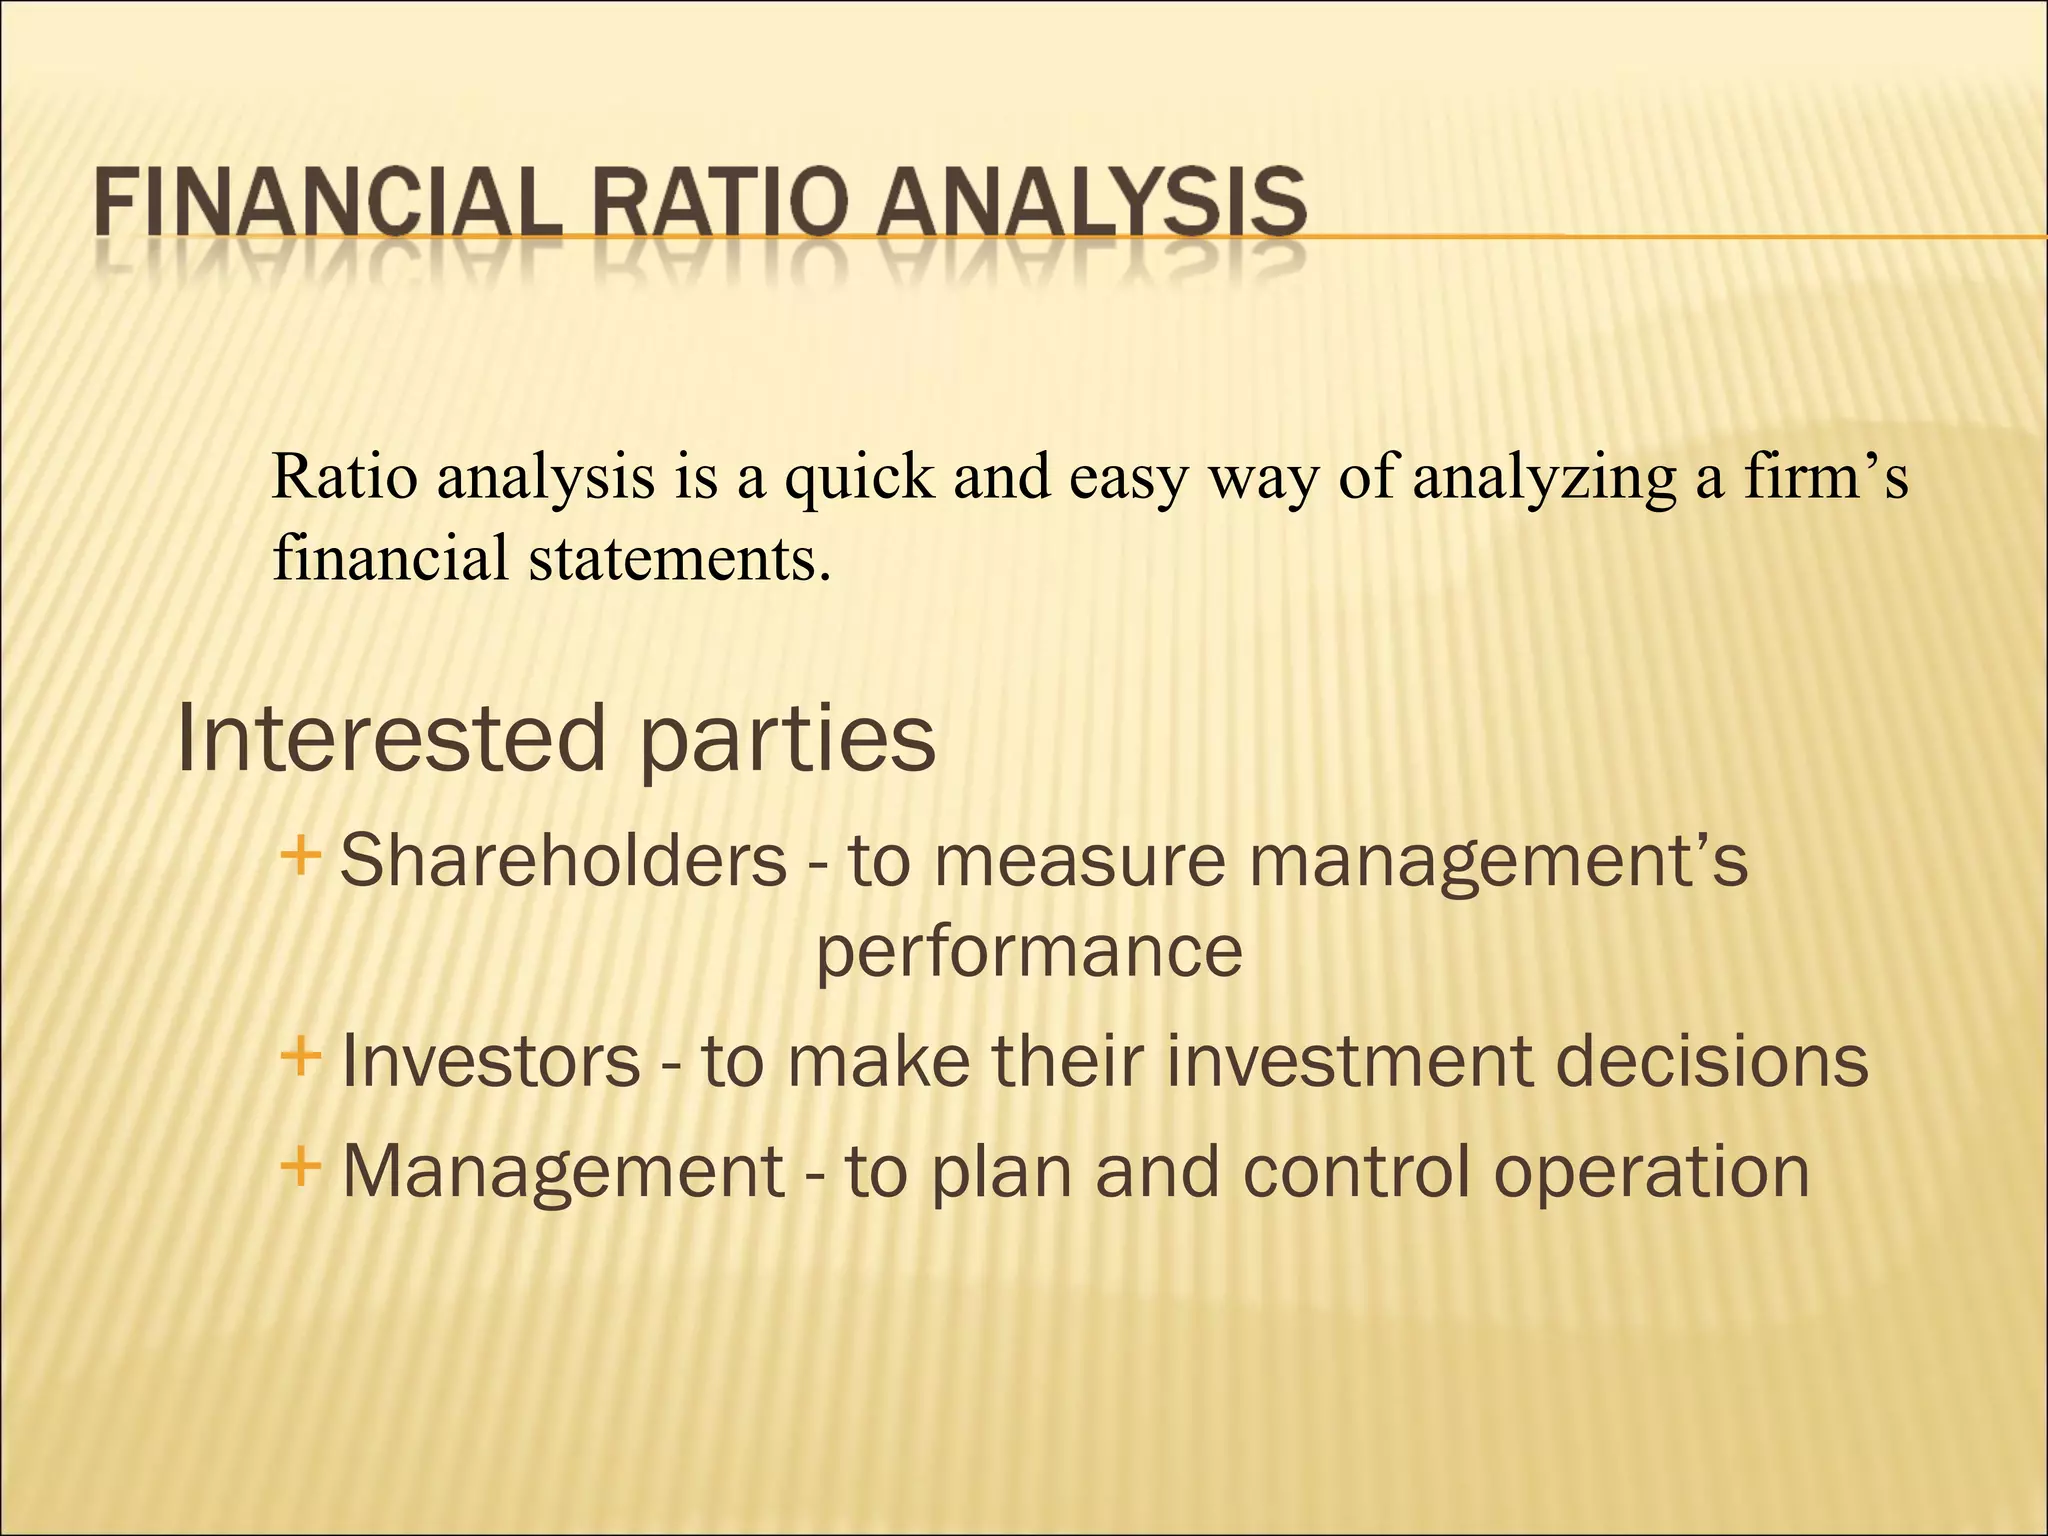
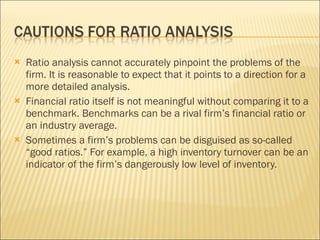
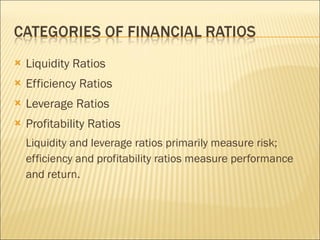
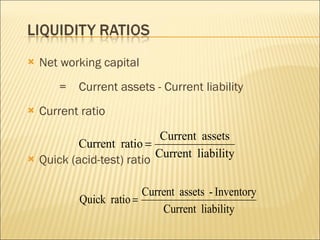
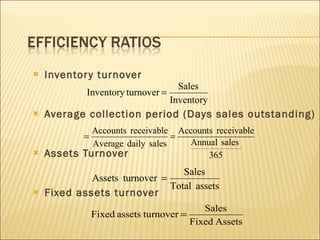
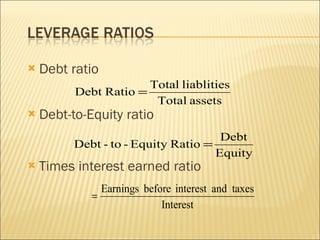
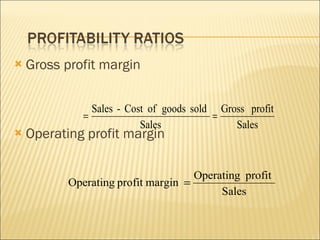
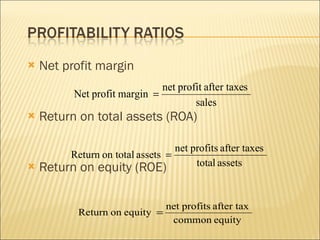
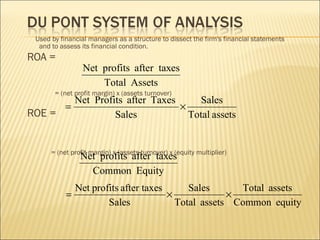
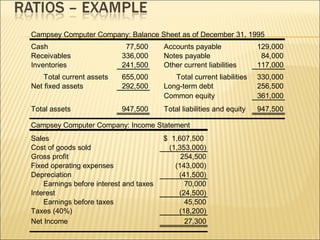
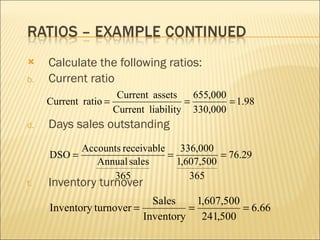
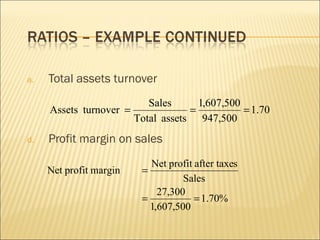
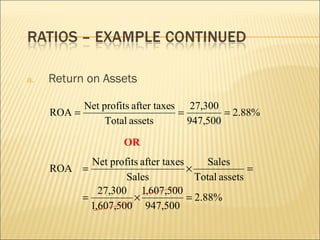
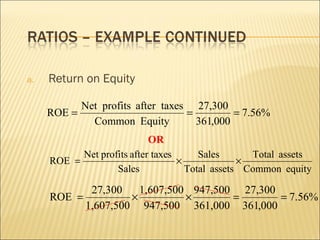
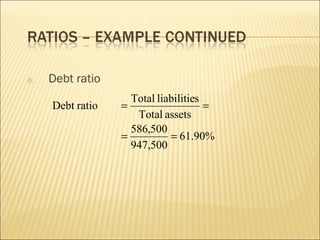
Interested parties Shareholders - to measure management’s     performance Investors - to make their investment decisions Management - to plan and control operation Ratio analysis is a quick and easy way of analyzing a firm’s financial statements.
Ratio analysis cannot accurately pinpoint the problems of the firm. It is reasonable to expect that it points to a direction for a more detailed analysis. Financial ratio itself is not meaningful without comparing it to a benchmark. Benchmarks can be a rival firm’s financial ratio or an industry average.  Sometimes a firm’s problems can be disguised as so-called “good ratios.” For example, a high inventory turnover can be an indicator of the firm’s dangerously low level of inventory.
Liquidity Ratios Efficiency Ratios Leverage Ratios Profitability Ratios Liquidity and leverage ratios primarily measure risk; efficiency and profitability ratios measure performance and return.
Net working capital  =  Current assets - Current liability Current ratio Quick (acid-test) ratio
Inventory turnover Average collection period (Days sales outstanding) Assets Turnover Fixed assets turnover
Debt ratio Debt-to-Equity ratio Times interest earned ratio
Gross profit margin Operating profit margin
Net profit margin Return on total assets (ROA)   Return on equity (ROE)
Used by financial managers as a structure to dissect the firm's financial statements and to assess its financial condition. ROA =    = (net profit margin) x (assets turnover)  ROE =  = (net profit margin) x (assets turnover) x (equity multiplier)
 
Calculate the following ratios: Current ratio  Days sales outstanding Inventory turnover
Total assets turnover Profit margin on sales
Return on Assets OR
Return on Equity OR
Debt ratio
 

Ratio Analysis Er. S Sood

  • 1.
    Interested parties Shareholders- to measure management’s performance Investors - to make their investment decisions Management - to plan and control operation Ratio analysis is a quick and easy way of analyzing a firm’s financial statements.
  • 2.
    Ratio analysis cannotaccurately pinpoint the problems of the firm. It is reasonable to expect that it points to a direction for a more detailed analysis. Financial ratio itself is not meaningful without comparing it to a benchmark. Benchmarks can be a rival firm’s financial ratio or an industry average. Sometimes a firm’s problems can be disguised as so-called “good ratios.” For example, a high inventory turnover can be an indicator of the firm’s dangerously low level of inventory.
  • 3.
    Liquidity Ratios EfficiencyRatios Leverage Ratios Profitability Ratios Liquidity and leverage ratios primarily measure risk; efficiency and profitability ratios measure performance and return.
  • 4.
    Net working capital = Current assets - Current liability Current ratio Quick (acid-test) ratio
  • 5.
    Inventory turnover Averagecollection period (Days sales outstanding) Assets Turnover Fixed assets turnover
  • 6.
    Debt ratio Debt-to-Equityratio Times interest earned ratio
  • 7.
    Gross profit marginOperating profit margin
  • 8.
    Net profit marginReturn on total assets (ROA) Return on equity (ROE)
  • 9.
    Used by financialmanagers as a structure to dissect the firm's financial statements and to assess its financial condition. ROA = = (net profit margin) x (assets turnover) ROE = = (net profit margin) x (assets turnover) x (equity multiplier)
  • 10.
  • 11.
    Calculate the followingratios: Current ratio Days sales outstanding Inventory turnover
  • 12.
    Total assets turnoverProfit margin on sales
  • 13.
  • 14.
  • 15.
  • 16.