Downloaded 10 times

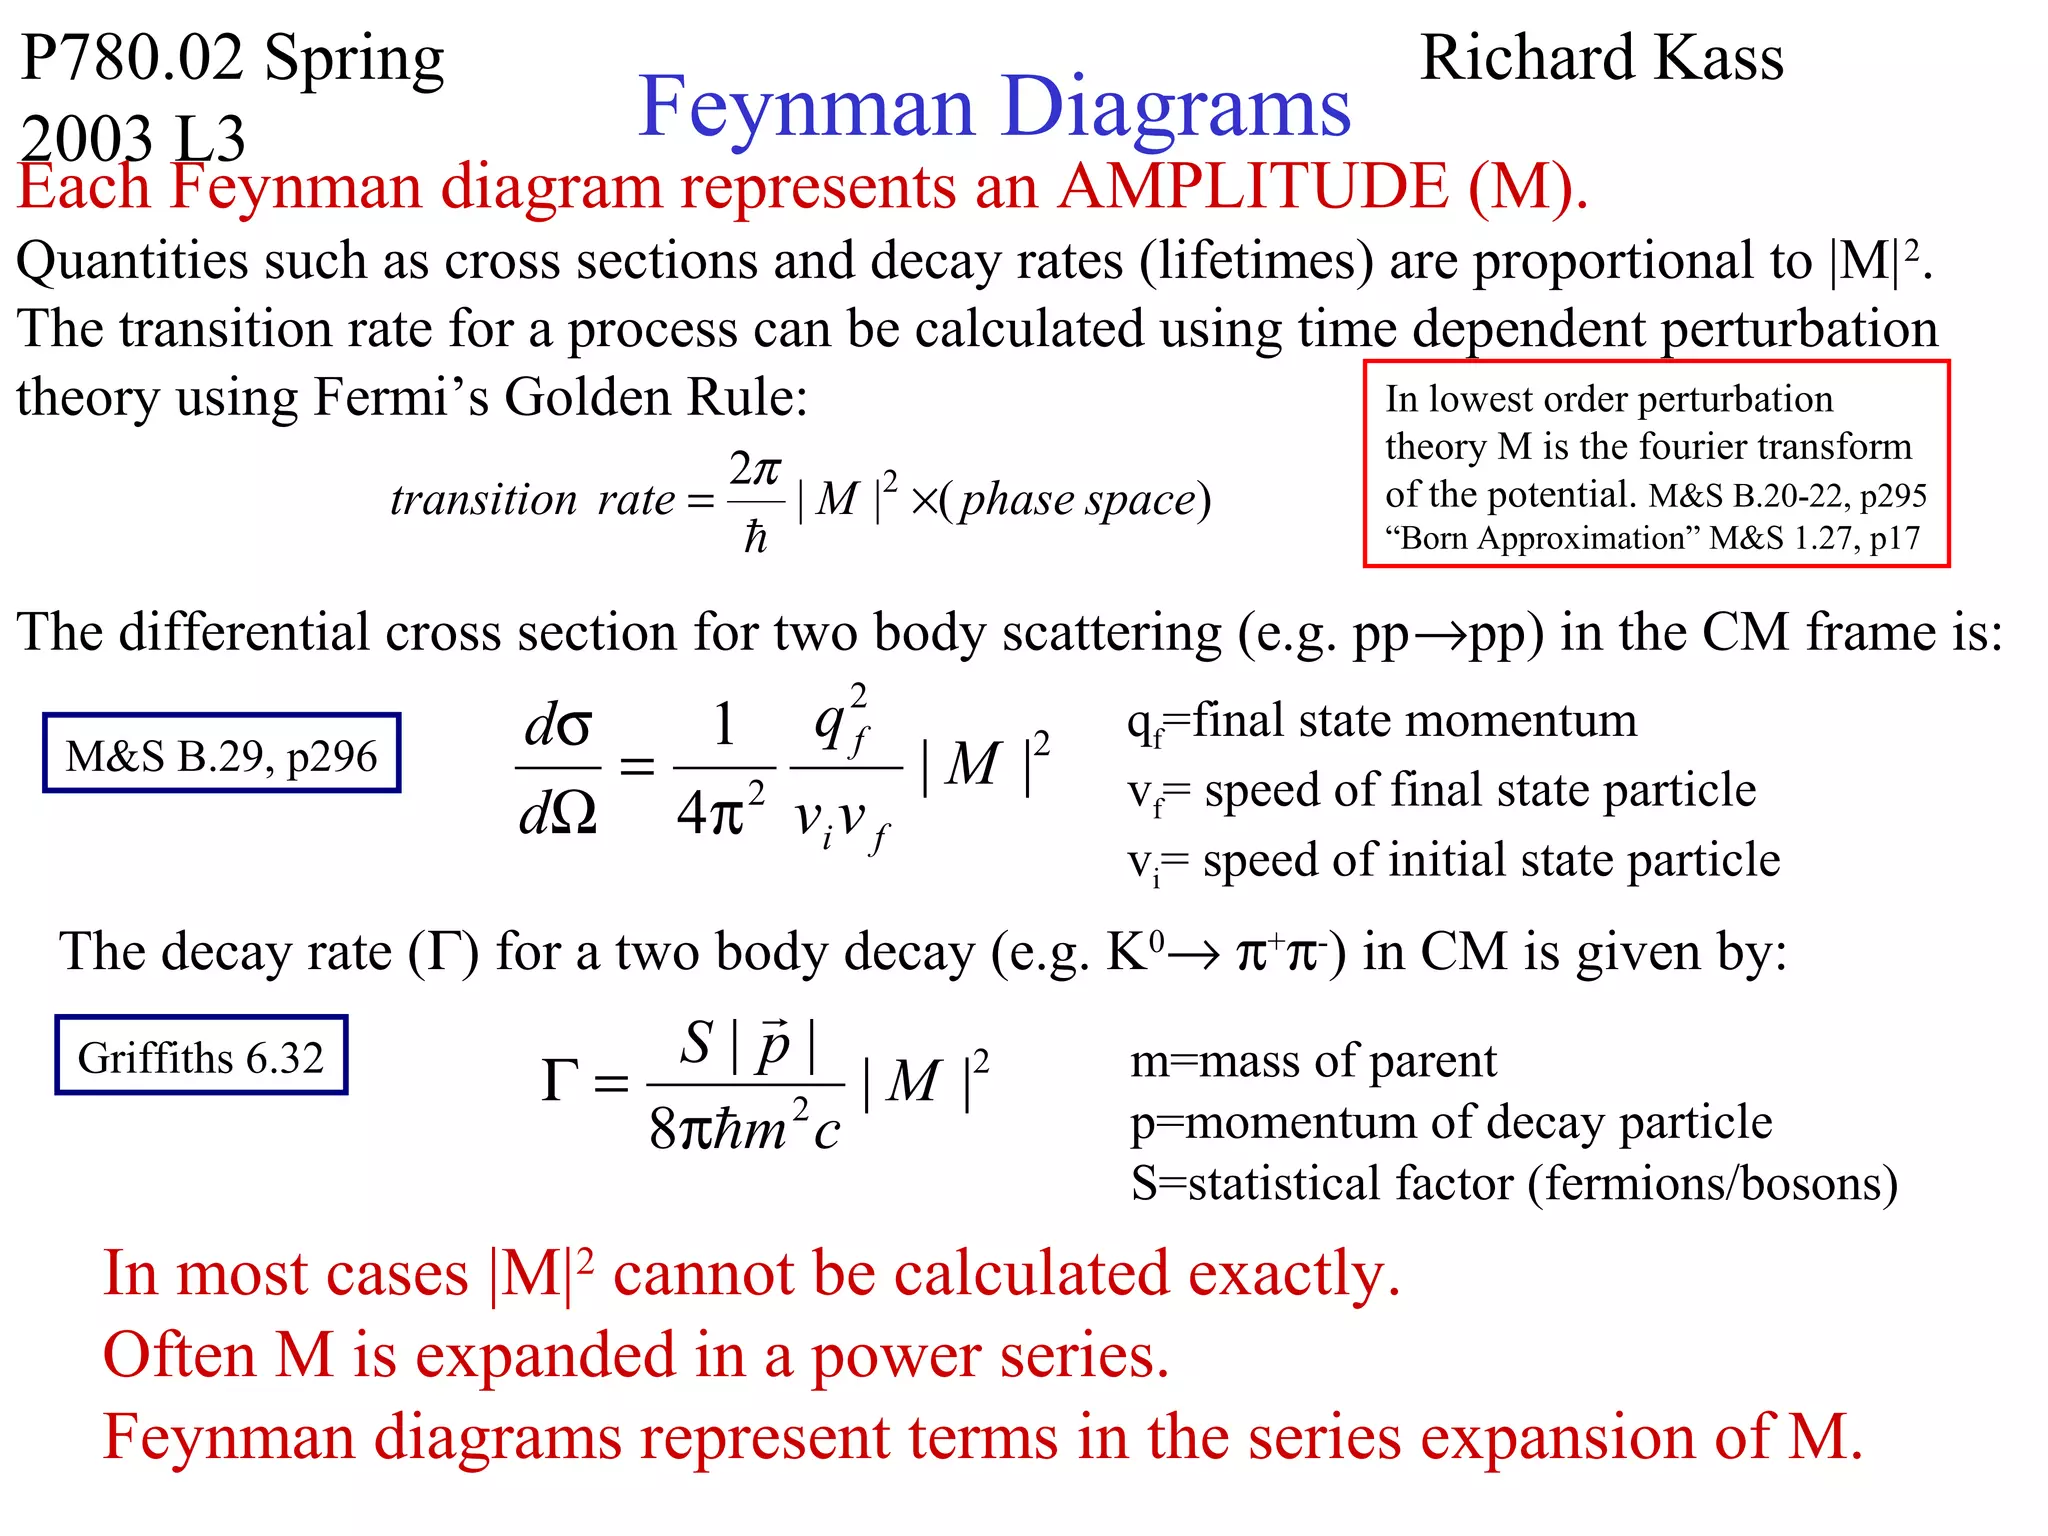

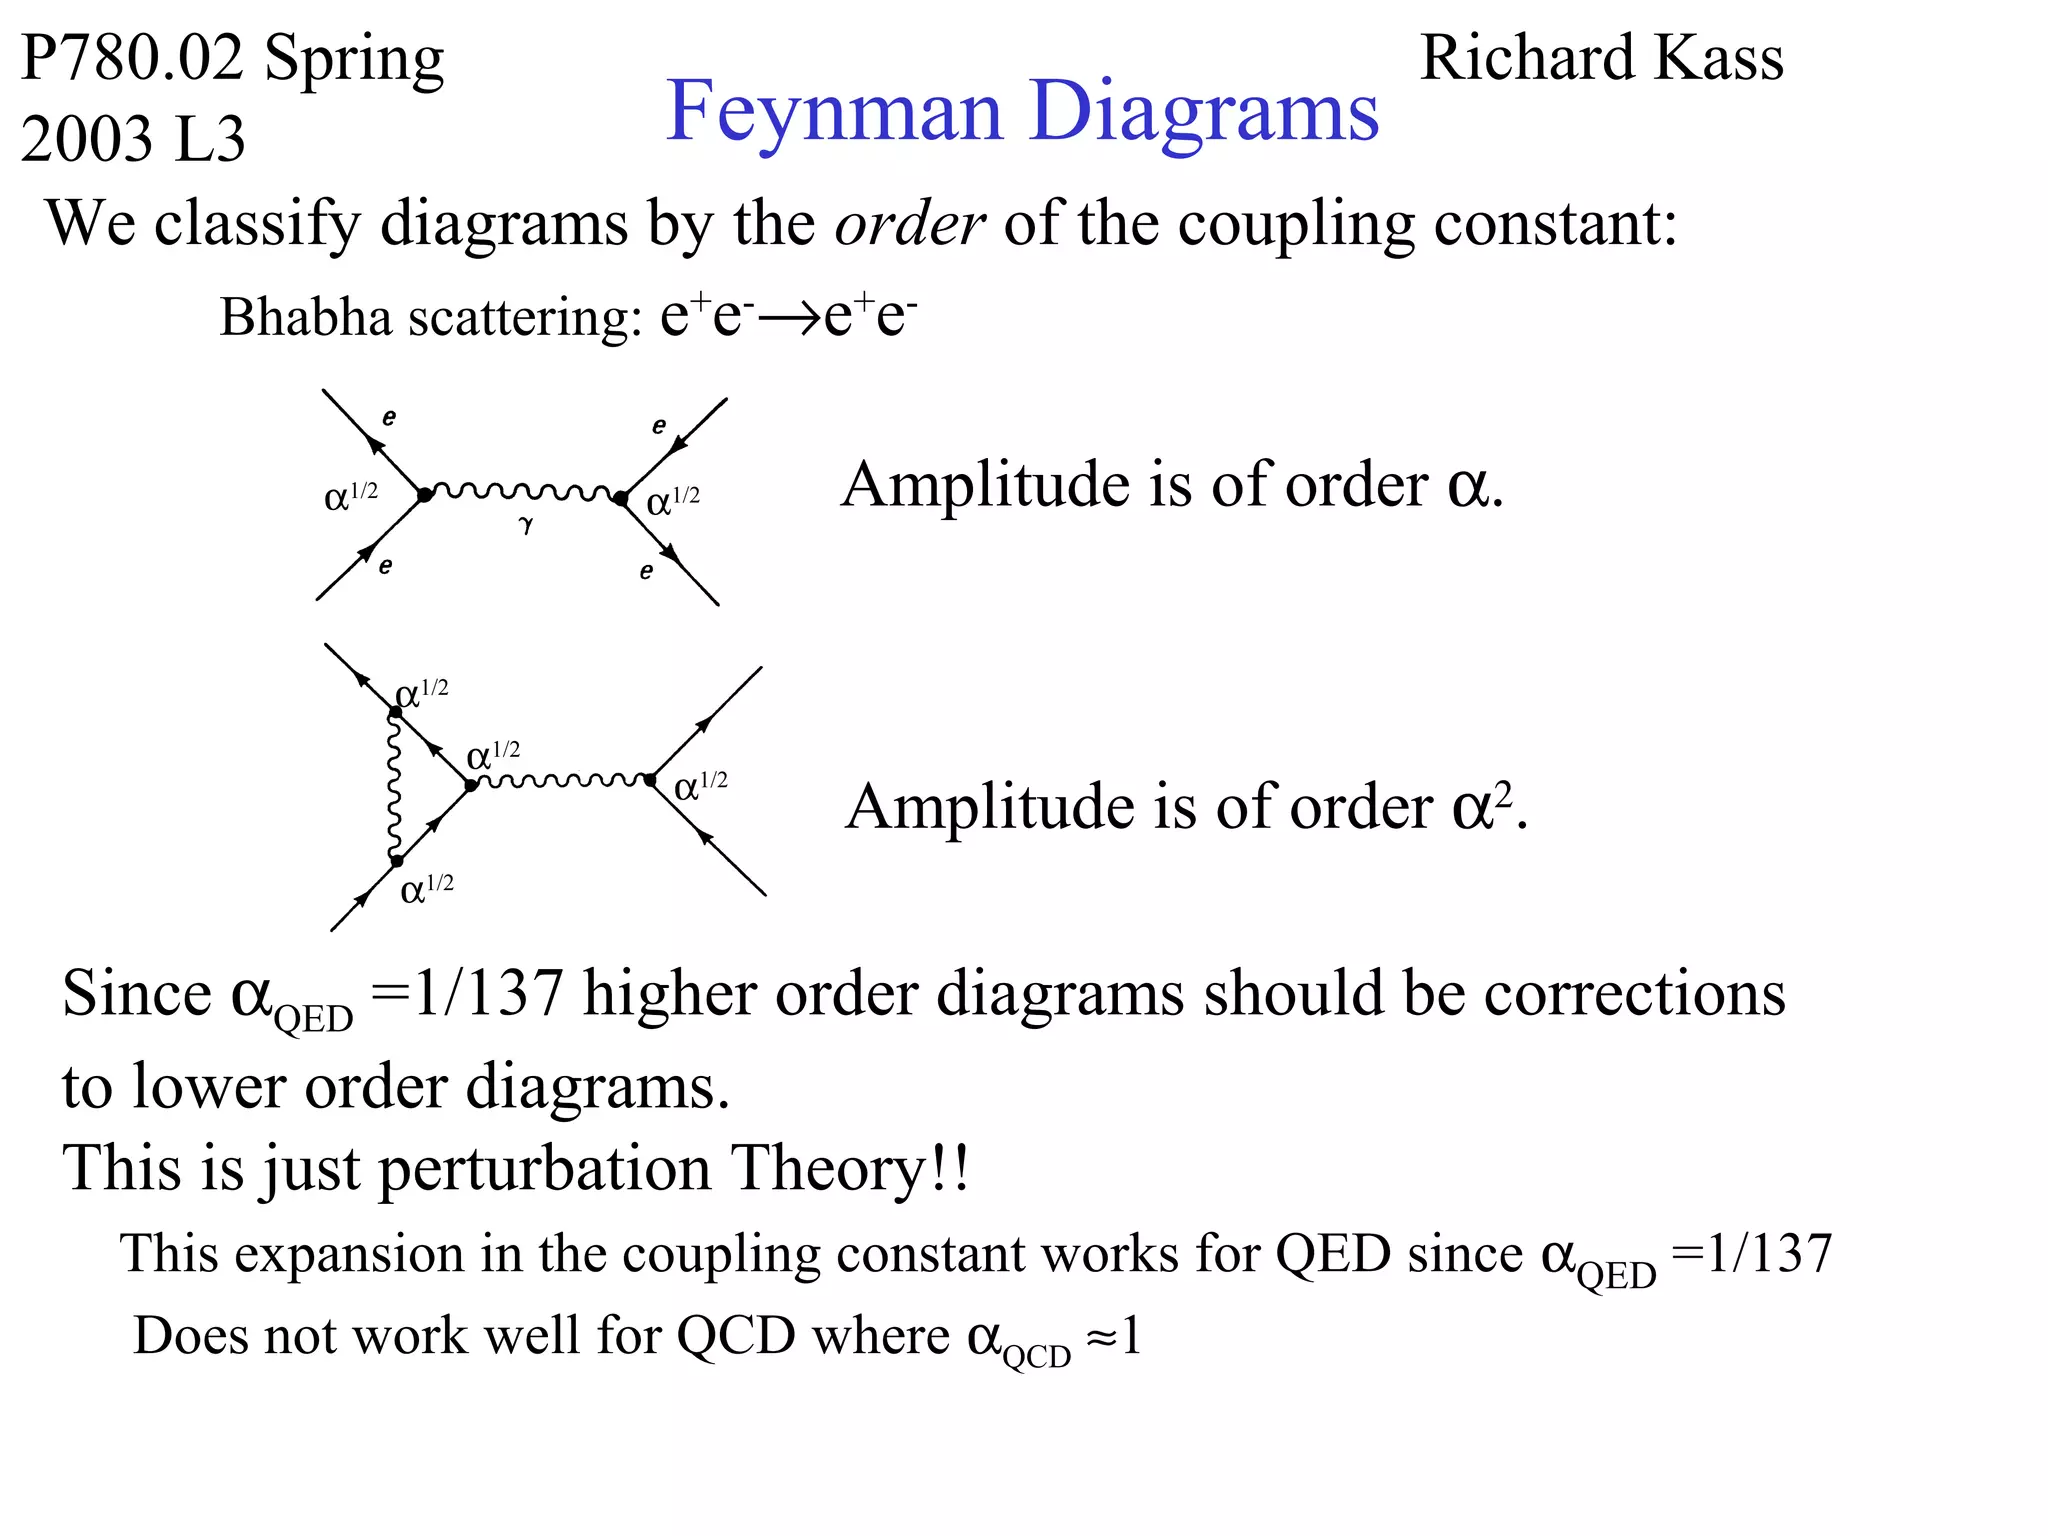

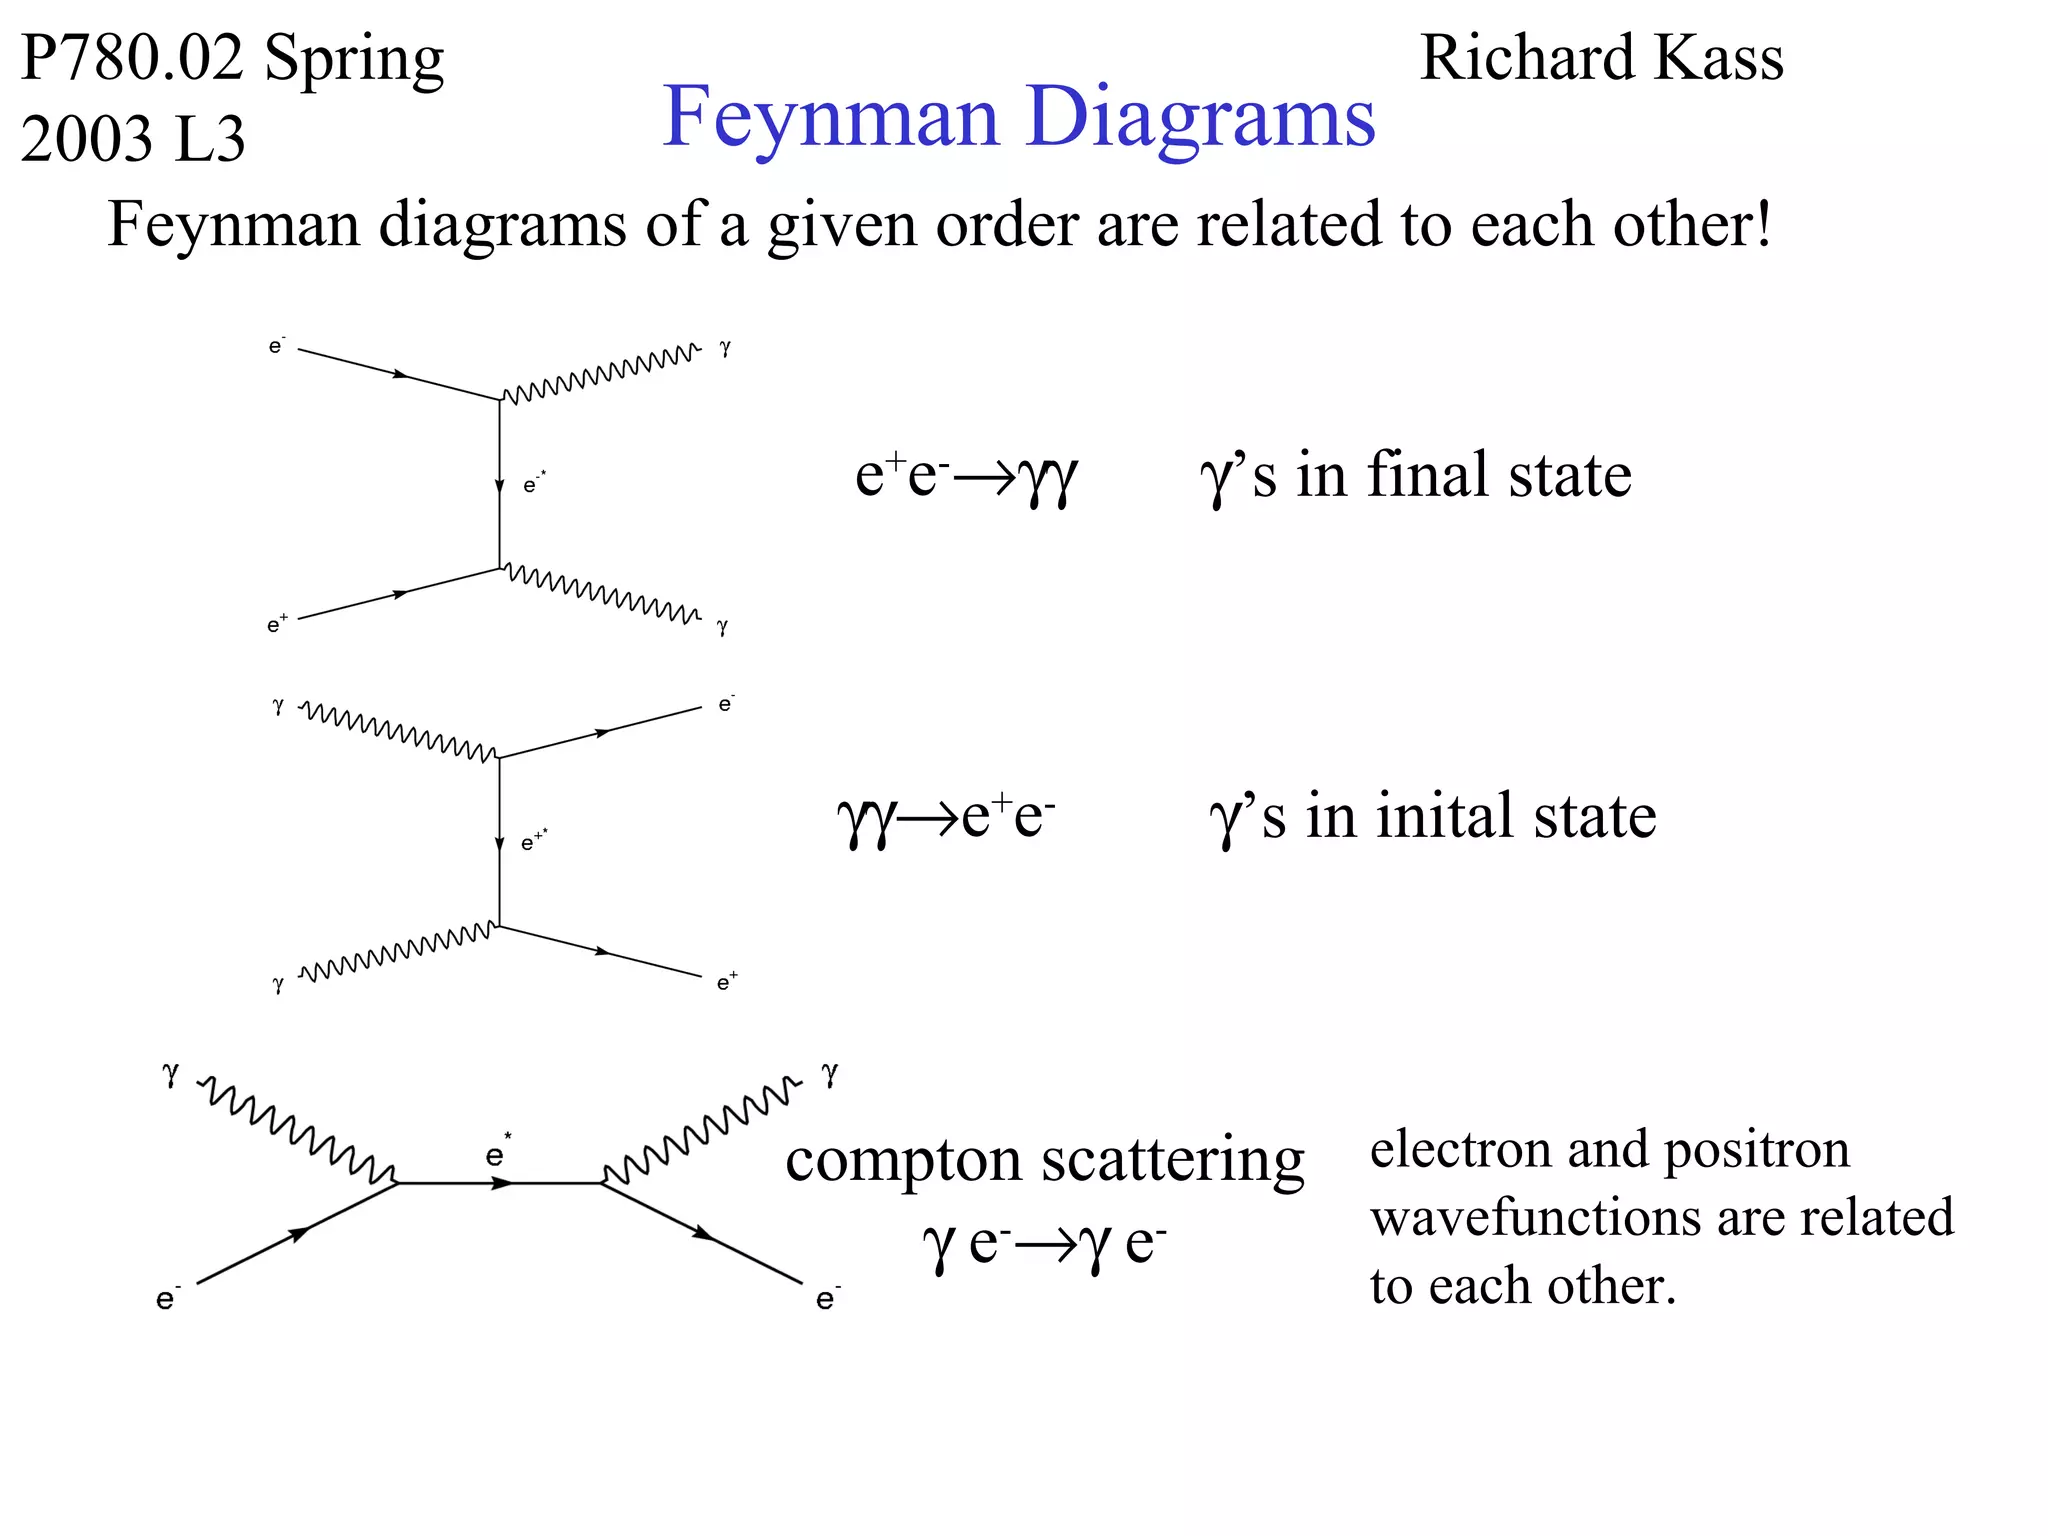


Feynman diagrams are pictorial representations of particle reaction amplitudes. They allow calculations of rates and cross sections for physical processes like muon decay or electron-positron scattering to be greatly simplified. Each diagram has a strict mathematical interpretation corresponding to terms in a power series expansion of the reaction amplitude. Diagrams become more complex at higher orders but must be combined correctly while respecting conservation laws and process symmetries to obtain the total amplitude. The anomalous magnetic moment of particles like the electron and muon can be calculated order-by-order using Feynman diagrams, with remarkable agreement between theory and precise measurements.


