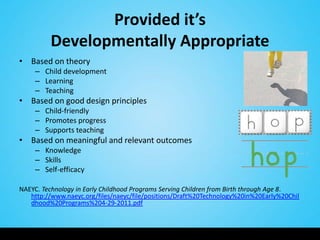
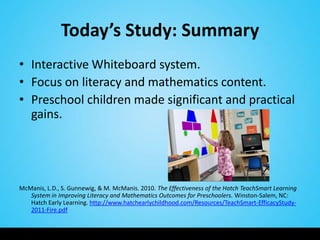
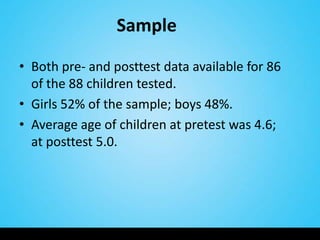
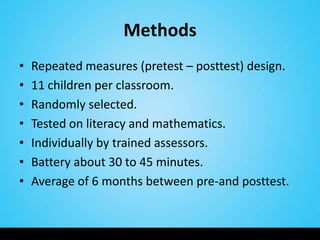
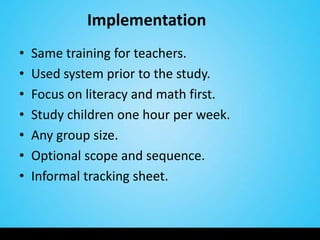
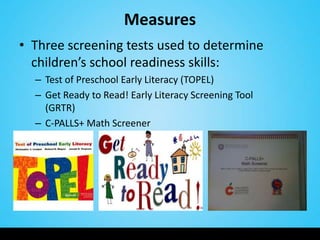
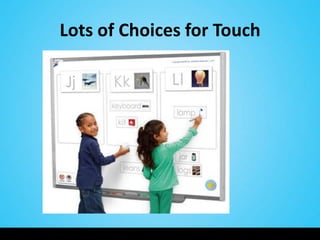
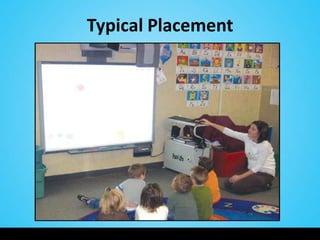
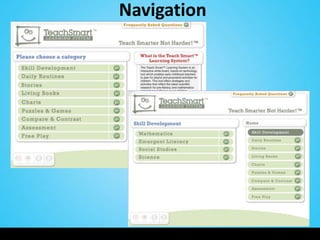
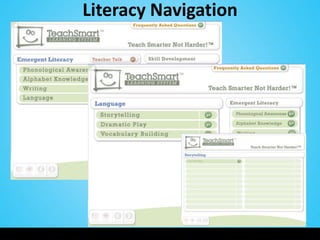
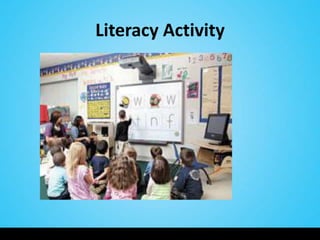
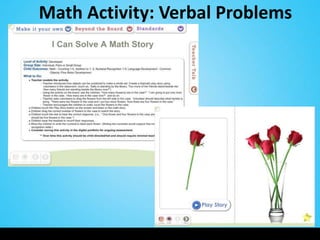
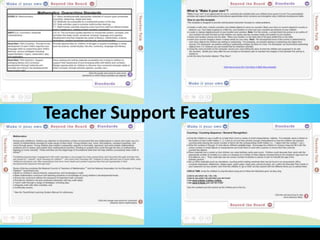
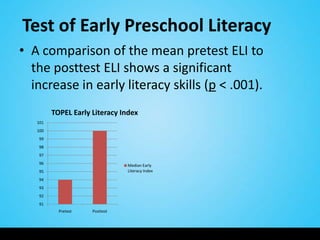
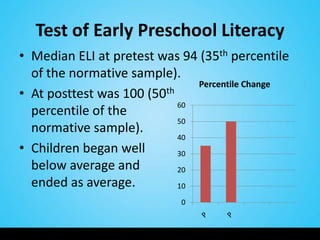
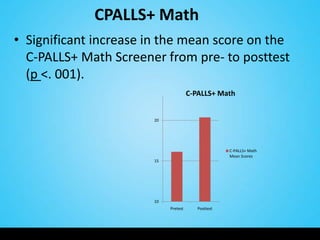
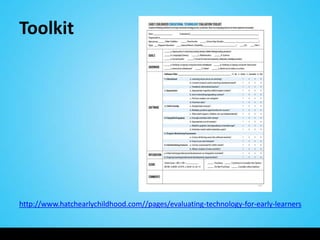
Interactive Whiteboard + Content = Preschool
          Literacy and Math Success


 FETC Conference                    January 2012
 Lilla Dale McManis, PhD            Tryna King
 dmcmanis@hatchearlychildhood.com   tking@hatchearlychildhood.com


                                        Copyright 2012 Hatch Inc.
                                        All Rights Reserved
Overview
I. Research on content-infused interactive
     whiteboards and preschoolers' literacy and
     math success.
II. Let’s Play!
III. Ways programs can use and measure the
     success of such educational technology as
     interactive whiteboards to support school
     readiness.
Academic Content
Why focus on literacy and mathematics?

• They are often considered to be the
  cornerstone of school success.
• Cognitive development can be seen as an
  extended set of skills and proficiencies which
  are multidimensional and include:
   – language/literacy
   – math reasoning
   – general knowledge
Kagan, S.L., Moore, E., & Bredekamp, S. 1995. Reconsidering Children’s Early Development and
Learning: Toward Common Views and Vocabulary. Washington, DC: National Education Goals
Panel.
How Children Learn Best
•   Combination of child directed and discovery
    (Piaget and Neo-Piagetians)
•   Teacher led/assisted instruction (Vygotsky)
•   Experiences that are:
     –   Meaningful
     –   Engaging
     –   Allow children to be successful
     –   Can result in self-efficacy (Bandura)
     B. Bowman et al. 2000. Eager to Learn.
         http://www.nap.edu/openbook.php?isbn=0309068363
     S. Landry. 2005. Effective Early Childhood Programs.
         http://www.childrenslearninginstitute.org/Library/Publications/documents/Effective-
         Early_Childhood-Programs.pdf
Provided it’s
         Developmentally Appropriate
• Based on theory
     – Child development
     – Learning
     – Teaching
• Based on good design principles
     – Child-friendly
     – Promotes progress
     – Supports teaching
• Based on meaningful and relevant outcomes
     – Knowledge
     – Skills
     – Self-efficacy

NAEYC. Technology in Early Childhood Programs Serving Children from Birth through Age 8.
   http://www.naeyc.org/files/naeyc/file/positions/Draft%20Technology%20in%20Early%20Chil
   dhood%20Programs%204-29-2011.pdf
Positive Outcomes
• Preschool age children are developmentally ready
  and capable of benefiting from instruction
  enhanced by technology.
• Educational technology is known to have a major,
  positive impact on children’s development in:
     – Social-emotional -Cognitive -Language
     – Literacy         -Writing   -Mathematics
Clements, D.H., & J. Sarama. 2003. Strip Mining for Gold: Research and Policy in Educational Technology:
    A Response to ‘Fool’s Gold’. AACE Journal 11 (1): 7-69.
 McCarrick, K., & L. Xiaoming. 2007. Buried Treasure: The Impact of Computer Use on Young Children’s
    Social, Cognitive, Language Development and Motivation. AACE Journal 15 (1): 73-95.
 Glaubke, C. 2007. The Effects of Interactive Media and Preschoolers’ Learning: A Review of the Research
    and Recommendations for the Future. Oakland, CA: Children Now.
    http://www.childrennow.org/uploads/documents/prek_interactive_learning_2007.pdf
Where are we going?
Interactive Whiteboards
Just What is an IWB?
• Virtually anything done on a computer can
  be done on an interactive white board.
• One advantage is the interaction involves
  fingers and pens so more kinesthetic.
• Drawing, marking and highlighting of any
  computer-based output is supported.
• Whole class can follow interactions.
• Lessons and student work can be saved and
  replayed/retrieved.
From a Pedagogical Perspective
Key features of interactive whiteboards which take
their role beyond being a mere display include their:
• Interactivity
• Size
• Accessibility for all learners
• Recordability


H. Smith et al. 2005. Interactive Whiteboards: Boon or Bandwagon? A Critical Review of the
    Literature. http://edtech2.boisestate.edu/spechtp/551/IWB_Boon_Bandwagon.pdf
Usability-Based Research
• Teachers and students like the technology.
• Students are more engaged and motivated.
• Use of whiteboards shifts instruction from
  presentation to interaction.
• More focus on content.


Hall, I. & Higgins, S. 2005. Primary school students' perceptions of interactive whiteboards. Journal of
     Computer Assisted Learning 21(2): 102-117.
D. Painter, E. Whiting, & B. Wolters. 2005. The Use of an Interactive Whiteboard in Promoting Interactive
     Teaching and Learning. http://gse.gmu.edu/assets/docs/tr/interactive-board_tr.pdf
What Teachers Say
• Northcote and colleagues conducted a project
  with teachers of primary school children (K-7):
     – To investigate different ways that IWBs are used in
       primary schools
     – To document teachers’ current practice with IWBs


Northcote, M., Mildenhall, P., Marshall, L., & Swan, P. (2010). Interactive Whiteboards: Interactive
    or Just Whiteboards? Australasian Journal of Educational Technology, 26(4), 494-510.
    http://www.ascilite.org.au/ajet/ajet26/northcote.pdf
Outcomes-Based Research
• We define outcomes here as literacy and
  mathematics achievement as measured by a
  formal instrument.
• Studies with preschool age children cannot
  generally be found.
• There are some with early elementary.
Early Elementary
• Navajo children in 3rd & 4th grades.
• Comparison group had lessons at desktop
  computers, experimental group got identical
  lesson with their teacher using a Smartboard.
• Greater gains from pre- to posttest for students
  whose teachers used a Smartboard.

Zittle, F.J. 2004. Enhancing Native American Mathematics Learning: The Use of Smartboard Generated
     Virtual Manipulatives for Conceptual Understanding. Proceedings of World Conference on
     Educational Multimedia, Hypermedia and Telecommunications. 5512-5515.
Swan et al. (2008) found these relationships:
Let’s Turn to Preschool
Engagement & Collaboration
• Wood (2002) describes a study on almost 30
  preschools in the UK that had IWBs.
• Found that children who wouldn’t normally choose to
  work on the computer were doing so with the IWB.
• Their teachers observed these young children could do
  the activities without needing the fine-motor skills
  required to operate a mouse.
• Teachers observed greater collaboration and sharing of
  the task than at a desktop computer.
Wood, C. 2002. Interactive Whiteboards - A luxury Too Far? Teaching ICT 1(2).
Today’s Study: Summary
• Interactive Whiteboard system.
• Focus on literacy and mathematics content.
• Preschool children made significant and practical
  gains.


McManis, L.D., S. Gunnewig, & M. McManis. 2010. The Effectiveness of the Hatch TeachSmart Learning
   System in Improving Literacy and Mathematics Outcomes for Preschoolers. Winston-Salem, NC:
   Hatch Early Learning. http://www.hatchearlychildhood.com/Resources/TeachSmart-EfficacyStudy-
   2011-Fire.pdf
Sample
•   8 classrooms.
•   3 schools.
•   3 separate school districts.
•   English language of instruction.
•   Low-income preschoolers.
•   English home language.
•   No additional intervention was happening.
Sample

• Both pre- and posttest data available for 86
  of the 88 children tested.
• Girls 52% of the sample; boys 48%.
• Average age of children at pretest was 4.6;
  at posttest 5.0.
Methods
•   Repeated measures (pretest – posttest) design.
•   11 children per classroom.
•   Randomly selected.
•   Tested on literacy and mathematics.
•   Individually by trained assessors.
•   Battery about 30 to 45 minutes.
•   Average of 6 months between pre-and posttest.
Exploratory
• To counter lack of control group:
  –Random selection
  –Low attrition
  –Norming group for non-equivalent
   control group
Implementation
•   Same training for teachers.
•   Used system prior to the study.
•   Focus on literacy and math first.
•   Study children one hour per week.
•   Any group size.
•   Optional scope and sequence.
•   Informal tracking sheet.
Measures
• Three screening tests used to determine
  children’s school readiness skills:
  – Test of Preschool Early Literacy (TOPEL)
  – Get Ready to Read! Early Literacy Screening Tool
    (GRTR)
  – C-PALLS+ Math Screener
System Design
• Features activities in the skill areas of
  literacy/language, mathematics, social studies
  and science.
• Aligned with national prekindergarten standards.
• Literacy and mathematics content is based on the
  findings of the National Early Literacy Panel and
  the National Research Council’s Committee on
  Early Childhood Mathematics.
Developing Early Literacy: Report of the National Early Literacy Panel. 2008.
    http://lincs.ed.gov/publications/pdf/NELPReport09.pdf
Mathematics Learning in Early Childhood Paths Toward Excellence and Equity. Committee on Early
    Childhood Mathematics. 2009. http://www.nap.edu/openbook.php?record_id=12519
System Design
• Activities for large groups, small groups, or individuals.
• Scaffolding in emerging, still developing, developed
  and for some activities, extension levels.
• Other features:
   –   Lesson plan
   –   Standards
   –   Research
   –   Activities for integration
   –   Tutorial
   –   Look and listen
   –   Progress monitoring
   –   Digital portfolios
Lots of Choices for Touch
Typical Placement
Navigation
Literacy Navigation
Literacy Activity
Literacy Activity:
Phonological Awareness
Literacy Activity: Story Telling
Math Navigation
Math Activity: Counting
Math Activity: Verbal Problems
Teacher Support Features
Findings
Test of Early Preschool Literacy
• A comparison of the mean pretest ELI to
  the posttest ELI shows a significant
  increase in early literacy skills (p < .001).
         TOPEL Early Literacy Index
   101
   100
   99
   98
   97
   96                           Median Early
   95                           Literacy Index
   94
   93
   92
   91
           Pretest   Posttest
Test of Early Preschool Literacy
• Median ELI at pretest was 94 (35th percentile
  of the normative sample).
                                Percentile Change
• At posttest was 100 (50 th
                             60
  percentile of the
                             50
  normative sample).
                             40
• Children began well        30
  below average and          20
  ended as average.          10

                             0
Get Ready to Read!
• Comparison between pretest and posttest
  mean scores showed a statistically significant
  increase (p < .001).       Get Ready to Read!
                            16


                            14


                            12                        GRTR Mean
                                                      Scores


                            10


                             8
                                 Pretest   Posttest
Get Ready to Read! Pretest
                                 Step 1


                     Step 5                              Step 1

                                            Step 2       Step 2

                                                         Step 3

                                                         Step 4
           Step 4
                                                         Step 5
                                          Step 3


Step 1 - 3 = Needs Additional Instruction; Step 4 or 5 = Ready to Read


  Get Ready to Read! Posttest
                                           Step 2
                              Step 1


                                          Step 3        Step 1

                                                        Step 2

                                                        Step 3
            Step 5
                                                        Step 4
                                              Step 4
                                                        Step 5


Step 1 - 3 = Needs Additional Instruction; Step 4 or 5 = Ready to Read
CPALLS+ Math
• Significant increase in the mean score on the
  C-PALLS+ Math Screener from pre- to posttest
  (p <. 001).
                                      C-PALLS+ Math


                       20


                                                    C-PALLS+ Math
                                                    Mean Scores
                       15


                       10
                            Pretest      Posttest
C-PALLS+ Math Pretest


                 School Ready for Math


                 Not School Ready for
                 Math


                                         C-PALLS+ Math Posttest


                                                           School Ready for Math


                                                           Not School Ready for
                                                           Math
Comparing to
    “Business as Usual” Classrooms
• For example, in a large reliability & validity
  study the GRTR! baseline (right before children
  began their preschool year) mean score was
  10.12 and 3 to 7 mo’s later was 9.85
• No intervention in this sample from Head Start
  41%, public pre-k 33% & private preschool 25%.
• At pretest, our mean score for the randomly
  selected children (n=86) was 11.20 and six
  months later at posttest was 15.18.
Authenticity and Generalizability
• In real classrooms with real teachers and real
  children.
• Not perfectly structured.
• Feasible amount of time with the educational
  technology.
• Training and useful tools for keeping track of
  activities and progress.
Conclusions
The importance of this finding is twofold:
• The literacy and math skills on which these
  at-risk preschool children increased are
  known to be predictors of success in school;
  both in the short-term, in kindergarten and
  first grade, and have an impact on their
  entire schooling experience.
Conclusions
• The study supports the hypothesis that
  educational technology, as both a vehicle for
  presenting information and as a vehicle for
  bringing strong content, can be used
  successfully with young children in early
  childhood education settings.
Limitations and Future Directions
• In this exploratory study, the children were
  randomly selected but no true control group.
• Findings are worthy but need to be replicated
  under a more stringent design.
• We have plans to conduct confirmatory
  research in a variety of geographic locations
  and early childhood settings.
Questions?
Using an IWB in Your Program
• Being very clear about your goals is probably the
  single most important factor in your success.
• Using the standards that are integral to your
  program will provide an excellent foundation.
• Writing IWB activities into your daily lesson plan
  will help you both think about them
  systematically and increase the chances that you
  will make sure the board and activities are
  actually used by the children.
Scaffolding
• Thinking about supporting children’s learning using
  scaffolding is another way to help ensure children’s success.
• Scaffolding can happen both around the use of the
  technology and within the content on the technology
  (Yelland & Masters, 2007).
• Be sure too to allow time for the children, and for
  yourself, to get to know how to use the board so that when
  the activities are presented the learning content is first and
  foremost.
Yelland, N. & J. Masters. 2007. Rethinking Scaffolding in the Information Age. Computers &
     Education, 48, 362-382.
     http://www.cblt.soton.ac.uk/multimedia/PDFsMM09/Rethinking%20scaffolding%20in%20the%20i
     nfo%20age.pdf
Customization
• You can also adapt, update, and customize
  activities very easily by using the footprint of
  an already existing activity.
• Extending activities is also very possible, for
  example, children can work on a group project
  over time by retrieving the activity and
  continuing its progress such as developing a
  story.
Teacher’s Role
• Recognizing how important the teacher is in the
  process and success really cannot be overstated
  (Nir-Gal & Klein, 2004).
• Probably the main pitfall to avoid is not giving
  yourself enough time to select or design
  activities.
• While this is time consuming, one of the benefits
  of the IWB is that once done you can pull these
  out very quickly.
Nir-Gal, O. and Klein, P.S. 2004. Computers for cognitive development in early childhood- the teachers'
    role in the computer learning environment. Information Technology in Childhood Education
    Annual, p. 97-119.
Professional Development
• Getting together with others at your site or in
  your organization to share the work of
  developing and/or selecting activities makes
  for a powerful learning community
  opportunity.
• Look too for online groups to share ideas and
  experiences.
Measuring the Effectiveness of Using
     an IWB in Your Program
• You will want to think about what your IWB
  system is and what you want included with
  regard to activities and learning experiences.
• Matching back to goals, learning outcomes or
  standards, etc. is essential.
• Collecting ‘data’ should be done systematically
  and regularly.
Measuring Success
• There are a variety of ways to do this and they
  are basically the same as when you use any
  kind of instructional approach and content
  with children.
• Observation, checklists, and screeners can also
  be used before, during, and while children use
  activities on the board.
‘Showing’ Success
• The IWB has one strength that is unique. If you
  have a board that can record children’s actions
  and language in real time, you can capture
  their performance at various times on the
  same or similar activities.
• This kind of record along with the more
  traditional can give you the benefit of “a
  picture is worth a thousand words”.
Considerations
• Some of these include if children do not get
  enough exposure to the technology. If teachers
  aren’t using the technology with the
  children, they don’t get adequate exposure. This
  can lead to a situation where positive results are
  less likely.
• If you change the technology mid-stream by
  adding or deleting lots of new software or apps
  this will throw off your results.
• If you do either of these, you would need to
  carefully attend to and measure this.
Considerations, Con’t
• If you have a lot of movement of children in and
  out of the classroom they won’t be getting an
  even and consistent experience and this can have
  a similar effect.
• Where the technology is housed must also be
  considered. If it is a computer lab children go to
  once a week with no teacher interaction or follow
  up, the gains will likely be less than if in the
  classroom and an integrated part of the
  curriculum.
Who the Learners Are
• If you have a mix of children who are non ELL
  and ELL, non special needs and special needs
  you can have a situation where the
  scores/outcomes are lowered on average.
• You may want to look at the progress of these
  kinds of learners separately.
Training for the Teachers
• Other issues are that if the teacher who was
  originally trained has left, you cannot assume
  the new teacher knows how to effectively use
  the technology.
• You may be that new teacher and if so asking
  for a training is very appropriate.
Evaluating Educational Technology


http://www.hatchearlychildhood.com//pages/evaluating-technology-for-early-learners
Toolkit


http://www.hatchearlychildhood.com//pages/evaluating-technology-for-early-learners
Closing Thoughts and Q & A

• Research on newer technologies
  for learning is in its infancy.
• We need ‘all hands on deck’.
Future Talks/Presentations
• EETC: Early Education Technology Conference
  March 14-16 in Salt Lake City
  –   Evaluating Educational Technology in Early Childhood
  –   Progress Monitoring in Educational Technology
  –   Interactive/Customizable Educational Technology
  –   Usability of a Literacy and Math Content-Infused
      Interactive Whiteboard with Preschoolers
• McCormick Center for Early Childhood Leadership
  Connections Conference May 10-12 in Chicago
  – Evaluating Educational Technology in Early Childhood
• International Society for Technology in Education
  (ISTE) Conference June 25 in San Diego
  – School Readiness: Outcomes and Approaches

FETC 2012: Interactive Whiteboard Content for Early Learners

  • 1.
    Interactive Whiteboard +Content = Preschool Literacy and Math Success FETC Conference January 2012 Lilla Dale McManis, PhD Tryna King dmcmanis@hatchearlychildhood.com tking@hatchearlychildhood.com Copyright 2012 Hatch Inc. All Rights Reserved
  • 2.
    Overview I. Research oncontent-infused interactive whiteboards and preschoolers' literacy and math success. II. Let’s Play! III. Ways programs can use and measure the success of such educational technology as interactive whiteboards to support school readiness.
  • 3.
    Academic Content Why focuson literacy and mathematics? • They are often considered to be the cornerstone of school success. • Cognitive development can be seen as an extended set of skills and proficiencies which are multidimensional and include: – language/literacy – math reasoning – general knowledge Kagan, S.L., Moore, E., & Bredekamp, S. 1995. Reconsidering Children’s Early Development and Learning: Toward Common Views and Vocabulary. Washington, DC: National Education Goals Panel.
  • 4.
    How Children LearnBest • Combination of child directed and discovery (Piaget and Neo-Piagetians) • Teacher led/assisted instruction (Vygotsky) • Experiences that are: – Meaningful – Engaging – Allow children to be successful – Can result in self-efficacy (Bandura) B. Bowman et al. 2000. Eager to Learn. http://www.nap.edu/openbook.php?isbn=0309068363 S. Landry. 2005. Effective Early Childhood Programs. http://www.childrenslearninginstitute.org/Library/Publications/documents/Effective- Early_Childhood-Programs.pdf
  • 5.
    Provided it’s Developmentally Appropriate • Based on theory – Child development – Learning – Teaching • Based on good design principles – Child-friendly – Promotes progress – Supports teaching • Based on meaningful and relevant outcomes – Knowledge – Skills – Self-efficacy NAEYC. Technology in Early Childhood Programs Serving Children from Birth through Age 8. http://www.naeyc.org/files/naeyc/file/positions/Draft%20Technology%20in%20Early%20Chil dhood%20Programs%204-29-2011.pdf
  • 6.
    Positive Outcomes • Preschoolage children are developmentally ready and capable of benefiting from instruction enhanced by technology. • Educational technology is known to have a major, positive impact on children’s development in: – Social-emotional -Cognitive -Language – Literacy -Writing -Mathematics Clements, D.H., & J. Sarama. 2003. Strip Mining for Gold: Research and Policy in Educational Technology: A Response to ‘Fool’s Gold’. AACE Journal 11 (1): 7-69. McCarrick, K., & L. Xiaoming. 2007. Buried Treasure: The Impact of Computer Use on Young Children’s Social, Cognitive, Language Development and Motivation. AACE Journal 15 (1): 73-95. Glaubke, C. 2007. The Effects of Interactive Media and Preschoolers’ Learning: A Review of the Research and Recommendations for the Future. Oakland, CA: Children Now. http://www.childrennow.org/uploads/documents/prek_interactive_learning_2007.pdf
  • 7.
  • 8.
  • 9.
    Just What isan IWB? • Virtually anything done on a computer can be done on an interactive white board. • One advantage is the interaction involves fingers and pens so more kinesthetic. • Drawing, marking and highlighting of any computer-based output is supported. • Whole class can follow interactions. • Lessons and student work can be saved and replayed/retrieved.
  • 10.
    From a PedagogicalPerspective Key features of interactive whiteboards which take their role beyond being a mere display include their: • Interactivity • Size • Accessibility for all learners • Recordability H. Smith et al. 2005. Interactive Whiteboards: Boon or Bandwagon? A Critical Review of the Literature. http://edtech2.boisestate.edu/spechtp/551/IWB_Boon_Bandwagon.pdf
  • 11.
    Usability-Based Research • Teachersand students like the technology. • Students are more engaged and motivated. • Use of whiteboards shifts instruction from presentation to interaction. • More focus on content. Hall, I. & Higgins, S. 2005. Primary school students' perceptions of interactive whiteboards. Journal of Computer Assisted Learning 21(2): 102-117. D. Painter, E. Whiting, & B. Wolters. 2005. The Use of an Interactive Whiteboard in Promoting Interactive Teaching and Learning. http://gse.gmu.edu/assets/docs/tr/interactive-board_tr.pdf
  • 12.
    What Teachers Say •Northcote and colleagues conducted a project with teachers of primary school children (K-7): – To investigate different ways that IWBs are used in primary schools – To document teachers’ current practice with IWBs Northcote, M., Mildenhall, P., Marshall, L., & Swan, P. (2010). Interactive Whiteboards: Interactive or Just Whiteboards? Australasian Journal of Educational Technology, 26(4), 494-510. http://www.ascilite.org.au/ajet/ajet26/northcote.pdf
  • 14.
    Outcomes-Based Research • Wedefine outcomes here as literacy and mathematics achievement as measured by a formal instrument. • Studies with preschool age children cannot generally be found. • There are some with early elementary.
  • 15.
    Early Elementary • Navajochildren in 3rd & 4th grades. • Comparison group had lessons at desktop computers, experimental group got identical lesson with their teacher using a Smartboard. • Greater gains from pre- to posttest for students whose teachers used a Smartboard. Zittle, F.J. 2004. Enhancing Native American Mathematics Learning: The Use of Smartboard Generated Virtual Manipulatives for Conceptual Understanding. Proceedings of World Conference on Educational Multimedia, Hypermedia and Telecommunications. 5512-5515.
  • 17.
    Swan et al.(2008) found these relationships:
  • 18.
    Let’s Turn toPreschool
  • 19.
    Engagement & Collaboration •Wood (2002) describes a study on almost 30 preschools in the UK that had IWBs. • Found that children who wouldn’t normally choose to work on the computer were doing so with the IWB. • Their teachers observed these young children could do the activities without needing the fine-motor skills required to operate a mouse. • Teachers observed greater collaboration and sharing of the task than at a desktop computer. Wood, C. 2002. Interactive Whiteboards - A luxury Too Far? Teaching ICT 1(2).
  • 20.
    Today’s Study: Summary •Interactive Whiteboard system. • Focus on literacy and mathematics content. • Preschool children made significant and practical gains. McManis, L.D., S. Gunnewig, & M. McManis. 2010. The Effectiveness of the Hatch TeachSmart Learning System in Improving Literacy and Mathematics Outcomes for Preschoolers. Winston-Salem, NC: Hatch Early Learning. http://www.hatchearlychildhood.com/Resources/TeachSmart-EfficacyStudy- 2011-Fire.pdf
  • 21.
    Sample • 8 classrooms. • 3 schools. • 3 separate school districts. • English language of instruction. • Low-income preschoolers. • English home language. • No additional intervention was happening.
  • 22.
    Sample • Both pre-and posttest data available for 86 of the 88 children tested. • Girls 52% of the sample; boys 48%. • Average age of children at pretest was 4.6; at posttest 5.0.
  • 23.
    Methods • Repeated measures (pretest – posttest) design. • 11 children per classroom. • Randomly selected. • Tested on literacy and mathematics. • Individually by trained assessors. • Battery about 30 to 45 minutes. • Average of 6 months between pre-and posttest.
  • 24.
    Exploratory • To counterlack of control group: –Random selection –Low attrition –Norming group for non-equivalent control group
  • 25.
    Implementation • Same training for teachers. • Used system prior to the study. • Focus on literacy and math first. • Study children one hour per week. • Any group size. • Optional scope and sequence. • Informal tracking sheet.
  • 26.
    Measures • Three screeningtests used to determine children’s school readiness skills: – Test of Preschool Early Literacy (TOPEL) – Get Ready to Read! Early Literacy Screening Tool (GRTR) – C-PALLS+ Math Screener
  • 27.
    System Design • Featuresactivities in the skill areas of literacy/language, mathematics, social studies and science. • Aligned with national prekindergarten standards. • Literacy and mathematics content is based on the findings of the National Early Literacy Panel and the National Research Council’s Committee on Early Childhood Mathematics. Developing Early Literacy: Report of the National Early Literacy Panel. 2008. http://lincs.ed.gov/publications/pdf/NELPReport09.pdf Mathematics Learning in Early Childhood Paths Toward Excellence and Equity. Committee on Early Childhood Mathematics. 2009. http://www.nap.edu/openbook.php?record_id=12519
  • 28.
    System Design • Activitiesfor large groups, small groups, or individuals. • Scaffolding in emerging, still developing, developed and for some activities, extension levels. • Other features: – Lesson plan – Standards – Research – Activities for integration – Tutorial – Look and listen – Progress monitoring – Digital portfolios
  • 29.
    Lots of Choicesfor Touch
  • 30.
  • 31.
  • 32.
  • 33.
  • 34.
  • 35.
  • 36.
  • 37.
  • 38.
  • 39.
  • 40.
  • 41.
    Test of EarlyPreschool Literacy • A comparison of the mean pretest ELI to the posttest ELI shows a significant increase in early literacy skills (p < .001). TOPEL Early Literacy Index 101 100 99 98 97 96 Median Early 95 Literacy Index 94 93 92 91 Pretest Posttest
  • 42.
    Test of EarlyPreschool Literacy • Median ELI at pretest was 94 (35th percentile of the normative sample). Percentile Change • At posttest was 100 (50 th 60 percentile of the 50 normative sample). 40 • Children began well 30 below average and 20 ended as average. 10 0
  • 43.
    Get Ready toRead! • Comparison between pretest and posttest mean scores showed a statistically significant increase (p < .001). Get Ready to Read! 16 14 12 GRTR Mean Scores 10 8 Pretest Posttest
  • 44.
    Get Ready toRead! Pretest Step 1 Step 5 Step 1 Step 2 Step 2 Step 3 Step 4 Step 4 Step 5 Step 3 Step 1 - 3 = Needs Additional Instruction; Step 4 or 5 = Ready to Read Get Ready to Read! Posttest Step 2 Step 1 Step 3 Step 1 Step 2 Step 3 Step 5 Step 4 Step 4 Step 5 Step 1 - 3 = Needs Additional Instruction; Step 4 or 5 = Ready to Read
  • 45.
    CPALLS+ Math • Significantincrease in the mean score on the C-PALLS+ Math Screener from pre- to posttest (p <. 001). C-PALLS+ Math 20 C-PALLS+ Math Mean Scores 15 10 Pretest Posttest
  • 46.
    C-PALLS+ Math Pretest School Ready for Math Not School Ready for Math C-PALLS+ Math Posttest School Ready for Math Not School Ready for Math
  • 47.
    Comparing to “Business as Usual” Classrooms • For example, in a large reliability & validity study the GRTR! baseline (right before children began their preschool year) mean score was 10.12 and 3 to 7 mo’s later was 9.85 • No intervention in this sample from Head Start 41%, public pre-k 33% & private preschool 25%. • At pretest, our mean score for the randomly selected children (n=86) was 11.20 and six months later at posttest was 15.18.
  • 48.
    Authenticity and Generalizability •In real classrooms with real teachers and real children. • Not perfectly structured. • Feasible amount of time with the educational technology. • Training and useful tools for keeping track of activities and progress.
  • 49.
    Conclusions The importance ofthis finding is twofold: • The literacy and math skills on which these at-risk preschool children increased are known to be predictors of success in school; both in the short-term, in kindergarten and first grade, and have an impact on their entire schooling experience.
  • 50.
    Conclusions • The studysupports the hypothesis that educational technology, as both a vehicle for presenting information and as a vehicle for bringing strong content, can be used successfully with young children in early childhood education settings.
  • 51.
    Limitations and FutureDirections • In this exploratory study, the children were randomly selected but no true control group. • Findings are worthy but need to be replicated under a more stringent design. • We have plans to conduct confirmatory research in a variety of geographic locations and early childhood settings.
  • 52.
  • 54.
    Using an IWBin Your Program • Being very clear about your goals is probably the single most important factor in your success. • Using the standards that are integral to your program will provide an excellent foundation. • Writing IWB activities into your daily lesson plan will help you both think about them systematically and increase the chances that you will make sure the board and activities are actually used by the children.
  • 55.
    Scaffolding • Thinking aboutsupporting children’s learning using scaffolding is another way to help ensure children’s success. • Scaffolding can happen both around the use of the technology and within the content on the technology (Yelland & Masters, 2007). • Be sure too to allow time for the children, and for yourself, to get to know how to use the board so that when the activities are presented the learning content is first and foremost. Yelland, N. & J. Masters. 2007. Rethinking Scaffolding in the Information Age. Computers & Education, 48, 362-382. http://www.cblt.soton.ac.uk/multimedia/PDFsMM09/Rethinking%20scaffolding%20in%20the%20i nfo%20age.pdf
  • 56.
    Customization • You canalso adapt, update, and customize activities very easily by using the footprint of an already existing activity. • Extending activities is also very possible, for example, children can work on a group project over time by retrieving the activity and continuing its progress such as developing a story.
  • 57.
    Teacher’s Role • Recognizinghow important the teacher is in the process and success really cannot be overstated (Nir-Gal & Klein, 2004). • Probably the main pitfall to avoid is not giving yourself enough time to select or design activities. • While this is time consuming, one of the benefits of the IWB is that once done you can pull these out very quickly. Nir-Gal, O. and Klein, P.S. 2004. Computers for cognitive development in early childhood- the teachers' role in the computer learning environment. Information Technology in Childhood Education Annual, p. 97-119.
  • 58.
    Professional Development • Gettingtogether with others at your site or in your organization to share the work of developing and/or selecting activities makes for a powerful learning community opportunity. • Look too for online groups to share ideas and experiences.
  • 59.
    Measuring the Effectivenessof Using an IWB in Your Program • You will want to think about what your IWB system is and what you want included with regard to activities and learning experiences. • Matching back to goals, learning outcomes or standards, etc. is essential. • Collecting ‘data’ should be done systematically and regularly.
  • 60.
    Measuring Success • Thereare a variety of ways to do this and they are basically the same as when you use any kind of instructional approach and content with children. • Observation, checklists, and screeners can also be used before, during, and while children use activities on the board.
  • 61.
    ‘Showing’ Success • TheIWB has one strength that is unique. If you have a board that can record children’s actions and language in real time, you can capture their performance at various times on the same or similar activities. • This kind of record along with the more traditional can give you the benefit of “a picture is worth a thousand words”.
  • 62.
    Considerations • Some ofthese include if children do not get enough exposure to the technology. If teachers aren’t using the technology with the children, they don’t get adequate exposure. This can lead to a situation where positive results are less likely. • If you change the technology mid-stream by adding or deleting lots of new software or apps this will throw off your results. • If you do either of these, you would need to carefully attend to and measure this.
  • 63.
    Considerations, Con’t • Ifyou have a lot of movement of children in and out of the classroom they won’t be getting an even and consistent experience and this can have a similar effect. • Where the technology is housed must also be considered. If it is a computer lab children go to once a week with no teacher interaction or follow up, the gains will likely be less than if in the classroom and an integrated part of the curriculum.
  • 64.
    Who the LearnersAre • If you have a mix of children who are non ELL and ELL, non special needs and special needs you can have a situation where the scores/outcomes are lowered on average. • You may want to look at the progress of these kinds of learners separately.
  • 65.
    Training for theTeachers • Other issues are that if the teacher who was originally trained has left, you cannot assume the new teacher knows how to effectively use the technology. • You may be that new teacher and if so asking for a training is very appropriate.
  • 66.
  • 67.
  • 68.
    Closing Thoughts andQ & A • Research on newer technologies for learning is in its infancy. • We need ‘all hands on deck’.
  • 69.
    Future Talks/Presentations • EETC:Early Education Technology Conference March 14-16 in Salt Lake City – Evaluating Educational Technology in Early Childhood – Progress Monitoring in Educational Technology – Interactive/Customizable Educational Technology – Usability of a Literacy and Math Content-Infused Interactive Whiteboard with Preschoolers • McCormick Center for Early Childhood Leadership Connections Conference May 10-12 in Chicago – Evaluating Educational Technology in Early Childhood • International Society for Technology in Education (ISTE) Conference June 25 in San Diego – School Readiness: Outcomes and Approaches