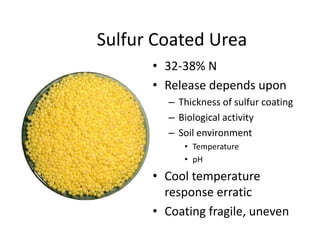
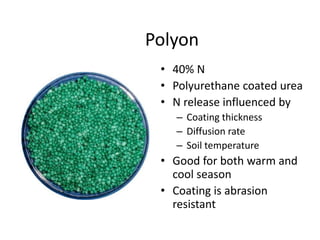
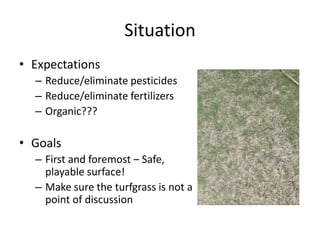
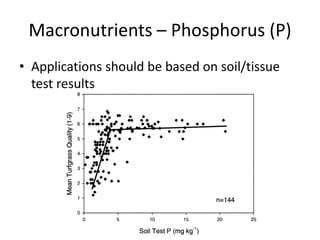
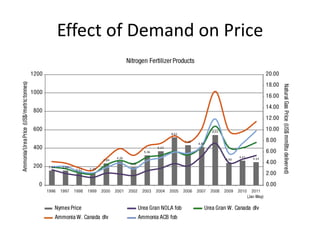
Jason Kruse, Ph.D.
   University of Florida
       jkk@ufl.edu
Situation
• Prices for many products have risen steadily
  – Revenue increases have not kept pace
• Reduced budgets have resulted in staffing cuts
• Increasing demands placed on existing
  facilities
  – Events
  – People
• Increasing expectations regarding aesthetics
  and play
Situation
• Expectations
  – Reduce/eliminate pesticides
  – Reduce/eliminate fertilizers
  – Organic???

• Goals
  – First and foremost – Safe,
    playable surface!
  – Make sure the turfgrass is not a
    point of discussion
Overview
• Role of nutrients in plant growth

• Fertilizer carriers - Nitrogen

• Cultural management practices

• Fertilizer price trends, predictions, purchasing
  recommendations
Role of Nutrients in Plants
Plant Nutrition
• An actively growing turfgrass plant is 75 - 85% water.
   – The remaining 15 - 25% of the plant’s weight is dry matter.
• Sixteen (16) elements are essential because a plant
  cannot successfully complete its life cycle without
  them.
• A major portion of the plant dry matter content
  consists of three (3) elements:
   – Carbon
   – Hydrogen
   – Oxygen


                                                                   6
Plant Nutrition
• Plants obtain carbon and oxygen from the
  atmosphere.
  – Carbon dioxide (CO2), a gas, enters the leaves
    through the stomata.
  – Water (H2O) taken in by the roots supplies
    hydrogen and oxygen.


                                                     7
Essential Elements
• Macronutrients      • Micronutrients
  – Nitrogen (N)        – Iron (Fe)
  – Phosphorus (P)      – Manganese (Mn)
  – Potassium (K)       – Boron (B)
                        – Copper (Cu)
• Secondary             – Zinc (Zn)
   – Calcium (Ca)       – Molybdenum (Mo)
   – Magnesium (Mg)     – Chlorine (Cl)
   – Sulfur (S)


                                            8
Macronutrients – Nitrogen (N)
• Present in the greatest quantities: 2 – 5% in
  dry leaf tissue.
• Sufficiency Ranges:
  – Creeping Bentgrass = 4.5 – 6.0%
  – Kentucky Bluegrass= 2.6 – 3.5%
  – Ryegrass = 4.5 – 5.5%
  – St. Augustinegrass = 2.0 – 3.0%
  – Zoysiagrass = 2.0 – 3.0%
  – Bermudagrass = 2.5 – 3.5%

                                                  9
Macronutrients – Nitrogen (N)
• Major impact on a number of factors:
  – Effects on plant growth and metabolism,
    influencing grass response to a number of
    environmental stress conditions;
  – Potential environmental implications;
  – Must be routinely applied for a healthy, stress-
    tolerant turf;
  – Accounts for the highest cost of a turfgrass
    fertilization program.

                                                       10
11
Macronutrients – Nitrogen (N)
• N Compounds in Plants - taken up as NO3-
  (nitrate) and NH4+(ammonium).
  – Amino acids – building blocks for proteins.
  – Proteins
  – Chlorophyll – photosynthesis
  – Hormones - auxins, cytokinins, and ethylene.
  – Nucleic Acids - DNA, RNA


                                                   12
Nitrogen Deficiency
• The most common nutritional deficiency
• Growth slows dramatically
• Oldest leaves first become chlorotic (lose their
  dark green color, become yellowish), while
  newest leaves stay green.
  – Nitrogen is transferred from the oldest,
    expendable leaves to the newest, most valuable
    leaves

                                                     13
14
15
Macronutrients – Phosphorus (P)
• Present in the soil solution in very low
  concentrations and uptake is primarily as
  H2PO4- (pH<7.0), HPO42- (pH>7.0), or certain
  soluble organic phosphates.
• Phosphorus content of turfgrass shoot tissues
  may range from 0.10 to 1.00% by dry weight.
  – Sufficiency range is 0.15 – 0.5%.


                                                  16
Macronutrients – Phosphorus (P)
• Uses in the plant:
  – Component of the energy molecules ATP and ADP.
     • These compounds serve to store and transfer available
       energy within the plant.
  – Structural constituent
     •   Phospholipids
     •   Phosphoproteins
     •   Nucleic acids
     •   Sugar phosphates
     •   Nucleotides
     •   Coenzymes


                                                               17
Macronutrients – Phosphorus (P)
• Visual Symptoms of deficiency
  – Initially show up as reduced shoot growth and a
    dark green color.
     • As P deficiency continues, lower leaves may turn
       reddish at the leaf tips and then progress down the
       blade.
     • Stunted growth - caused by limited P for energy
       transformations.
• Element of impairment

                                         Photo credit: Rosa Say
                                                                  18
Macronutrients – Phosphorus (P)
• Applications should be based on soil/tissue
  test results
Macronutrients – Potassium (K)
• Taken up and stored as the ionic (K+) form.
• Shoot tissue concentration of 1.0 to 3.0% by
  weight.
• Used in the plant:
  – Enzymes activator
  – Most important solute in the vacuole
     • Osmoregulation = water regulation in plants
  – Used in carbohydrate, amino acid, and protein
    synthesis

                                                     20
Macronutrients – Potassium (K)
• Visual symptoms of deficiency
  – Interveinal yellowing of older leaves (lower),
    followed by dieback of leaf tip, scorching or firing
    of the margins, and total yellowing of the leaf
    blade including the veins.
  – May appear weak or spindly.
  – Under high evaporative demand, wilting and leaf
    firing may be accelerated as well as wear injury in
    high traffic areas.

                                                           21
Macronutrients – Potassium (K)
• Deficiencies result in:
  – Increased respiration and transpiration
  – Reduced environmental stress tolerance
  – Increased disease incidence
  – General reductions in growth


                                              22
Bottom Line

  We must maximize our benefit of
management practices to ensure a safe,
 enjoyable facility for our customers
Nitrogen Fate
• What are some of the potential fates for N
  applied to a turf surface?
  – Taken up by grass
  – Microorganisms
  – Denitrification
  – Volatilization
  – Leaching
Sources of Nitrogen
•   Fertilizer
•   Returned Clippings
•   Organic Matter
•   Lightning (precipitation)
Consider the Whole System!
• What can you change in your current system
  to further reduce N need?
  – Mowing
  – Irrigation
  – Fertilization
  – Equipment repair/replacement
  – Inventory management
  – Employees
Mowing/Maintenance
• Increase mowing height
  – Increase root depth and photosynthetic capacity
• Reduce highly maintained areas
  – Reducing fairway width/length to emphasize
    landing areas
  – Reduce/Eliminate flower beds/ornamentals
  – Fairways vs roughs
Seasonal Growth


                  28
Irrigation
• Conduct irrigation audit
• Ensure application rate/amount does
  not exceed infiltration
• Match irrigation to weekly ET rates,
  accounting for rainfall received
   – On-site weather station
   – http://fawn.ifas.ufl.edu
• Irrigation + rainfall should not wet
  profile below rootzone, only refill it!
Soil Compaction
• Compacted soils
  – Reduced pore space = reduced root growth =
    reduced N uptake
  – Decreased infiltration increases risk of runoff
• Monitor compaction, vary method/depth of
  aerfication
Consider Your Fertilizer Material
Quickly Available N

• Very soluble
• Rapid response
• Short response
• Cheap
• Minimal temperature
  dependency
• High leaching potential
• Tendency to burn
Quickly Available N
• Ammonium nitrate            33-0-0
• Ammonium sulfate            21-0-0
• Ammonium phosphates
  – mono-ammonium phosphate   11-48-0
  – di-ammonium phosphate     20-50-0
• Potassium nitrate           13-0-44
• Urea (organic?)             46-0-0
Slow Release Nitrogen Sources
• Slow initial response
• Longer response than quick release
• Some, but not all, are dependent on
  temperature for N release
• Low burn potential
• Moderately expensive to expensive
• Less N leaching
Why Use Slow Release Fertilizers?
•   More uniform growth response
•   No growth surge
•   Longer growth response
•   Less chance of burn
•   Less leaching of nitrate
•   Labor saving
Uncoated Slow Release Fertilizers
•   Urea formaldehyde (UF)
•   Methylene urea (MU)
•   Isobutylidene diurea (IBDU)
•   Natural organics
Ureaform and Methylene Urea
• Very similar materials chemically
• Mostly granular, some liquids
• about 40% N, 70% WIN (28% N for liquids, all
  soluble)
• Formed by reacting urea and formaldehyde =
  chains of alternating C and N
• Main difference is chain length, and as a
  result, mineralization rate
Products
•   Formolene                            30-0-2
•   FLUF                                 18-0-0
•   Nitro 26 CRN                         26-0-0
•   Nitroform (Powder Blue, Blue Chip)   38-0-0
•   CoRoN                                28-0-0
    – (25% of total N is urea)
Different Chain Lengths
Methylene Urea
N-C-N
N-C-C-C
N-C-C-C-C
N-C-C-C-C-C-C-C
Urea Formaldehyde
N-C-N
N-C-C-C-C-C-C-C
N-C-C-C-C-C-C-C-C-C
N-C-C-C-C-C-C-C-C-C-C-C-C
N-C-C-C-C-C-C-C-C-C-C-C-C-C-C-C
Ureaform and Methylene Urea
• Designed to release N for 8-12 weeks
• Contains unreacted urea, fast greening
• Requires soil microbial activity
  – temperature sensitive, soil at 78o F is four times as
    active as soil at 42o F
  – moisture sensitive
• Seasonal response
Nitroform
  •   Urea formaldehyde
  •   Insoluble organic
  •   38% N; 65-71% WIN
  •   Biological N release
      – Rate influenced by soil
        temperature
Nutralene
  • Methylene urea
  • 40% N; 38% WIN
  • Biological N release
  • More rapidly available
    than UF
  • Not as adversely
    influenced by cool
    temperatures
IBDU

• Urea is reacted with isobutyraldehyde
• Only a single chemical product is formed, not a
  bunch of different molecules. 31% N, 90% WIN
• Different sized granules available
• N release depends on solubility and hydrolysis
  (IBDU molecule reacts with water and breaks
  apart), releasing urea.
• No free urea in IBDU, may need to add
IBDU
• Urea breaks down quickly to NH4
• IBDU is relatively insoluble, so only small
  amounts are available at any one time
• Release sensitive to soil moisture, less on
  dependant on temperature
• Release also depends on granule size and
  contact with soil. Smaller granules release
  N faster than larger granules
IBDU
• 31% N -90% WIN
• N released by hydrolysis
• Relatively unaffected by
   – Temperature
   – pH
• Particle size important
• Excellent cool season
  response
Liquid Slow Release Fertilizers

• Chemistry similar to UF, MU
• Micro-suspension of MU (FLUF)
• CoRoN, N-Sure; 28%N, 7% as urea and 21%
  as short chain MU or small ring structure.
• Get quick and slow release
• Foliar application?
• Is slow release slow enough?
Liquid Slow Release Fertilizers

•   Easily handled, applied
•   Can be formulated with P and K
•   Some have short storage life
•   Require specialized delivery system
•   Volume of liquid used in application is not
    enough to move the material down into the
    root system - must irrigate in
CoRon
 • 28% N solution
 • Polymethylene ureas
   and amine modified
   polymethylene ureas
 • N release dependent
   upon microbial action
N-Sure
 • 30% N
 • Ring structured
   Triazones may contain
   methylene diurea
 • N release by microbial
   action
 • Response very similar
   to CoRon
Coated Slow Release Fertilizers

• SCU, sulfur coated urea

• Polymer coated urea

• Poly Coated Sulfur Coated Urea
Sulfur Coated Urea

• Molten sulfur (S) sprayed on urea in rotating drum,
  coated in wax sealant
• Experimentally produced in 1950’s, commercially in
  1972
• N release determined by:
   –   Coating thickness
   –   Microbial degradation
   –   Temperature
   –   Moisture
   –   Coating failure (cracks, abrasion)
Sulfur Coated Urea
      • 32-38% N
      • Release depends upon
        – Thickness of sulfur coating
        – Biological activity
        – Soil environment
           • Temperature
           • pH

      • Cool temperature
        response erratic
      • Coating fragile, uneven
Polymer Coated Urea
• Solid urea or other nutrient core, coated with
  various polymers (“plastics”)
• Coatings are tough, resist damage, thin
• Coating chemistry affects membrane
  properties, release rate
• Release is due to controlled diffusion, which is
  fairly constant over time
• Release depends on coat thickness, chemistry,
  temperature, moisture
Polyon
 • 40% N
 • Polyurethane coated urea
 • N release influenced by
   – Coating thickness
   – Diffusion rate
   – Soil temperature
 • Good for both warm and
   cool season
 • Coating is abrasion
   resistant
Poly-S
 • Coated with sulfur and a
   polymer
   – Cheaper than regular
     polymer coated fertilizers
 • Release dependent on
   – Temperature
   – Soil moisture
Fertilizer Programs
• Minimum of 30-50% slowly available N is
  appropriate
   – Choose CRN source based on environmental
     conditions, budget, level of traffic
• 4-10 lbs N/M annually, depending on level of
  use/traffic
   – Do not apply more than 1 lb soluble N/M at one time
   – Carefully consider use of coated products in high traffic
     areas due to potential damage to coating
• Late fall application of IBDU has been shown to
  improve spring color
Consider site-specific
   management
PERCENT N RELEASED OVER TIME FOR SELECTED
             CRN MATERIALS
    100

     80

     60

     40

     20

     0
          7 14   28   42   56    84     112       140       180


                  NITROFORM     NUTRALENE     MILORGANITE
                  POLYON        SCU           AN
Weeks of “Greening”

Nitrogen Source Application Rate Weeks Greening

      Urea             1               4

Ammonium Sulfate       1               4

POLYON Regular       1.25             12

   Nutralene          1.5             12

    Nitroform          2              16

      IBDU            1.5             12
Relative Product Price

Nitrogen Source    Analysis     $/ton   $/lb N

      Urea          46-0-0      700      0.76

Ammonium Sulfate   21 - 0 - 0   300      0.71

POLYON Regular     43 - 0 - 0   1,500    1.74

   Nutralene       40 - 0 - 0   1,300    1.63

    Nitroform      38 - 0 - 0   1,500    1.97

      IBDU         31 - 0 - 0   1,500    2.42
Smart Purchases
Why is Nitrogen Fertilizer so High
               Priced?
• High prices have coincided with spikes in price
  of gas
• Fertilizer shipping costs are important
  – U.S. imports more than 8 million metric tons of
    Nitrogen fertilizer annually
• Natural gas is used to manufacture N-
  fertilizers
Why is Nitrogen Fertilizer so High
             Priced?


   Nitrogen (atm)              Anhydrous
   + Natural gas               Ammonia


                    Heat
N2 + CH4 + H2O                 2NH3 + CO

                    Pressure
Why is Nitrogen Fertilizer so High
             Priced?
                   Anhydrous
                   Ammonia
       +                  +
    Sulfuric            Nitric         + CO2
     Acid               acid


Ammonium Sulfate    Ammonium Nitrate   Urea
Price Volatility
• Price for fertilizers spiked in 2008/2009
  – Spike in natural gas prices
                          U.S. Natural Gas Wellhead Price
  12


  10


   8


   6   Data 1: U.S. Natural Gas Wellhead Price
       (Dollars per Thousand Cubic Feet)
       N9190US3 U.S. Natural Gas Wellhead…
   4


   2


   0
            Mar-…


            Aug-…


            Mar-…


            Aug-…


            Mar-…


            Aug-…
            Nov-…


            Nov-…


            Nov-…
            Feb-…


            Sep-…


            Feb-…


            Sep-…


            Feb-…


            May-…


            Sep-…
            May-…


            May-…
            Dec-…


            Dec-…


            Dec-…
       Oct-1982


       Oct-1995


       Oct-2008
       Jan-1973


       Apr-1976


       Jan-1986


       Jan-1999
        Jul-1979


        Jul-1992


        Jul-2005
       Apr-1989


       Apr-2002
       Jun-1978


       Jun-1991


       Jun-2004
Price Volatility
• While prices have stabilized, futures prices
  trend upwards through 2016
• Price of natural gas is only a small piece of the
  picture…
Fertilizer Consumption
Millions of metric tons consumed annually
  45,000


  40,000


  35,000


  30,000


  25,000
                                                                          US
  20,000                                                                  China


  15,000


  10,000


   5,000


      0
           2002   2003   2004   2005   2006   2007   2008   2009   2010
Effect of Demand on Price
Volatile Prices
Volatile Prices
• Fertilizers
   – As much as 85% of variable expenses
   – Prices increased dramatically
         • Nitrogen and Phosphorus
                – 300-400% increase from 2002-2008
   – Within year price changes over past 3-4 seasons:
         • +/- $100/ton for anhydrous ammonia seasonally
         • +/- $500/ton for phosphorus seasonally


  Source: Kenkel, P. and T. Kim. 2009. Optimal cash purchase strategies to reduce fertilizer price risk. Southern
  Agricultural Economics Association Annual Meeting, Atlanta, Georgia, January 31 – February 3, 2009.
Volatile Prices
• With so much within year variability, time of
  purchase is critical!
  – Price is driven by world market
  – Suppliers stockpile fertilizer for peak demand
  – Dealers attempt to shift risk through advance
    purchase programs
  – It is possible to save as much as 16% if purchased
    at correct time of the year
Volatile Prices
• Best time of year to purchase
  – Urea: 1st or 2nd week in July
  – Phosphorus: 1st week in November
• Highest prices
  – Urea: March/April
  – Phosphorus: March
Summary
• Proper nutrient management is essential
• Careful management of cultural practices can
  have significant impact on effectiveness of N
  applications
• Important to understand differences in fertilizer
  materials/use
• Slow release fertilizers have potential to save
  time/labor and wear on equipment
• Budget savings can be realized through scheduled
  purchases of fertilizer materials
Questions?


Jason Kruse, Ph.D.
     PO Box 110670
   Gainesville, FL 32611
    352-273-4569
     jkk@ufl.edu

Fertilize to Save Money

  • 1.
    Jason Kruse, Ph.D. University of Florida jkk@ufl.edu
  • 2.
    Situation • Prices formany products have risen steadily – Revenue increases have not kept pace • Reduced budgets have resulted in staffing cuts • Increasing demands placed on existing facilities – Events – People • Increasing expectations regarding aesthetics and play
  • 3.
    Situation • Expectations – Reduce/eliminate pesticides – Reduce/eliminate fertilizers – Organic??? • Goals – First and foremost – Safe, playable surface! – Make sure the turfgrass is not a point of discussion
  • 4.
    Overview • Role ofnutrients in plant growth • Fertilizer carriers - Nitrogen • Cultural management practices • Fertilizer price trends, predictions, purchasing recommendations
  • 5.
  • 6.
    Plant Nutrition • Anactively growing turfgrass plant is 75 - 85% water. – The remaining 15 - 25% of the plant’s weight is dry matter. • Sixteen (16) elements are essential because a plant cannot successfully complete its life cycle without them. • A major portion of the plant dry matter content consists of three (3) elements: – Carbon – Hydrogen – Oxygen 6
  • 7.
    Plant Nutrition • Plantsobtain carbon and oxygen from the atmosphere. – Carbon dioxide (CO2), a gas, enters the leaves through the stomata. – Water (H2O) taken in by the roots supplies hydrogen and oxygen. 7
  • 8.
    Essential Elements • Macronutrients • Micronutrients – Nitrogen (N) – Iron (Fe) – Phosphorus (P) – Manganese (Mn) – Potassium (K) – Boron (B) – Copper (Cu) • Secondary – Zinc (Zn) – Calcium (Ca) – Molybdenum (Mo) – Magnesium (Mg) – Chlorine (Cl) – Sulfur (S) 8
  • 9.
    Macronutrients – Nitrogen(N) • Present in the greatest quantities: 2 – 5% in dry leaf tissue. • Sufficiency Ranges: – Creeping Bentgrass = 4.5 – 6.0% – Kentucky Bluegrass= 2.6 – 3.5% – Ryegrass = 4.5 – 5.5% – St. Augustinegrass = 2.0 – 3.0% – Zoysiagrass = 2.0 – 3.0% – Bermudagrass = 2.5 – 3.5% 9
  • 10.
    Macronutrients – Nitrogen(N) • Major impact on a number of factors: – Effects on plant growth and metabolism, influencing grass response to a number of environmental stress conditions; – Potential environmental implications; – Must be routinely applied for a healthy, stress- tolerant turf; – Accounts for the highest cost of a turfgrass fertilization program. 10
  • 11.
  • 12.
    Macronutrients – Nitrogen(N) • N Compounds in Plants - taken up as NO3- (nitrate) and NH4+(ammonium). – Amino acids – building blocks for proteins. – Proteins – Chlorophyll – photosynthesis – Hormones - auxins, cytokinins, and ethylene. – Nucleic Acids - DNA, RNA 12
  • 13.
    Nitrogen Deficiency • Themost common nutritional deficiency • Growth slows dramatically • Oldest leaves first become chlorotic (lose their dark green color, become yellowish), while newest leaves stay green. – Nitrogen is transferred from the oldest, expendable leaves to the newest, most valuable leaves 13
  • 14.
  • 15.
  • 16.
    Macronutrients – Phosphorus(P) • Present in the soil solution in very low concentrations and uptake is primarily as H2PO4- (pH<7.0), HPO42- (pH>7.0), or certain soluble organic phosphates. • Phosphorus content of turfgrass shoot tissues may range from 0.10 to 1.00% by dry weight. – Sufficiency range is 0.15 – 0.5%. 16
  • 17.
    Macronutrients – Phosphorus(P) • Uses in the plant: – Component of the energy molecules ATP and ADP. • These compounds serve to store and transfer available energy within the plant. – Structural constituent • Phospholipids • Phosphoproteins • Nucleic acids • Sugar phosphates • Nucleotides • Coenzymes 17
  • 18.
    Macronutrients – Phosphorus(P) • Visual Symptoms of deficiency – Initially show up as reduced shoot growth and a dark green color. • As P deficiency continues, lower leaves may turn reddish at the leaf tips and then progress down the blade. • Stunted growth - caused by limited P for energy transformations. • Element of impairment Photo credit: Rosa Say 18
  • 19.
    Macronutrients – Phosphorus(P) • Applications should be based on soil/tissue test results
  • 20.
    Macronutrients – Potassium(K) • Taken up and stored as the ionic (K+) form. • Shoot tissue concentration of 1.0 to 3.0% by weight. • Used in the plant: – Enzymes activator – Most important solute in the vacuole • Osmoregulation = water regulation in plants – Used in carbohydrate, amino acid, and protein synthesis 20
  • 21.
    Macronutrients – Potassium(K) • Visual symptoms of deficiency – Interveinal yellowing of older leaves (lower), followed by dieback of leaf tip, scorching or firing of the margins, and total yellowing of the leaf blade including the veins. – May appear weak or spindly. – Under high evaporative demand, wilting and leaf firing may be accelerated as well as wear injury in high traffic areas. 21
  • 22.
    Macronutrients – Potassium(K) • Deficiencies result in: – Increased respiration and transpiration – Reduced environmental stress tolerance – Increased disease incidence – General reductions in growth 22
  • 23.
    Bottom Line We must maximize our benefit of management practices to ensure a safe, enjoyable facility for our customers
  • 24.
    Nitrogen Fate • Whatare some of the potential fates for N applied to a turf surface? – Taken up by grass – Microorganisms – Denitrification – Volatilization – Leaching
  • 25.
    Sources of Nitrogen • Fertilizer • Returned Clippings • Organic Matter • Lightning (precipitation)
  • 26.
    Consider the WholeSystem! • What can you change in your current system to further reduce N need? – Mowing – Irrigation – Fertilization – Equipment repair/replacement – Inventory management – Employees
  • 27.
    Mowing/Maintenance • Increase mowingheight – Increase root depth and photosynthetic capacity • Reduce highly maintained areas – Reducing fairway width/length to emphasize landing areas – Reduce/Eliminate flower beds/ornamentals – Fairways vs roughs
  • 28.
  • 29.
    Irrigation • Conduct irrigationaudit • Ensure application rate/amount does not exceed infiltration • Match irrigation to weekly ET rates, accounting for rainfall received – On-site weather station – http://fawn.ifas.ufl.edu • Irrigation + rainfall should not wet profile below rootzone, only refill it!
  • 30.
    Soil Compaction • Compactedsoils – Reduced pore space = reduced root growth = reduced N uptake – Decreased infiltration increases risk of runoff • Monitor compaction, vary method/depth of aerfication
  • 31.
  • 32.
    Quickly Available N •Very soluble • Rapid response • Short response • Cheap • Minimal temperature dependency • High leaching potential • Tendency to burn
  • 33.
    Quickly Available N •Ammonium nitrate 33-0-0 • Ammonium sulfate 21-0-0 • Ammonium phosphates – mono-ammonium phosphate 11-48-0 – di-ammonium phosphate 20-50-0 • Potassium nitrate 13-0-44 • Urea (organic?) 46-0-0
  • 34.
    Slow Release NitrogenSources • Slow initial response • Longer response than quick release • Some, but not all, are dependent on temperature for N release • Low burn potential • Moderately expensive to expensive • Less N leaching
  • 35.
    Why Use SlowRelease Fertilizers? • More uniform growth response • No growth surge • Longer growth response • Less chance of burn • Less leaching of nitrate • Labor saving
  • 36.
    Uncoated Slow ReleaseFertilizers • Urea formaldehyde (UF) • Methylene urea (MU) • Isobutylidene diurea (IBDU) • Natural organics
  • 37.
    Ureaform and MethyleneUrea • Very similar materials chemically • Mostly granular, some liquids • about 40% N, 70% WIN (28% N for liquids, all soluble) • Formed by reacting urea and formaldehyde = chains of alternating C and N • Main difference is chain length, and as a result, mineralization rate
  • 38.
    Products • Formolene 30-0-2 • FLUF 18-0-0 • Nitro 26 CRN 26-0-0 • Nitroform (Powder Blue, Blue Chip) 38-0-0 • CoRoN 28-0-0 – (25% of total N is urea)
  • 39.
    Different Chain Lengths MethyleneUrea N-C-N N-C-C-C N-C-C-C-C N-C-C-C-C-C-C-C Urea Formaldehyde N-C-N N-C-C-C-C-C-C-C N-C-C-C-C-C-C-C-C-C N-C-C-C-C-C-C-C-C-C-C-C-C N-C-C-C-C-C-C-C-C-C-C-C-C-C-C-C
  • 40.
    Ureaform and MethyleneUrea • Designed to release N for 8-12 weeks • Contains unreacted urea, fast greening • Requires soil microbial activity – temperature sensitive, soil at 78o F is four times as active as soil at 42o F – moisture sensitive • Seasonal response
  • 41.
    Nitroform • Urea formaldehyde • Insoluble organic • 38% N; 65-71% WIN • Biological N release – Rate influenced by soil temperature
  • 42.
    Nutralene •Methylene urea • 40% N; 38% WIN • Biological N release • More rapidly available than UF • Not as adversely influenced by cool temperatures
  • 43.
    IBDU • Urea isreacted with isobutyraldehyde • Only a single chemical product is formed, not a bunch of different molecules. 31% N, 90% WIN • Different sized granules available • N release depends on solubility and hydrolysis (IBDU molecule reacts with water and breaks apart), releasing urea. • No free urea in IBDU, may need to add
  • 44.
    IBDU • Urea breaksdown quickly to NH4 • IBDU is relatively insoluble, so only small amounts are available at any one time • Release sensitive to soil moisture, less on dependant on temperature • Release also depends on granule size and contact with soil. Smaller granules release N faster than larger granules
  • 45.
    IBDU • 31% N-90% WIN • N released by hydrolysis • Relatively unaffected by – Temperature – pH • Particle size important • Excellent cool season response
  • 46.
    Liquid Slow ReleaseFertilizers • Chemistry similar to UF, MU • Micro-suspension of MU (FLUF) • CoRoN, N-Sure; 28%N, 7% as urea and 21% as short chain MU or small ring structure. • Get quick and slow release • Foliar application? • Is slow release slow enough?
  • 47.
    Liquid Slow ReleaseFertilizers • Easily handled, applied • Can be formulated with P and K • Some have short storage life • Require specialized delivery system • Volume of liquid used in application is not enough to move the material down into the root system - must irrigate in
  • 48.
    CoRon • 28%N solution • Polymethylene ureas and amine modified polymethylene ureas • N release dependent upon microbial action
  • 49.
    N-Sure • 30%N • Ring structured Triazones may contain methylene diurea • N release by microbial action • Response very similar to CoRon
  • 50.
    Coated Slow ReleaseFertilizers • SCU, sulfur coated urea • Polymer coated urea • Poly Coated Sulfur Coated Urea
  • 51.
    Sulfur Coated Urea •Molten sulfur (S) sprayed on urea in rotating drum, coated in wax sealant • Experimentally produced in 1950’s, commercially in 1972 • N release determined by: – Coating thickness – Microbial degradation – Temperature – Moisture – Coating failure (cracks, abrasion)
  • 52.
    Sulfur Coated Urea • 32-38% N • Release depends upon – Thickness of sulfur coating – Biological activity – Soil environment • Temperature • pH • Cool temperature response erratic • Coating fragile, uneven
  • 54.
    Polymer Coated Urea •Solid urea or other nutrient core, coated with various polymers (“plastics”) • Coatings are tough, resist damage, thin • Coating chemistry affects membrane properties, release rate • Release is due to controlled diffusion, which is fairly constant over time • Release depends on coat thickness, chemistry, temperature, moisture
  • 55.
    Polyon • 40%N • Polyurethane coated urea • N release influenced by – Coating thickness – Diffusion rate – Soil temperature • Good for both warm and cool season • Coating is abrasion resistant
  • 56.
    Poly-S • Coatedwith sulfur and a polymer – Cheaper than regular polymer coated fertilizers • Release dependent on – Temperature – Soil moisture
  • 57.
    Fertilizer Programs • Minimumof 30-50% slowly available N is appropriate – Choose CRN source based on environmental conditions, budget, level of traffic • 4-10 lbs N/M annually, depending on level of use/traffic – Do not apply more than 1 lb soluble N/M at one time – Carefully consider use of coated products in high traffic areas due to potential damage to coating • Late fall application of IBDU has been shown to improve spring color
  • 58.
  • 59.
    PERCENT N RELEASEDOVER TIME FOR SELECTED CRN MATERIALS 100 80 60 40 20 0 7 14 28 42 56 84 112 140 180 NITROFORM NUTRALENE MILORGANITE POLYON SCU AN
  • 60.
    Weeks of “Greening” NitrogenSource Application Rate Weeks Greening Urea 1 4 Ammonium Sulfate 1 4 POLYON Regular 1.25 12 Nutralene 1.5 12 Nitroform 2 16 IBDU 1.5 12
  • 61.
    Relative Product Price NitrogenSource Analysis $/ton $/lb N Urea 46-0-0 700 0.76 Ammonium Sulfate 21 - 0 - 0 300 0.71 POLYON Regular 43 - 0 - 0 1,500 1.74 Nutralene 40 - 0 - 0 1,300 1.63 Nitroform 38 - 0 - 0 1,500 1.97 IBDU 31 - 0 - 0 1,500 2.42
  • 62.
  • 63.
    Why is NitrogenFertilizer so High Priced? • High prices have coincided with spikes in price of gas • Fertilizer shipping costs are important – U.S. imports more than 8 million metric tons of Nitrogen fertilizer annually • Natural gas is used to manufacture N- fertilizers
  • 64.
    Why is NitrogenFertilizer so High Priced? Nitrogen (atm) Anhydrous + Natural gas Ammonia Heat N2 + CH4 + H2O 2NH3 + CO Pressure
  • 65.
    Why is NitrogenFertilizer so High Priced? Anhydrous Ammonia + + Sulfuric Nitric + CO2 Acid acid Ammonium Sulfate Ammonium Nitrate Urea
  • 66.
    Price Volatility • Pricefor fertilizers spiked in 2008/2009 – Spike in natural gas prices U.S. Natural Gas Wellhead Price 12 10 8 6 Data 1: U.S. Natural Gas Wellhead Price (Dollars per Thousand Cubic Feet) N9190US3 U.S. Natural Gas Wellhead… 4 2 0 Mar-… Aug-… Mar-… Aug-… Mar-… Aug-… Nov-… Nov-… Nov-… Feb-… Sep-… Feb-… Sep-… Feb-… May-… Sep-… May-… May-… Dec-… Dec-… Dec-… Oct-1982 Oct-1995 Oct-2008 Jan-1973 Apr-1976 Jan-1986 Jan-1999 Jul-1979 Jul-1992 Jul-2005 Apr-1989 Apr-2002 Jun-1978 Jun-1991 Jun-2004
  • 67.
    Price Volatility • Whileprices have stabilized, futures prices trend upwards through 2016 • Price of natural gas is only a small piece of the picture…
  • 68.
    Fertilizer Consumption Millions ofmetric tons consumed annually 45,000 40,000 35,000 30,000 25,000 US 20,000 China 15,000 10,000 5,000 0 2002 2003 2004 2005 2006 2007 2008 2009 2010
  • 69.
  • 70.
  • 71.
    Volatile Prices • Fertilizers – As much as 85% of variable expenses – Prices increased dramatically • Nitrogen and Phosphorus – 300-400% increase from 2002-2008 – Within year price changes over past 3-4 seasons: • +/- $100/ton for anhydrous ammonia seasonally • +/- $500/ton for phosphorus seasonally Source: Kenkel, P. and T. Kim. 2009. Optimal cash purchase strategies to reduce fertilizer price risk. Southern Agricultural Economics Association Annual Meeting, Atlanta, Georgia, January 31 – February 3, 2009.
  • 72.
    Volatile Prices • Withso much within year variability, time of purchase is critical! – Price is driven by world market – Suppliers stockpile fertilizer for peak demand – Dealers attempt to shift risk through advance purchase programs – It is possible to save as much as 16% if purchased at correct time of the year
  • 73.
    Volatile Prices • Besttime of year to purchase – Urea: 1st or 2nd week in July – Phosphorus: 1st week in November • Highest prices – Urea: March/April – Phosphorus: March
  • 74.
    Summary • Proper nutrientmanagement is essential • Careful management of cultural practices can have significant impact on effectiveness of N applications • Important to understand differences in fertilizer materials/use • Slow release fertilizers have potential to save time/labor and wear on equipment • Budget savings can be realized through scheduled purchases of fertilizer materials
  • 75.
    Questions? Jason Kruse, Ph.D. PO Box 110670 Gainesville, FL 32611 352-273-4569 jkk@ufl.edu