Downloaded 360 times


![WACC
A company’s assets are financed by either debt or equity, as an
increase in WACC notes a decrease in valuation and a higher risk.
Formula
WACC = [Kd(1-t) x D/(D+E)] + [Ke x E/(D+E)]
UPS gain lower WACC in the recent years
WACC](https://image.slidesharecdn.com/fedex-ups-novideo-final-140803114529-phpapp01/75/The-Battle-for-Value-FedEx-vs-UPS-18-2048.jpg)


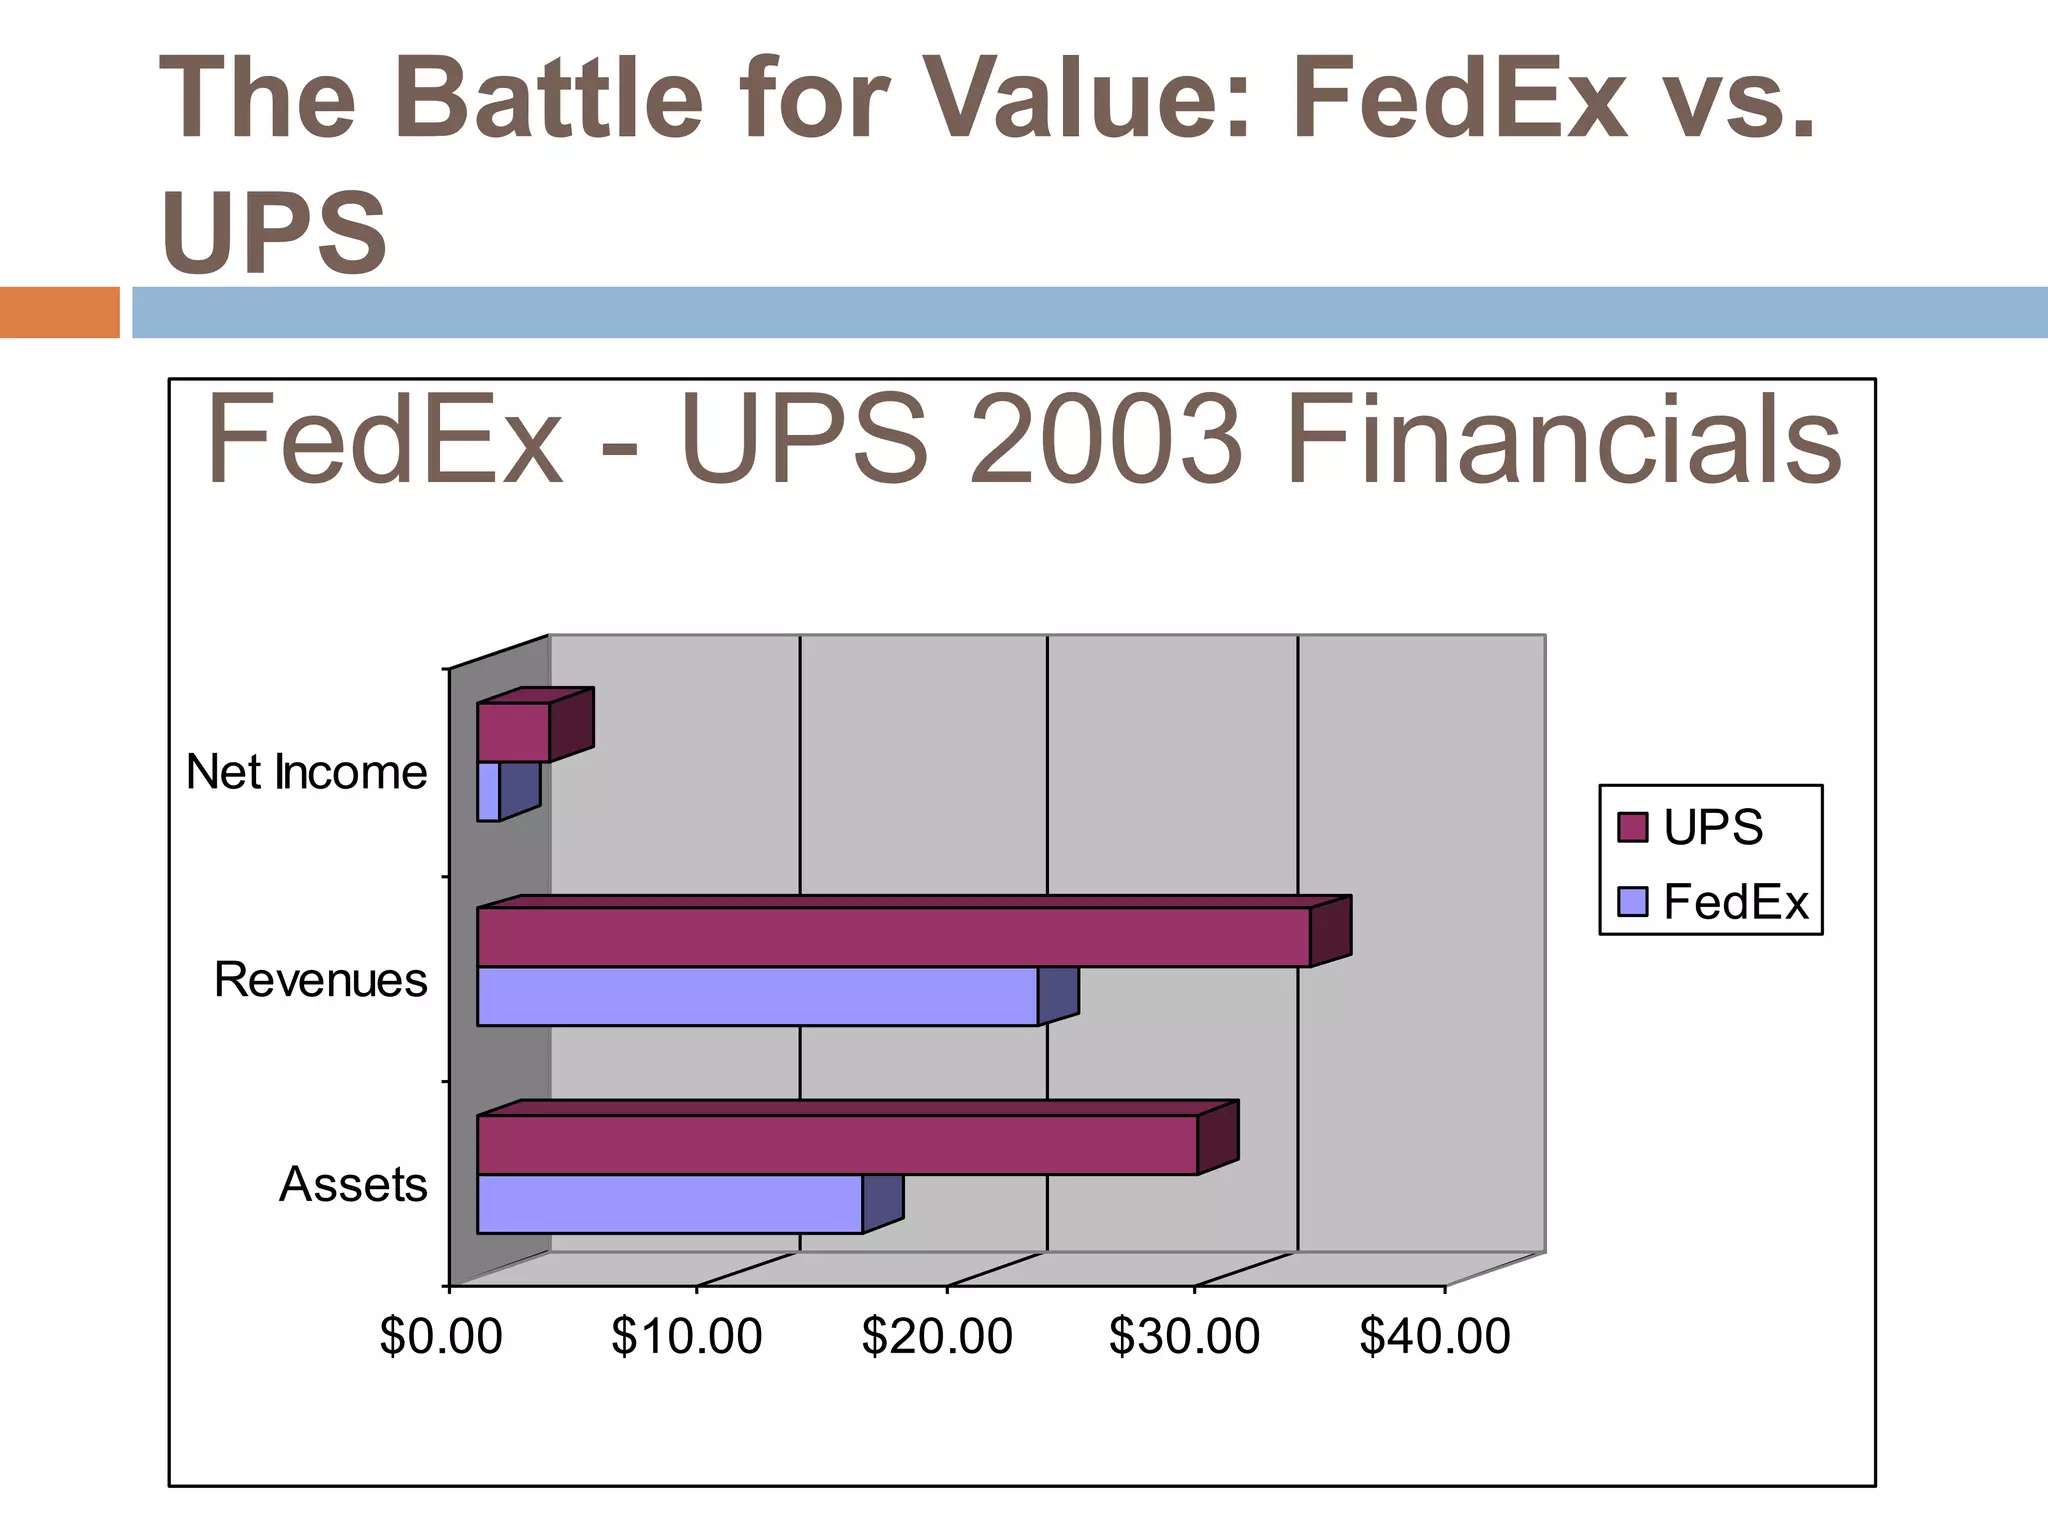
1) The document compares FedEx and UPS on various financial metrics from 2003. UPS had higher net income, revenues, and assets compared to FedEx. 2) Several dimensions of competition between the two companies are discussed, including customer focus, price competition, technology usage, and service expansion. 3) Metrics like return on assets, return on equity, economic value added, and market value added in recent years favored UPS, indicating better profitability and management effectiveness at creating shareholder value. Stock price, dividends per share, and annual returns for UPS were also higher than FedEx based on the financial data presented.


