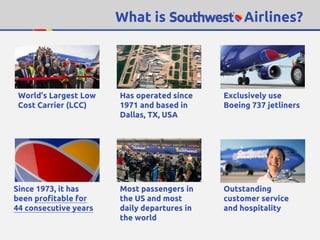
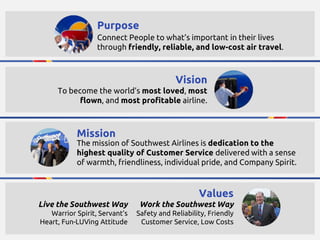
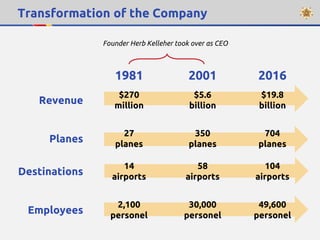
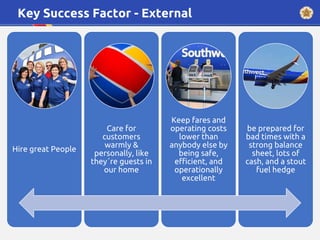
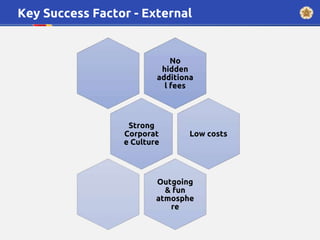
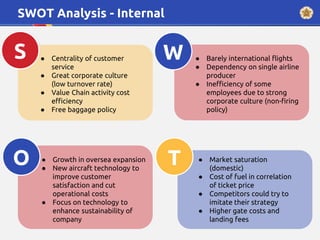
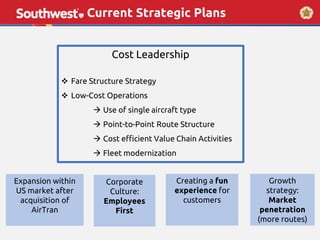
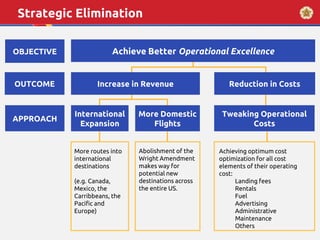
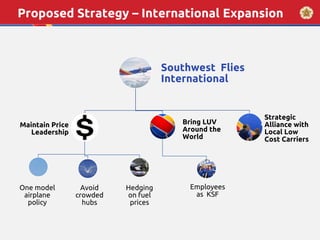
Ari Permadi Sakti
Fadrian Jatmiko
Leonie Fusban
Rami Ibrahim
Yannick Münzinger
Sriwiyata Ismail Z.
Strategic Management Group 4
Culture, Values, and Operating Practices in 2016
2. ?1. Company Introduction
 History
 Values
 Key Figures
2. Present Analysis
 KSF
 Driving Forces of
Industry
3. Future Analysis
 PESTEL
 Perceptual Map
 Porter´s Five Forces
 Competitor Analysis
 SWOT
4. Proposed Strategy
 Strategic Plans
 Strategic Elimination
 Balance Score Card
 Proposed Strategy
Part 1/3:
Case
Overview
What is Airlines?
World’s Largest Low
Cost Carrier (LCC)
Exclusively use
Boeing 737 jetliners
Has operated since
1971 and based in
Dallas, TX, USA
Since 1973, it has
been profitable for
44 consecutive years
Most passengers in
the US and most
daily departures in
the world
Outstanding
customer service
and hospitality
Company’s History
1967 1971
2014
1979
2011
2004
2001
1981
Founded by
Rollin’ King
and Herb
Kelleher
First flight out
of Dallas Love-
Field Airport
After battling
numerous legal
hurdle,
Kelleher took
over as CEO
Complete
redesign of the
airline visual
identity and logo
Kelleher
stepped down
as CEO, a
legend in the
industry
The infamous Wright
Amendment, limiting
what airports the
airline can fly into
was enacted
The effective
abolishment of
Wright
Amendment
Gary C. Kelly
took on the
role of CEO
(and is still
Southwest
CEO up until
present).
20062016
Preparation
for
international
expansion
Start of
AirTran
acquisition
where the
company was
successfully
merged in
2014
The Wright
Amendment was
repealed in court,
boosting revenue
from Dallas Love-
Field by almost
1000%
The mission of Southwest Airlines is dedication to the
highest quality of Customer Service delivered with a sense
of warmth, friendliness, individual pride, and Company Spirit.
To become the world’s most loved, most
flown, and most profitable airline.
Connect People to what’s important in their lives
through friendly, reliable, and low-cost air travel.
Purpose
Vision
Mission
Values
Live the Southwest Way
Warrior Spirit, Servant’s
Heart, Fun-LUVing Attitude
Work the Southwest Way
Safety and Reliability, Friendly
Customer Service, Low Costs
Transformation of the Company
1981 2001 2016
Revenue
Planes
Destinations
Employees
$270
million
27
planes
14
airports
2,100
personel
$5.6
billion
350
planes
58
airports
30,000
personel
$19.8
billion
704
planes
104
airports
49,600
personel
Founder Herb Kelleher took over as CEO
Key Financial Figures and Ratios
2015 2014 2013 2012 2011
Total Assets $ 21,312 $ 19,723 $19,345 $ 18,596 $18,068
(***) D/E Ratio 1.896 1.982 1.637 1.660 1.627
Operating Income $ 4,116 $ 2,225 $ 1,278 $ 623 $ 693
Net Income $ 1,298 $ 1,136 $ 754 $ 421 $ 178
Earnings per Share $ 3.30 $ 1.65 $ 1.06 $ 0.56 $ 0.23
EPS (Diluted) $ 3.27 $ 1.64 $ 1.06 $ 0.56 $ 0.23
ROIC (pre-tax) 32.70% 21.20% 13.10% 7.20% 6.80%
(**) WACC 9.29% 5.57% 7.57% 5.16% 6.00%
* All currency in million USD
(**) Prediction by analysts
(***) Industry standards for DE ratio is
around 7.00 to 9.00
The company uses Economic Earnings
(ROIC – WACC) as one of their primary
measure of financial performance.
Part 2/3:
Internal and
External
Analysis
Key Success Factor - External
Hire great People
Care for
customers
warmly &
personally, like
they´re guests in
our home
Keep fares and
operating costs
lower than
anybody else by
being safe,
efficient, and
operationally
excellent
be prepared for
bad times with a
strong balance
sheet, lots of
cash, and a stout
fuel hedge
Key Success Factor - External
No
hidden
additiona
l fees
Strong
Corporat
e Culture
Low costs
Outgoing
& fun
atmosphe
re
Driving Forces of Industry - External
Technological Forces
- Performance optimization
- Innovations in
transportation industry
Social & Demographic
Forces
- Globalization
- Changing societal concerns &
lifestyles
- Environmental consciousness
Economic Forces
- Aggregated Demand
- Oil prices
- Global GDP fluctuations
Regulatory Forces
- Regulation & Deregulations
- Treaties
Attractiveness of Industry / Lifecycle
Canals
Rail
Roads
Air
1836
1800 1850 1900 1950 2000 2050
0%
1%
2%
3%
4%
1891 1946 2015
Δt= 30 years
Δt= 55 years Δt= 65 years Δt= 70 years
1825
1869
1913 1969
1836
1825 Paradigm shift
Peak year
1st
Where to fly next?
P
PESTEL Analysis - External
Impact on Supply Impact on Demand
Decrease in margins due
to increasing competition
related to deregulation
Deregulation
Security requirements
increase operational costTerrorism
Political
& Legal
Economic Impact on Supply Impact on Demand
Deregulation allows sharp
rise in routes and
competition and drop in
price
Increased in waiting time
and general unpleasantness
High
High
Low
Low
E
Volatility in oil price has
major impact on Southwest,
but overall in the long run
through fuel hedging the
impact could be lessen
Volatility in oil price tend
to encourage airline to
increase price, making air
traveler less attractive
Low
Low
Fuel Prices
Continued
PESTEL Analysis - External
E
Impact on Supply Impact on Demand
Global
Expansion
Falling Flight
Fares
Economic
Social Impact on Supply Impact on Demand
High
High
High
High
S
Introduction of JetBlue into
the LCCs market put
pressure to compete in
price, eroding margin
Increase in opportunities
for growth in different
market
Increased demand by
general flyers
Increased demand
by Business and
Leisure Flyer
Rise of
Middle Class
Flyers
More people are now able
to fly, making the industry
more crowded with new
airlines.
Holiday
Travelers
High
High
High
High
Increased demand of
airlines with low cost
affinity
Culture of holidays travel,
aided by social media,
necessitate the need for
more routes
People preferring airline
with diverse assorted
route in their travel
PESTEL Analysis - External
T
Impact on Supply Impact on Demand
Drive for
Innovation
Lower
Operating
Cost
Technology
Environment Impact on Supply Impact on Demand
High
High
High
High
E
Modern aircraft are more
economical to run, lowering
operating costs.
High cost and
unpredictable results for
investing in RnD.
Lower operating cost
reduce price, increase
demand.
Better on-board
conditions increased
demand.
Online
Booking
Lower or even eliminates
intermediation cost to
airline companies.
Environmental
Concerns
High
High
Low
Low
Lower or even eliminate
intermediation cost to
customer.
Given how large the
contribution of airline
industry to climate change
necessitates efforts to
address environmental issue.
Customer increasingly
prefer eco friendly
airlines.
Low
Fares
High
Fares
Poor Customer Service
Good Customer Service
Perceptual Mapping - External
Porter’s Five Forces - External
Competitive
Rivalry
Threat from
Substitute Products
Threat of New
Entrants
Low
Buyer
Bargaining
Power
Supplier
Bargaining
Power
Other modes of
transportation
Airplanes: Just
Boeing and
Airbus  High
Other: Many
interchangeable
suppliers vs.
few airline
companies.
Southwest
offers huge
volume.
 Low
Very low
switching cost
Main service
(transport)
highly
interchangeable
Difficult to maintain
competitive edge
Industry in maturity stage
High exit barriers
Large initial investments
Importance of learning curve effects
Strong governmental regulations
Building trust takes a long time
Loyal customer base
High
HighModerate
Low
Competitor Analysis - External
Low Fares
Cost Efficiency
Route
On Time
Performance
(*) Mishandled
Baggage Report
Involuntary
Denied
Boardings
(*) Data from reports per 1000 passengers. Higher performance mean less reports.
SWOT Analysis - Internal
TO
● Centrality of customer
service
● Great corporate culture
(low turnover rate)
● Value Chain activity cost
efficiency
● Free baggage policy
● Barely international flights
● Dependency on single airline
producer
● Inefficiency of some
employees due to strong
corporate culture (non-firing
policy)
● Growth in oversea expansion
● New aircraft technology to
improve customer
satisfaction and cut
operational costs
● Focus on technology to
enhance sustainability of
company
● Market saturation
(domestic)
● Cost of fuel in correlation
of ticket price
● Competitors could try to
imitate their strategy
● Higher gate costs and
landing fees
S W
Part 3/3:
Strategic
Implementation
Current Strategic Plans
Cost Leadership
 Fare Structure Strategy
 Low-Cost Operations
 Use of single aircraft type
 Point-to-Point Route Structure
 Cost efficient Value Chain Activities
 Fleet modernization
Expansion within
US market after
acquisition of
AirTran
Corporate
Culture:
Employees
First
Creating a fun
experience for
customers
Growth
strategy:
Market
penetration
(more routes)
Achieve Better Operational ExcellenceOBJECTIVE
Increase in RevenueOUTCOME Reduction in Costs
APPROACH
International
Expansion
More Domestic
Flights
Tweaking Operational
Costs
More routes into
international
destinations
(e.g. Canada,
Mexico, the
Carribbeans, the
Pacific and
Europe)
Abolishment of the
Wright Amendment
makes way for
potential new
destinations across
the entire US.
Achieving optimum cost
optimization for all cost
elements of their operating
cost:
Landing fees
Rentals
Fuel
Advertising
Administrative
Maintenance
Others
Strategic Elimination
Proposed Strategy – International Expansion
Southwest Flies
International
Maintain Price
Leadership
One model
airplane
policy
Avoid
crowded
hubs
Hedging
on fuel
prices
Bring LUV
Around the
World
Employees
as KSF
Strategic
Alliance with
Local Low
Cost Carriers
Proposed Strategy – Balanced ScoreCard
Objectives Measures Target Initiatives
FinancialCustomer
Internal
Processes
Learning
&Growth
Increase
Revenue
Lower
Operating Cost
Customer
Satisfaction
Fast Ground
Turnaround
Aligning Crew with
the “Operational
Excellence”
Strategy
Increased Profitability
Seat Revenue
CASM
Market Value
Involuntary
Denied
Boardings
Mishandled
Baggage
Time on
Ground
On Time
Performance
% Ground
Crew trained
% Ground Crew
Shareholders
% Supervisor
Internally
20% CAGR
(25%)
10% CAGR
Reduce
20%
Reduce 43%
to 1.50
20
minutes
90%
90%
99%
100%
Cut lending fees, fuel
and rental
International and
domestic expansion
Revenue Management
Algorithm
Total Quality
Management
Cycle-time
optimization program
Profit Sharing Plan
Increase productivity
per employee
Staff Training
Employee Benefit
Package
Thank You for Flying With
!

Southwest Airlines : Case Study 2016 (Group Work)

  • 1.
    Ari Permadi Sakti FadrianJatmiko Leonie Fusban Rami Ibrahim Yannick Münzinger Sriwiyata Ismail Z. Strategic Management Group 4 Culture, Values, and Operating Practices in 2016
  • 2.
    2. ?1. CompanyIntroduction  History  Values  Key Figures 2. Present Analysis  KSF  Driving Forces of Industry 3. Future Analysis  PESTEL  Perceptual Map  Porter´s Five Forces  Competitor Analysis  SWOT 4. Proposed Strategy  Strategic Plans  Strategic Elimination  Balance Score Card  Proposed Strategy
  • 3.
  • 4.
    What is Airlines? World’sLargest Low Cost Carrier (LCC) Exclusively use Boeing 737 jetliners Has operated since 1971 and based in Dallas, TX, USA Since 1973, it has been profitable for 44 consecutive years Most passengers in the US and most daily departures in the world Outstanding customer service and hospitality
  • 5.
    Company’s History 1967 1971 2014 1979 2011 2004 2001 1981 Foundedby Rollin’ King and Herb Kelleher First flight out of Dallas Love- Field Airport After battling numerous legal hurdle, Kelleher took over as CEO Complete redesign of the airline visual identity and logo Kelleher stepped down as CEO, a legend in the industry The infamous Wright Amendment, limiting what airports the airline can fly into was enacted The effective abolishment of Wright Amendment Gary C. Kelly took on the role of CEO (and is still Southwest CEO up until present). 20062016 Preparation for international expansion Start of AirTran acquisition where the company was successfully merged in 2014 The Wright Amendment was repealed in court, boosting revenue from Dallas Love- Field by almost 1000%
  • 6.
    The mission ofSouthwest Airlines is dedication to the highest quality of Customer Service delivered with a sense of warmth, friendliness, individual pride, and Company Spirit. To become the world’s most loved, most flown, and most profitable airline. Connect People to what’s important in their lives through friendly, reliable, and low-cost air travel. Purpose Vision Mission Values Live the Southwest Way Warrior Spirit, Servant’s Heart, Fun-LUVing Attitude Work the Southwest Way Safety and Reliability, Friendly Customer Service, Low Costs
  • 7.
    Transformation of theCompany 1981 2001 2016 Revenue Planes Destinations Employees $270 million 27 planes 14 airports 2,100 personel $5.6 billion 350 planes 58 airports 30,000 personel $19.8 billion 704 planes 104 airports 49,600 personel Founder Herb Kelleher took over as CEO
  • 8.
    Key Financial Figuresand Ratios 2015 2014 2013 2012 2011 Total Assets $ 21,312 $ 19,723 $19,345 $ 18,596 $18,068 (***) D/E Ratio 1.896 1.982 1.637 1.660 1.627 Operating Income $ 4,116 $ 2,225 $ 1,278 $ 623 $ 693 Net Income $ 1,298 $ 1,136 $ 754 $ 421 $ 178 Earnings per Share $ 3.30 $ 1.65 $ 1.06 $ 0.56 $ 0.23 EPS (Diluted) $ 3.27 $ 1.64 $ 1.06 $ 0.56 $ 0.23 ROIC (pre-tax) 32.70% 21.20% 13.10% 7.20% 6.80% (**) WACC 9.29% 5.57% 7.57% 5.16% 6.00% * All currency in million USD (**) Prediction by analysts (***) Industry standards for DE ratio is around 7.00 to 9.00 The company uses Economic Earnings (ROIC – WACC) as one of their primary measure of financial performance.
  • 9.
  • 10.
    Key Success Factor- External Hire great People Care for customers warmly & personally, like they´re guests in our home Keep fares and operating costs lower than anybody else by being safe, efficient, and operationally excellent be prepared for bad times with a strong balance sheet, lots of cash, and a stout fuel hedge
  • 11.
    Key Success Factor- External No hidden additiona l fees Strong Corporat e Culture Low costs Outgoing & fun atmosphe re
  • 12.
    Driving Forces ofIndustry - External Technological Forces - Performance optimization - Innovations in transportation industry Social & Demographic Forces - Globalization - Changing societal concerns & lifestyles - Environmental consciousness Economic Forces - Aggregated Demand - Oil prices - Global GDP fluctuations Regulatory Forces - Regulation & Deregulations - Treaties
  • 13.
    Attractiveness of Industry/ Lifecycle Canals Rail Roads Air 1836 1800 1850 1900 1950 2000 2050 0% 1% 2% 3% 4% 1891 1946 2015 Δt= 30 years Δt= 55 years Δt= 65 years Δt= 70 years 1825 1869 1913 1969 1836 1825 Paradigm shift Peak year
  • 14.
  • 15.
    P PESTEL Analysis -External Impact on Supply Impact on Demand Decrease in margins due to increasing competition related to deregulation Deregulation Security requirements increase operational costTerrorism Political & Legal Economic Impact on Supply Impact on Demand Deregulation allows sharp rise in routes and competition and drop in price Increased in waiting time and general unpleasantness High High Low Low E Volatility in oil price has major impact on Southwest, but overall in the long run through fuel hedging the impact could be lessen Volatility in oil price tend to encourage airline to increase price, making air traveler less attractive Low Low Fuel Prices Continued
  • 16.
    PESTEL Analysis -External E Impact on Supply Impact on Demand Global Expansion Falling Flight Fares Economic Social Impact on Supply Impact on Demand High High High High S Introduction of JetBlue into the LCCs market put pressure to compete in price, eroding margin Increase in opportunities for growth in different market Increased demand by general flyers Increased demand by Business and Leisure Flyer Rise of Middle Class Flyers More people are now able to fly, making the industry more crowded with new airlines. Holiday Travelers High High High High Increased demand of airlines with low cost affinity Culture of holidays travel, aided by social media, necessitate the need for more routes People preferring airline with diverse assorted route in their travel
  • 17.
    PESTEL Analysis -External T Impact on Supply Impact on Demand Drive for Innovation Lower Operating Cost Technology Environment Impact on Supply Impact on Demand High High High High E Modern aircraft are more economical to run, lowering operating costs. High cost and unpredictable results for investing in RnD. Lower operating cost reduce price, increase demand. Better on-board conditions increased demand. Online Booking Lower or even eliminates intermediation cost to airline companies. Environmental Concerns High High Low Low Lower or even eliminate intermediation cost to customer. Given how large the contribution of airline industry to climate change necessitates efforts to address environmental issue. Customer increasingly prefer eco friendly airlines.
  • 18.
    Low Fares High Fares Poor Customer Service GoodCustomer Service Perceptual Mapping - External
  • 19.
    Porter’s Five Forces- External Competitive Rivalry Threat from Substitute Products Threat of New Entrants Low Buyer Bargaining Power Supplier Bargaining Power Other modes of transportation Airplanes: Just Boeing and Airbus  High Other: Many interchangeable suppliers vs. few airline companies. Southwest offers huge volume.  Low Very low switching cost Main service (transport) highly interchangeable Difficult to maintain competitive edge Industry in maturity stage High exit barriers Large initial investments Importance of learning curve effects Strong governmental regulations Building trust takes a long time Loyal customer base High HighModerate Low
  • 20.
    Competitor Analysis -External Low Fares Cost Efficiency Route On Time Performance (*) Mishandled Baggage Report Involuntary Denied Boardings (*) Data from reports per 1000 passengers. Higher performance mean less reports.
  • 21.
    SWOT Analysis -Internal TO ● Centrality of customer service ● Great corporate culture (low turnover rate) ● Value Chain activity cost efficiency ● Free baggage policy ● Barely international flights ● Dependency on single airline producer ● Inefficiency of some employees due to strong corporate culture (non-firing policy) ● Growth in oversea expansion ● New aircraft technology to improve customer satisfaction and cut operational costs ● Focus on technology to enhance sustainability of company ● Market saturation (domestic) ● Cost of fuel in correlation of ticket price ● Competitors could try to imitate their strategy ● Higher gate costs and landing fees S W
  • 22.
  • 23.
    Current Strategic Plans CostLeadership  Fare Structure Strategy  Low-Cost Operations  Use of single aircraft type  Point-to-Point Route Structure  Cost efficient Value Chain Activities  Fleet modernization Expansion within US market after acquisition of AirTran Corporate Culture: Employees First Creating a fun experience for customers Growth strategy: Market penetration (more routes)
  • 24.
    Achieve Better OperationalExcellenceOBJECTIVE Increase in RevenueOUTCOME Reduction in Costs APPROACH International Expansion More Domestic Flights Tweaking Operational Costs More routes into international destinations (e.g. Canada, Mexico, the Carribbeans, the Pacific and Europe) Abolishment of the Wright Amendment makes way for potential new destinations across the entire US. Achieving optimum cost optimization for all cost elements of their operating cost: Landing fees Rentals Fuel Advertising Administrative Maintenance Others Strategic Elimination
  • 25.
    Proposed Strategy –International Expansion Southwest Flies International Maintain Price Leadership One model airplane policy Avoid crowded hubs Hedging on fuel prices Bring LUV Around the World Employees as KSF Strategic Alliance with Local Low Cost Carriers
  • 26.
    Proposed Strategy –Balanced ScoreCard Objectives Measures Target Initiatives FinancialCustomer Internal Processes Learning &Growth Increase Revenue Lower Operating Cost Customer Satisfaction Fast Ground Turnaround Aligning Crew with the “Operational Excellence” Strategy Increased Profitability Seat Revenue CASM Market Value Involuntary Denied Boardings Mishandled Baggage Time on Ground On Time Performance % Ground Crew trained % Ground Crew Shareholders % Supervisor Internally 20% CAGR (25%) 10% CAGR Reduce 20% Reduce 43% to 1.50 20 minutes 90% 90% 99% 100% Cut lending fees, fuel and rental International and domestic expansion Revenue Management Algorithm Total Quality Management Cycle-time optimization program Profit Sharing Plan Increase productivity per employee Staff Training Employee Benefit Package
  • 27.
    Thank You forFlying With !

Editor's Notes

  • #21 Low Fares: American Airlines: The average round-trip flight on American costs $227, according to Hopper. United Airlines: The average cost of a ticket on United fell 7% year-over-year, to $234 from $285. That’s the third Delta Air Lines: Thanks to Delta’s expansion of its no-frills “basic economy” fare to more markets, the carrier saw the biggest year-over-year decline in average roundtrip airfares, according to Hopper. Tickets dropped 17% to $238 this year, from $269 in 2016.-biggest drop among domestic carriers, Hopper found. Southwest & Jetblue: are low cost carrier so we assum they are the best lower fares provider Cost Efficiency (based on the Cost Statistic per Revenue) --- 2015 Southwest: 13.35 Delta: 17.50 American: 17.09 United Airline: 17.81 Jet Blue: 10.01 (http://investor.jetblue.com/investor-relations/financial-information/quarterly-results/28-01-2016) Number of Route/ Destinationm: Southwest: 4,000 flights (https://www.swamedia.com/pages/corporate-fact-sheet) Delta: 5,400 flights (http://news.delta.com/corporate-stats-and-facts) American: 6,700 flights (https://www.usatoday.com/story/travel/flights/todayinthesky/2016/12/06/fleet-and-hubs-american-airlines-numbers/95014004/) United Airline: 4,500 Daily (http://newsroom.united.com/corporate-fact-sheet) JetBlue: 1,000 daily flights (http://mediaroom.jetblue.com/investor-relations/press-releases/2017/08-17-2017-150014624) On Time Performance: Southwest: 86.1% Delta: 91.4% American:  85.4% United Airline: 86.1% JetBlue:84.3% Mishandled Baggage Report: Southwest: 2.77 Delta: 1.56 American:  3.08 United Airline: 2.29 JetBlue: Involuntary Denied Boarding: Southwest: 0.91 Delta: 0.10 American:  0.84 United Airline: 0.49 JetBlue: 1.61 (https://www.buzzfeed.com/matthewzeitlin/why-does-jetblue-involuntarily-bump-so-many-people-from-its?utm_term=.puyxPgNpm#.vea6nyY0k)