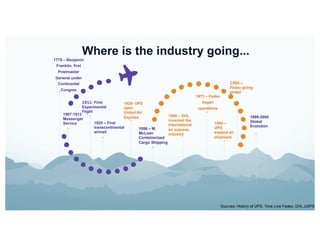
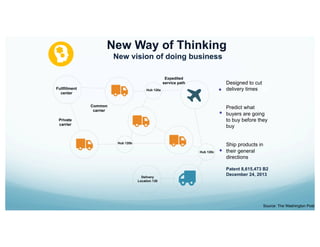
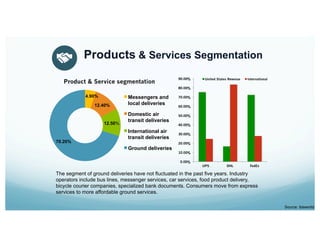
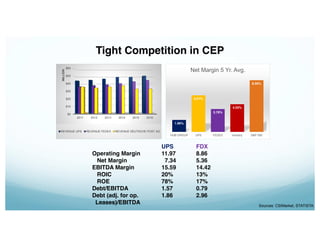
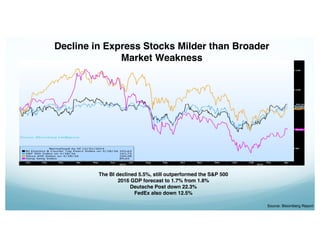
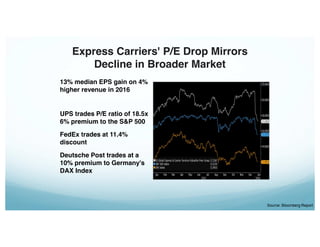
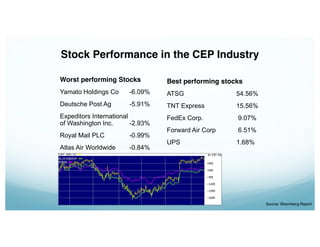
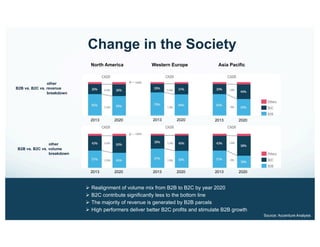
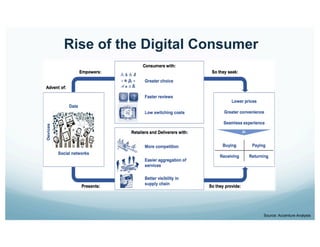
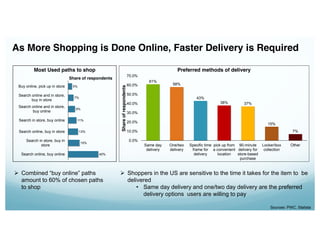
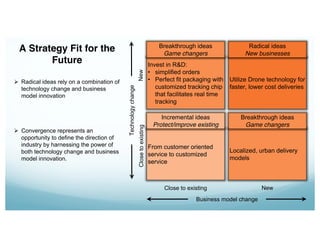
4. 1775 – Benjamin
Franklin, first
Postmaster
General under
Continental
Congres
1973 – Fedex
began
operations
1956 – M.
McLean
Containerized
Cargo Shipping
1911- First
Experimental
Flight
1920 – First
transcontinental
airmail
1969 – DHL
invented the
international
air express
industry
1984 –
Fedex going
global
1907-1913
Messenger
Service 1980 –
UPS
expand air
shipment
1999-2000
Global
Evolution
1929- UPS
open
United Air
Express
Sources: History of UPS, Time Line Fedex, DHL,USPS
Where is the industry going...
7. Products & Services Segmentation
4.90%
12.40%
12.50%
70.20%
Product & Service segmentation
Messengers and
local deliveries
Domestic air
transit deliveries
International air
transit deliveries
Ground deliveries
Source: ibisworld
The segment of ground deliveries have not fluctuated in the past five years. Industry
operators include bus lines, messenger services, car services, food product delivery,
bicycle courier companies, specialized bank documents. Consumers move from express
services to more affordable ground services.
0.00%
10.00%
20.00%
30.00%
40.00%
50.00%
60.00%
70.00%
80.00%
90.00%
UPS DHL FedEx
United States Revenue International
10. 2. The Current State of the Industry
Genesis:
Where it All
Began
Current State of the
Industry
11. Growing Industry
Revenue 38.2 Billion
Operational results 4,371
Number of employees 398,300
Number of vehicles 94,946
Number of aircraft 523
Number of company representatives 220
12. Tight Competition in CEP
2
$0
$10
$20
$30
$40
$50
$60
2011 2012 2013 2014 2015 2016
MILLION
REVENUE UPS REVENUE FEDEX REVENUE DEUTSCHE POST AG
UPS FDX
Operating Margin 11.97 8.86
Net Margin 7.34 5.36
EBITDA Margin 15.59 14.42
ROIC 20% 13%
ROE 78% 17%
Debt/EBITDA 1.57 0.79
Debt (adj. for op. 1.86 2.96
Leases)/EBITDA
1.96%
6.01%
3.76%
4.55%
8.50%
HUB GROUP UPS FEDEX Industry S&P 500
Net Margin 5 Yr. Avg.
Sources: CSIMarket, STATISTA
13. Global vs. U.S.
GDP growth in 2016 - expected to expand
2.5% in the U.S. and 3.4% globally
E-commerce growth & Technology Deployments Profits CEP
$-
$50
$100
$150
$200
$250
$300
2011 2012 2013 2014 2015
BILLIONS
MARKET SIZE
GLOBAL US
0
50
100
150
200
250
300
1 2 3 4 5
THOUSAND
TOTAL EMPLOYEES
GLOBAL US
14. Positive Indicators
Revenue growth 3.2X UPS 4.1X FEDEX 0.1X DHL decline
Operating Profit Growth UPS & FEDEX decline, DHL increase
2011-2016 Compound Growth: 2.38%
Forecasted 2016-2021 Compound Growth: 2.83%
$0
$10
$20
$30
$40
$50
$60
2011 2012 2013 2014 2015 2016
MILLION
PROFIT MARGIN
UPS REVENUE UPS PROFIT FEDEX REVENUE
FEDEX PROFIT DEUTSCHE POST AG REVENUE DEUTSCHE POST AG PROFIT
4
Sources: Financials UPS, Fedex, TNT, DHL, Yamato
15. The BI declined 5.5%, still outperformed the S&P 500
2016 GDP forecast to 1.7% from 1.8%
Deutsche Post down 22.3%
FedEx also down 12.5%
Decline in Express Stocks Milder than Broader
Market Weakness
Source: Bloomberg Report
16. Express Carriers' P/E Drop Mirrors
Decline in Broader Market
13% median EPS gain on 4%
higher revenue in 2016
UPS trades P/E ratio of 18.5x
6% premium to the S&P 500
FedEx trades at 11.4%
discount
Deutsche Post trades at a
10% premium to Germany's
DAX Index
6
Source: Bloomberg Report
17. Stock Performance in the CEP Industry
Worst performing Stocks
Yamato Holdings Co -6.09%
Deutsche Post Ag -5.91%
Expeditors International
of Washington Inc. -2.93%
Royal Mail PLC -0.99%
Atlas Air Worldwide -0.84%
Best performing stocks
ATSG 54.56%
TNT Express 15.56%
FedEx Corp. 9.07%
Forward Air Corp 6.51%
UPS 1.68%
7
Source: Bloomberg Report
18. Profitability Decline
ROA decreased 2.83 %, due to
deterioration of net income -49.93%
ROE decreased compare to
previous year to 7 %
Sources: Fedex; Yahoo Finance
19. Global Consumer Spending Growth: a Potential
Opportunity for the Industry
Data Source: Euromonitor International
Industry revenue is expected to grow due to increasing demand from consumers.
As spending increases, more items will need to be delivered using courier services.
- A good portion of consumer spending goes to online shopping.
- Businesses that offer services to consumers also need more goods to be shipped
Manufacturing goods, supplies, materials, etc.
$200
$210
$220
$230
$240
$250
$260
$0
$5
$10
$15
$20
$25
$30
$35
$40
$45
$50
2010 2011 2012 2013 2014 2015 2016 2017 2018
Billiom
Trillion
Industry Revenue - World World Consumer Expenditure - World
20. Changes in World Trade Volume to Impact Revenue Growth
Data Source: IBIS World
The global economic slowdown caused the total world trade to decline in 2009, as the largest
economies in the world went into recession. Consequently, demand for the transportation of packages
and parcels diminished, causing industry revenue to plummet in 2009.
As the economy recovered, world trade bounced back to positive numbers and has been growing
steadily but at a low rate
0
5.4 3.7
-12.8
7.1 6.5
-0.3
0.8 1.1 0.7 0.7
15.72
17.42
14
-19.3
19 18.87
1.57 3.24 1.75 2.8 2.89
2006 2007 2008 2009 2010 2011 2012 2013 2014 2015 2016
% Revenue Growth % Change in world trade volume
21. Global E-Commerce Market Growth Boosts Package Volume
Source: Bloomberg
Growth in e-commerce in various other economies such as Europe, India, and China opens up new
opportunities for international players such as FedEx and UPS.
Retailers everywhere want to expand their operations to include online shopping
- This will result in higher demand for package delivery
22. Tech Innovation Goes Goth Ways
Challenges Opportunities
No oil needed!
Digital Documents
Image Sources: Google Images
Fastest route
Pocket PC, e-sign
23. Growing
Consumer
Expenditure
• Increases demand
Growing
Trade
Volumes
• Increases demand
• Enhances supply-chain
Increase of
Internet
Usage
• Drives e-commerce
growth
• Decreases need for
couriered documents
• Improves customer
relationship
• Lowers costs
External Trends Matter in Terms of Revenue Growth
Data Source: IBIS World
24. Reaching a Plateau
Source: IBIS World
-
Mail revenue 2012-2014
Bubble size indicates
2014 revenues in US$
Mail Volume 2012-2014
Revenue by type of services: 2007 to 2014
Ø From 2013 to 2014 mail volumes declined by a mere 1.6%
Ø Global compound annual growth rate since 2010 is 2.6%
Ø All countries are experiencing a decline in transaction mail; however, there are some regional differences.
Ø In 2007 mail comprised 55% of total revenue while in 2014 it went down to 44%
Sources: Accenture, News Reports, Financial Times
Mail Parcels Logistics Financial Services Retail Others
25. Recalibrating
Source: IBIS World
-
Parcel revenue 2012-2014
Bubble size indicates
2014 revenues in US$
Parcel Volume 2012-2014
Global parcel market volume (millions) and growth rate
2009-2014
Ø From 2013 to 2014: healthy parcel volume growth of 5%
Ø Global compound annual growth rate since 2009 is 6%
Ø Overall, revenue and volume growth is relatively balanced across companies
Ø The growth in parcels delivery is driven by eCommerce
Sources: Accenture, News Reports, Financial Times
26. Invest in Parcels Opportunity
Source: IBIS World
Parcel volume growth, revenue growth and yield by performer group: 2012 to 2014
Ø The top 10 performers in the industry have achieved significantly better volume
and revenue growth
Ø Clear correlation emerges between volume, revenue growth and high
performance
Sources: Accenture, News Reports, Financial Times
27. B2C Implications
Source: IBIS World
UK Cyber Monday – 2014 China Singles Day – 2013
39%
86%
166 million
10x
More parcels than previous Monday
More cross-border shipments than
previous year
Shipments across China
Greater than average daily shipping
volume
Sources: Financial Reports, Metapack, Accenture, News Reports
Ø Although B2C is driving growth; it is also exposing delivery companies to more volatility in demand
Dec 2013: “UPS admits it was unprepared for the late surge in
online holiday shopping.”
28. Competition Basis
Sources: IBIS World, Morgan Stanley, FedEx Annual Report, UPS Annual Report, AllBusiness, PAConsulting
Ø Competition level of CEP industry is HIGH
Ø Prompt delivery is crucial
Ø Bigger fleet and brand recognition will help gain
market share
Ø Long-term contracts ensure constant stream of
revenue
29. Price vs. Reliability
Sources: Prestashop, USPS UPS, FedEx
Ø USPS focuses on being the low-cost provider; however, the reliability is it’s Achilles Heel
Ø UPS can be slightly more expensive than FedEx
Ø Both UPS and FedEx take delivery time very seriously
30. Head-to-Head Competition
Source:
Stamps.com
Packages
shipped from
three cities to
all shipping
zones
Total number
of scans per
package
Average
total days
to delivery
Average cost
to ship a 2 lb.
package
Ø 144 packages shipped using the USPS, FedEx and UPS
Ø From: Chicago, Los Angeles and Virginia
Ø To: all 8 shipping zones
Ø Earned discounts and fuel surcharge were added for FedEx and UPS Source: Stamps
33. PSP (People – Service - Profit)
policy
A belief that motivated people
provide necessary professional
service to ensure profits and
continued growth
A belief that value could
be added to firm’s
operations if they were to
deliver on an overnight
basis
A belief to present an IT as a
strategic and sustainable
competitive advantage rather than
order taking function or a cost
element
Ranked #8 on the World’s Most Admired Companies
Source: Human Resource Management: Best Practices at FedEx Corpoation. FedEx.
People First Leadership Speed and Reliability Information Technology
34. $39,304.00
$42,680.00 $44,287.00 $45,567.00
$47,453.00
2011 2012 2013 2014 2015
Total Revenues
2011
2012
2013
2014
2015
$2,378.00
$3,186.00
$4,434.00
$3,815.00
$1,867.00
Operating Income
ü Increase in revenues by 4%
from 2014 and 7% from 2013
ü Revenues well over industry
average of $32,400
ü Increase in operating expenses:
volume-related growth in employees
salaries, benefit plans and
transportation expenses
ü Capital expenditures: investing in
long term assets and acquisition of
TNT and GENCO logistic companies
’s Income Statement
Source: FedEx Annual Report 2015. FedEx.
35. $0.11
$0.08
$0.16
$0.31
$0.48
2011 2012 2013 2014 2015
Debt / Equity ratio
0
0.5
1
1.5
2
2.5
3
3.5
4
4.5
5
FedEx UPS
0.48
4.54
Debt / Equity ratio
’s Balance Sheet
ü Even though D/E ratio is growing, FedEx operates with less risk for
future earnings
ü High D/E ratio indicates that the firm has been borrowing aggressively
to finance its growth and as a result may experience a burden of
additional interest expense
Source: Long Term Debt. CSIMarket.
36. $90.96
$87.13
$94.75
$142.51
$172.09
2011 2012 2013 2014 2015
Stock performance
0
10
20
30
40
50
60
UPS
FedEx
19.71
56.21
P / E Ratio
and its Market
Source: FedEx Competitors. Yahoo Finance.
ü Investors believe in FedEx
positive future performance
ü Investors willing to pay more
for the company’s shares
37. Continually seeking new ways to market to its core
audience of business executives who tend to be
huge sports fans
’s Strategic Partnerships
Source: For Building Ties to a Sport a Platform Worth Every Penny. The New York Times.
ü Golfers from around
the world
ü FedEx field –
expensive marketing
initiative that was
paid off in the eyes of
marketing executives
ü Events that
broadcast worldwide
38. Alternative Methods of
Delivery
Retail giant
removed the
middle firm in the
supply chain and
started offering
their own same day
delivery
Offers same day
delivery services by
contracting
personal drivers,
bikers and even taxi
Traditional firms will
have to develop
strategies to compete
against companies that
deliver quickly and
after business hours
Source: Walmart Tests same day delivery. USA Today.
39. ü Anticipation of roller coaster in
transportation costs
ü Uncertainty of oil prices and its
influence on transportation
costs in the next ten years
ü Contracted couriers add
flexibility to customers
ü Contracted couriers save on
overhead of keeping drivers and
delivery professionals on staff
Operating and Labor Costs
Source: This Time, Cheaper Oil Does Little for the US Economy. The New York Times.
40. 4. Further Adaptation of Technology
Genesis:
Where it All
Began
Current State of the
Industry
Industry
Attractiveness
FedEx’s Position
41. Digital &
Electronic
Documents
Few Choices
to deliver
non-
document
Parcels
Threat of New
Entrants
Well-known
Reputation
Loyal
Customers
Differentiation
High Initial
Investment
Regulations
Industry
Rivalry
Pricing
Innovation
Supplier
Power
Oil Prices
Labor Cost
Buyer Power
Price
Sensitivity
Knowledgeable
Power
Selective
Market
Lower
Switching
Cost
Substitute
Competition
Mature Industry Requires
Differentiation
Sources: IBIS, CSIMarket, MarketResearch
Low threat of New Entrants and Substitutes makes Industry
“Relatively Attractive”
42. Change in the Society
Source: IBIS World
other
B2B vs. B2C vs. revenue
breakdown
Ø Realignment of volume mix from B2B to B2C by year 2020
Ø B2C contribute significantly less to the bottom line
Ø The majority of revenue is generated by B2B parcels
Ø High performers deliver better B2C profits and stimulate B2B growth
Source: Accenture Analysis
other
B2B vs. B2C vs. volume
breakdown
2013 2020 2013 2020
2013 2020 2013 2020 2013 2020
North America Western Europe Asia Pacific
2013 2020
43. Rise of the Digital Consumer
Source: Accenture Analysis
44. As More Shopping is Done Online, Faster Delivery is Required
Combined “buy online” paths
amount to 60% of chosen paths
to shop
5%
7%
9%
11%
13%
15%
40%
Buy online, pick up in store
Search online and in store,
buy in store
Search online and in store,
buy online
Search in store, buy online
Search online, buy in store
Search in store, buy in
store
Search online, buy online
Share of respondents
Most Used paths to shop
Shoppers in the US are sensitive to the time it takes for the item to be
delivered
• Same day delivery and one/two day delivery are the preferred
delivery options users are willing to pay
61%
58%
43%
38% 37%
15%
7%
0.0%
10.0%
20.0%
30.0%
40.0%
50.0%
60.0%
70.0%
Same day
delivery
One/two
delivery
Specific time
frame for
delivery
pick up from
a convenient
location
90-minute
delivery for
store-based
purchase
Locker/box
collection
Other
Shareofrespondents
Preferred methods of delivery
Sources: PWC, Statista
45. A Strategy Fit for the
Future
Radical ideas rely on a combination of
technology change and business
model innovation
Convergence represents an
opportunity to define the direction of
industry by harnessing the power of
both technology change and business
model innovation.
Invest in R&D:
• simplified orders
• Perfect fit packaging with
customized tracking chip
that facilitates real time
tracking
Utilize Drone technology for
faster, lower cost deliveries
From customer oriented
service to customized
service
Localized, urban delivery
models
NewClosetoexisting
Technologychange
Close to existing New
Business model change
Breakthrough ideas
Game changers
Radical ideas
New businesses
Incremental ideas
Protect/improve existing
Breakthrough ideas
Game changers
46. The Drone Delivery Business Model
Product
purchased:
• Within 10-20 miles
of a warehouse.
Order goes to
warehouse:
• Packaged and
place in a special
box.
Drone picks up
the order:
• Comes down a
conveyor belt and
is held on by
clamps.
Off it Goes:
• Using GPS co-
ordinates to locate
customers, the
drone drops off the
box and returns to
warehouse.
Challenges:
Requires a distribution center within 20 miles of the delivery
location
Requires a 20 x 20 feet landing area for safe landing
Current FAA regulation limits drone flights within line of sight and
under 400 feet above ground.
Potential Success:
Medical samples/supplies delivery
3D printing Industry
47. FedEx - Acquisitions
1984:
First acquisition – Gelco
Express Internatiional
2012
Opek Sp.z.o.o. and
TATEX Rapidao Cometa
1973
Federal Express is
formed
2011
AFL Pvt. Ltd MultiPack
2015
GENCO
2014
Bongo International
Supaswift
2006
ANC Holdings Limited
Watkins Motor Lines
1998
Caliber System Inc.
2004
Kinko’s Inc. Parcel
Direct
Source: FedEx investors
1989
Tiger International Inc.
2007
Flying Cargo Hungary
DTW Group & PAFEX
2001
American
Freightways Corp.
48. Decrease global community investement by only $1 million
Reinvest in 100 new hires
Cost per one new hire = 60K (salary) +10K (onboarding) = 70K per year
Total 700K for 100 new hires
Current employees – 265,000 (FedEx), 435,000 (UPS),
497,745 (DHL)
.
$200 Million
Change from Customer-Oriented Service to
Customized Services
Global Community
Investment by 2020
Benefits
- exclusive contracts – increase in revenue
- inside knowledge about customer needs
- improvement
Source: FedeEx, SHRM
49. Security Chip
Prevent losses of
packages
Technology Innovation
R & D
Decrease Cost of
Insurance
Real Time Tracking
System
Live Chat Support
Access 24/7
Reduce Volume of
calls during the day
50. Visibility Creates Transparency
The Best Life-Tracking Apps of 2016
For healthy eating & weight loss
For exercise and fitness
For sleeping
For mood improvement
For time management
For goal – setting
For mindfulness
For budgeting
Life-tracking apps of the future
Source: TechCrunch
54. Current State of Industry
Strong steady
financial
growth
Favorably
economic
trends
Highly
competitive
environment
Future Perspective
Focus on
customized
services
Simplified user
software
Custom fit
packaging
What Have We Learned