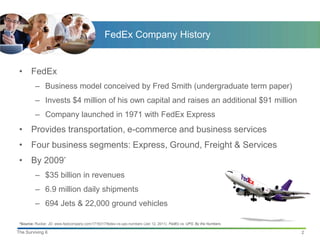
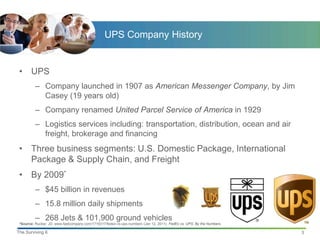
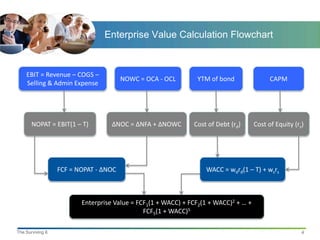
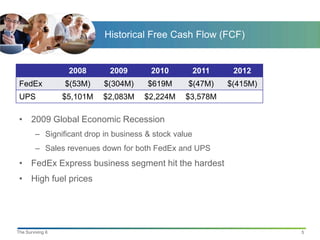
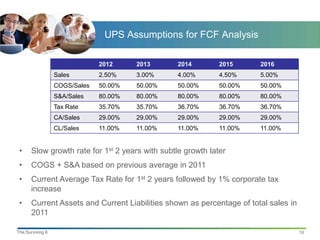
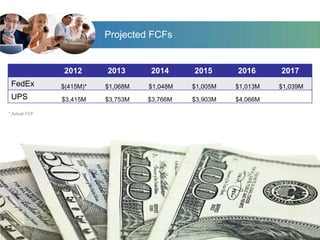
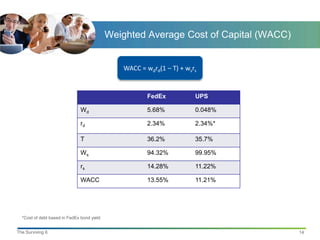
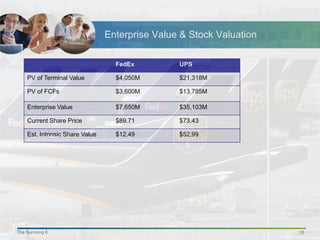
FedEx Company History


 • FedEx
          – Business model conceived by Fred Smith (undergraduate term paper)
          – Invests $4 million of his own capital and raises an additional $91 million
          – Company launched in 1971 with FedEx Express
 • Provides transportation, e-commerce and business services
 • Four business segments: Express, Ground, Freight & Services
 • By 2009*
          – $35 billion in revenues
          – 6.9 million daily shipments
          – 694 Jets & 22,000 ground vehicles

 *Source: Rucker. JD. www.fastcompany.com/1716317/fedex-vs-ups-numbers (Jan 12, 2011). FedEx vs. UPS: By the Numbers.

The Surviving 6                                                                                                         2
UPS Company History


 • UPS
          – Company launched in 1907 as American Messenger Company, by Jim
            Casey (19 years old)
          – Company renamed United Parcel Service of America in 1929
          – Logistics services including: transportation, distribution, ocean and air
            freight, brokerage and financing
 • Three business segments: U.S. Domestic Package, International
   Package & Supply Chain, and Freight
 • By 2009*
          – $45 billion in revenues
          – 15.8 million daily shipments
          – 268 Jets & 101,900 ground vehicles
 *Source: Rucker. JD. www.fastcompany.com/1716317/fedex-vs-ups-numbers (Jan 12, 2011). FedEx vs. UPS: By the Numbers.

The Surviving 6                                                                                                         3
Enterprise Value Calculation Flowchart


    EBIT = Revenue – COGS –
                                       NOWC = OCA - OCL        YTM of bond                 CAPM
    Selling & Admin Expense


       NOPAT = EBIT(1 – T)         ΔNOC = ΔNFA + ΔNOWC        Cost of Debt (rd)      Cost of Equity (rs)


                  FCF = NOPAT - ΔNOC                              WACC = wdrd(1 – T) + wsrs


                         Enterprise Value = FCF1(1 + WACC) + FCF2(1 + WACC)2 + … +
                                              FCF5(1 + WACC)5

The Surviving 6                                                                                        4
Historical Free Cash Flow (FCF)


                   2008      2009       2010           2011    2012
 FedEx            $(53M)    $(304M)    $619M      $(47M)      $(415M)
 UPS              $5,101M   $2,083M   $2,224M     $3,578M

 • 2009 Global Economic Recession
        – Significant drop in business & stock value
        – Sales revenues down for both FedEx and UPS
 • FedEx Express business segment hit the hardest
 • High fuel prices


The Surviving 6                                                         5
General Assumptions for FCF Analysis


 General
 •    Global economic recovery timeline
        – Reduced earnings forecasts in 2012/13
        – Trade volumes
        – High fuel prices
 •    Corporate tax increase
 •    Boost profits by increasing shipping rates


The Surviving 6                                                     6
FedEx Assumptions for Future FCF


 FedEx
 •    Strategic acquisitions in growing global markets (Mexico, Poland, France
      and Brazil)
 •    Cost Cutting Plan
        – Boost profits by $1.7 billion annually through shedding jobs, aircraft and
          underused assets
        – 3-year plan starting in 2012
 •    International Expansion
        – South Africa, Italy, Istanbul and Turkey


The Surviving 6                                                                        7
FedEx Assumptions for FCF Analysis

                               2013     2014     2015     2016       2017
                  Sales        1.25%    1.75%    2.00%    2.50%      2.50%
                  COGS/Sales   50.00%   50.00%   50.00%   50.00%     50.00%
                  S&A/Sales    70.00%   70.00%   70.00%   70.00%     70.00%
                  Tax Rate     37.50%   37.50%   38.50%   38.50%     38.50%
                  CA/Sales     38.94%   38.27%   37.51%   36.60%     35.53%
                  CL/Sales     23.00%   23.00%   23.00%   23.00%     23.00%


 •    Weighted average of sales growth in past years = 1.65%. Expect small drop
      followed by increase with economic recovery
 •    COGS + S&A based on previous average
 •    Current Average Tax Rate for 1st 2 years followed by 1% corporate tax
      increase
 •    Current Assets and Current Liabilities shown as percentage of total sales

The Surviving 6                                                                   8
UPS Assumptions for FCF Analysis


 UPS
 •    FY13 rate increase
        – 4.5% for UPS Air (4.9% for select destinations)
        – 4.9% for UPS Ground
 •    Expand main European air hub in Cologne, Germany by 70%
        – 190,000 packages per hour
        – Targeted completion in 2013
 •    Planned Acquisition of TNT in 2012


The Surviving 6                                                 9
UPS Assumptions for FCF Analysis

                               2012     2013     2014        2015      2016
                  Sales        2.50%    3.00%    4.00%       4.50%     5.00%
                  COGS/Sales   50.00%   50.00%   50.00%      50.00%    50.00%
                  S&A/Sales    80.00%   80.00%   80.00%      80.00%    80.00%
                  Tax Rate     35.70%   35.70%   36.70%      36.70%    36.70%
                  CA/Sales     29.00%   29.00%   29.00%      29.00%    29.00%
                  CL/Sales     11.00%   11.00%   11.00%      11.00%    11.00%


 •    Slow growth rate for 1st 2 years with subtle growth later
 •    COGS + S&A based on previous average in 2011
 •    Current Average Tax Rate for 1st 2 years followed by 1% corporate tax
      increase
 •    Current Assets and Current Liabilities shown as percentage of total sales in
      2011

The Surviving 6                                                                      10
Projected FCFs


                      2012       2013      2014      2015      2016      2017
 FedEx                $(415M)*   $1,068M   $1,048M   $1,005M   $1,013M   $1,039M
 UPS                  $3,415M    $3,753M   $3,766M   $3,903M   $4,066M

* Actual FCF


    The Surviving 6                                                           11
Bond Yields (rd)


 • FedEx
        – 20-year bond, non-callable, non-transferable
        – Price $102.50, YTM 2.337%
        – Bond Rating BBB, low-medium grade
 • FedEx rd used as approximation for UPS rd
        – No qualifying bonds for UPS
 • Cost of Debt
        – rd = YTM = 2.337%
        – For WACC calculation….. rd = 2.337% * (1-.362) = 1.49%


The Surviving 6                                                    12
Cost of Equity (rs)

                        CAPM                FedEx             UPS

                        rRF                 4.69%             4.69%

                        RPM                 7.74%             7.74%

                        β                   1.2386            0.8432

                        Cost of Equity      14.28%            11.22%


     DCF              FedEx        UPS               Bond Yield + Risk Premium

     D0               $0.54        $2.28             Yield                2.337%

     D1               $0.58        $2.42             Risk Premium         5.00%

     P0               $91.46       $72.50            Cost of Equity       7.337%

     g                7.70%        6.17%

     Cost of Equity   8.34%        9.51%


The Surviving 6                                                                    13
Weighted Average Cost of Capital (WACC)


                                               WACC = wdrd(1 – T) + wsrs


                                                       FedEx           UPS

                               Wd                      5.68%           0.048%

                               rd                      2.34%           2.34%*

                               T                       36.2%           35.7%

                               Ws                      94.32%          99.95%

                               rs                      14.28%          11.22%

                               WACC                    13.55%          11.21%


  *Cost of debt based in FedEx bond yield


The Surviving 6                                                                       14
Enterprise Value & Stock Valuation

                                    FedEx         UPS

     PV of Terminal Value           $4,050M       $21,318M

     PV of FCFs                     $3,600M       $13,785M

     Enterprise Value               $7,650M       $35,103M

     Current Share Price            $89.71        $73.43

     Est. Intrinsic Share Value     $12.49        $52.99


The Surviving 6                                                        15
Questions?

FedEx vs UPS - Managerial Finance

  • 2.
    FedEx Company History • FedEx – Business model conceived by Fred Smith (undergraduate term paper) – Invests $4 million of his own capital and raises an additional $91 million – Company launched in 1971 with FedEx Express • Provides transportation, e-commerce and business services • Four business segments: Express, Ground, Freight & Services • By 2009* – $35 billion in revenues – 6.9 million daily shipments – 694 Jets & 22,000 ground vehicles *Source: Rucker. JD. www.fastcompany.com/1716317/fedex-vs-ups-numbers (Jan 12, 2011). FedEx vs. UPS: By the Numbers. The Surviving 6 2
  • 3.
    UPS Company History • UPS – Company launched in 1907 as American Messenger Company, by Jim Casey (19 years old) – Company renamed United Parcel Service of America in 1929 – Logistics services including: transportation, distribution, ocean and air freight, brokerage and financing • Three business segments: U.S. Domestic Package, International Package & Supply Chain, and Freight • By 2009* – $45 billion in revenues – 15.8 million daily shipments – 268 Jets & 101,900 ground vehicles *Source: Rucker. JD. www.fastcompany.com/1716317/fedex-vs-ups-numbers (Jan 12, 2011). FedEx vs. UPS: By the Numbers. The Surviving 6 3
  • 4.
    Enterprise Value CalculationFlowchart EBIT = Revenue – COGS – NOWC = OCA - OCL YTM of bond CAPM Selling & Admin Expense NOPAT = EBIT(1 – T) ΔNOC = ΔNFA + ΔNOWC Cost of Debt (rd) Cost of Equity (rs) FCF = NOPAT - ΔNOC WACC = wdrd(1 – T) + wsrs Enterprise Value = FCF1(1 + WACC) + FCF2(1 + WACC)2 + … + FCF5(1 + WACC)5 The Surviving 6 4
  • 5.
    Historical Free CashFlow (FCF) 2008 2009 2010 2011 2012 FedEx $(53M) $(304M) $619M $(47M) $(415M) UPS $5,101M $2,083M $2,224M $3,578M • 2009 Global Economic Recession – Significant drop in business & stock value – Sales revenues down for both FedEx and UPS • FedEx Express business segment hit the hardest • High fuel prices The Surviving 6 5
  • 6.
    General Assumptions forFCF Analysis General • Global economic recovery timeline – Reduced earnings forecasts in 2012/13 – Trade volumes – High fuel prices • Corporate tax increase • Boost profits by increasing shipping rates The Surviving 6 6
  • 7.
    FedEx Assumptions forFuture FCF FedEx • Strategic acquisitions in growing global markets (Mexico, Poland, France and Brazil) • Cost Cutting Plan – Boost profits by $1.7 billion annually through shedding jobs, aircraft and underused assets – 3-year plan starting in 2012 • International Expansion – South Africa, Italy, Istanbul and Turkey The Surviving 6 7
  • 8.
    FedEx Assumptions forFCF Analysis 2013 2014 2015 2016 2017 Sales 1.25% 1.75% 2.00% 2.50% 2.50% COGS/Sales 50.00% 50.00% 50.00% 50.00% 50.00% S&A/Sales 70.00% 70.00% 70.00% 70.00% 70.00% Tax Rate 37.50% 37.50% 38.50% 38.50% 38.50% CA/Sales 38.94% 38.27% 37.51% 36.60% 35.53% CL/Sales 23.00% 23.00% 23.00% 23.00% 23.00% • Weighted average of sales growth in past years = 1.65%. Expect small drop followed by increase with economic recovery • COGS + S&A based on previous average • Current Average Tax Rate for 1st 2 years followed by 1% corporate tax increase • Current Assets and Current Liabilities shown as percentage of total sales The Surviving 6 8
  • 9.
    UPS Assumptions forFCF Analysis UPS • FY13 rate increase – 4.5% for UPS Air (4.9% for select destinations) – 4.9% for UPS Ground • Expand main European air hub in Cologne, Germany by 70% – 190,000 packages per hour – Targeted completion in 2013 • Planned Acquisition of TNT in 2012 The Surviving 6 9
  • 10.
    UPS Assumptions forFCF Analysis 2012 2013 2014 2015 2016 Sales 2.50% 3.00% 4.00% 4.50% 5.00% COGS/Sales 50.00% 50.00% 50.00% 50.00% 50.00% S&A/Sales 80.00% 80.00% 80.00% 80.00% 80.00% Tax Rate 35.70% 35.70% 36.70% 36.70% 36.70% CA/Sales 29.00% 29.00% 29.00% 29.00% 29.00% CL/Sales 11.00% 11.00% 11.00% 11.00% 11.00% • Slow growth rate for 1st 2 years with subtle growth later • COGS + S&A based on previous average in 2011 • Current Average Tax Rate for 1st 2 years followed by 1% corporate tax increase • Current Assets and Current Liabilities shown as percentage of total sales in 2011 The Surviving 6 10
  • 11.
    Projected FCFs 2012 2013 2014 2015 2016 2017 FedEx $(415M)* $1,068M $1,048M $1,005M $1,013M $1,039M UPS $3,415M $3,753M $3,766M $3,903M $4,066M * Actual FCF The Surviving 6 11
  • 12.
    Bond Yields (rd) • FedEx – 20-year bond, non-callable, non-transferable – Price $102.50, YTM 2.337% – Bond Rating BBB, low-medium grade • FedEx rd used as approximation for UPS rd – No qualifying bonds for UPS • Cost of Debt – rd = YTM = 2.337% – For WACC calculation….. rd = 2.337% * (1-.362) = 1.49% The Surviving 6 12
  • 13.
    Cost of Equity(rs) CAPM FedEx UPS rRF 4.69% 4.69% RPM 7.74% 7.74% β 1.2386 0.8432 Cost of Equity 14.28% 11.22% DCF FedEx UPS Bond Yield + Risk Premium D0 $0.54 $2.28 Yield 2.337% D1 $0.58 $2.42 Risk Premium 5.00% P0 $91.46 $72.50 Cost of Equity 7.337% g 7.70% 6.17% Cost of Equity 8.34% 9.51% The Surviving 6 13
  • 14.
    Weighted Average Costof Capital (WACC) WACC = wdrd(1 – T) + wsrs FedEx UPS Wd 5.68% 0.048% rd 2.34% 2.34%* T 36.2% 35.7% Ws 94.32% 99.95% rs 14.28% 11.22% WACC 13.55% 11.21% *Cost of debt based in FedEx bond yield The Surviving 6 14
  • 15.
    Enterprise Value &Stock Valuation FedEx UPS PV of Terminal Value $4,050M $21,318M PV of FCFs $3,600M $13,785M Enterprise Value $7,650M $35,103M Current Share Price $89.71 $73.43 Est. Intrinsic Share Value $12.49 $52.99 The Surviving 6 15
  • 16.